Abstract
Hemoglobin (Hb) S-Oman has two mutations in the β-chains. In addition to the classic βS mutation (β6 Glu → Val), it contains a second mutation in the same chain (β121 Glu → Lys) identical to that of HbOARAB. We have studied a pedigree of heterozygous carriers of HbS-Oman that segregates into two types of patients: those expressing about 20% HbS-Oman and concomitant −/ thalassemia and those with about 14% of HbS-Oman and concomitant −/− thalassemia. The higher expressors of S-Oman have a sickle cell anemia (SS) clinical syndrome of moderate intensity, while the lower expressors have no clinical syndrome, and are comparable to the solitary case first described in Oman. In addition, the higher expressors exhibit a unique form of irreversibly sickled cell reminiscent of a “yarn and knitting needle” shape, in addition to folded and target cells. The CSAT of S-Oman is identical to that of S-Antilles, another supersickling hemoglobin, whose carriers express the abnormal hemoglobin at 40% to 50%, with a very similar clinical picture to HbS-Oman. Because the level of expression is so different and the clinical picture so similar, and based on the hemolysates CSAT’s, we conclude that HbS-Oman produces pathology beyond its sickling tendencies. A clue for this additional pathogenesis is found in the fact that homozygous HbOARAB, which has the same second substitution as S-Oman, has a moderately severe hemolytic anemia; when HbOARAB is combined with HbS, it makes the phenotype of this double heterozygote as severe as SS. Properties of HbS-Oman red blood cells (RBCs) include reticulocytes that are much denser than normal (similar to those of SC and CC disease), a decrease in the Km for Ca2+ needed to activate the Gardos’ channel (making this transporter more sensitive to Ca2+), increased association of HbS-Oman with the RBC membrane, the presence of dense cells by isopycnic gradient, the presence of folded cells, and abundant nidus of polymerization under the membrane. Other properties include a clear increase in volume and N-ethylmaleimide–stimulated K:Cl cotransport in RBCs expressing more than 20% HbS-Oman. We conclude that the pathology of heterozygous S-Oman is the product of the sickling properties of the β6 Val mutation which are enhanced by the second mutation at β121. In addition, the syndrome is further enhanced by a hemolytic anemia induced by the mutation at β121. We speculate that this pathology results from the abnormal association of the highly positively charged HbS-Oman (3 charges different from normal hemoglobin) with the RBC membrane.
SICKLE TRAIT red blood cells (RBCs) usually do not sickle at pH 7.4 and the peripheral blood of carriers does not contain dense cells, irreversibly sickled cells, or exhibit increased reticulocyte counts. Furthermore, sickle trait individuals do not have splenomegaly. Hence, it is of particular interest that RBCs containing about 20% (the balance being hemoglobin [Hb] A) of a super polymerizing HbS, which is the result of two mutations (βS-Oman = β6 Glu → Val; β121 Glu → Lys) in the β-chain, have been observed to contain bizarrely deformed sickled cells (ISCs) in peripheral blood.1
The increased sickling tendencies of HbS-Oman is the consequence of the pro-sickling effects of the β121 mutation, Glu → Lys, which is also found as a single mutation in HbOARAB. The latter hemoglobin, when combined with HbS, produces a syndrome more severe than SC, but easily confused with SC because of the same electrophoretic pattern on cellulose acetate.
Purified S-Oman has a CSAT (solubility of the deoxy polymer) of 11 g/dL, much lower than HbS alone (CSAT = 17.8 g/dL).1 This result is interesting because another double mutant (Hb S-Antilles = β6 Glu → Val; 23 Val → Ile), has a similarly low CSAT and much higher expression (40% to 50%) in the trait form, but has a phenotype that is similar in intensity to the trait form of HbS-Oman.2 Hence, the identical intrinsic tendency to polymerize of these two super HbSs is in contradiction with the phenotype: S-Oman has the same effect as S-Antilles, but with half the level of expression. We need to look for other pathogenic properties of S-Oman that must be cellular in character.
In this report we examine the phenotype of S-Oman trait, in a larger number of individuals, and in more detail than in the original description of this abnormal Hb.1 We have also studied the interaction of this abnormal Hb with the RBC membrane and explored its capacity to increase the density of reticulocytes and to produce dense cells.
MATERIALS AND METHODS
Hematological parameters and cellular studies.
Blood counts (RBC, white blood cell [WBC], platelet count, mean cell volume [MCV], mean cell hemoglobin concentration [MCHC], and mean cell hemoglobin [MCH]) were performed with a Technicon 1 (Tarrytown, NY). HbF levels were determined by alkaline denaturation and agar electrophoresis with the standard methods. Deoxygenation, SEM, and TEM were performed also as described elsewhere.3
Hemolysate CSAT.
CSAT values were determined in a 0.1 mol/L potassium phosphate buffer, pH 7.35, at 25°C. The hemolysate was first deoxygenated with alternate vacuum and N2 and then Na dithionite was added to three times the final concentration of Hb. Samples were allowed to gel overnight at 25°C and were centrifuged the next day at 25°C for 2 hours at 35,000 rpm. Purified HbS in the same buffer was run as a control. The supernatants were removed anaerobically and Hb concentrations and deoxy pHs were determined.
Isoelectric focusing and high-performance liquid chromatography (HPLC).
The methods involved were conducted as described elsewhere.3
RBC membrane association with HbS-Oman and HbA in S-Oman heterozygote RBCs.
RBCs were lysed with distilled water and the sample was centrifuged to obtain supernatant 1, following the technique of Klipstein and Ranney.4 The RBC membranes obtained after removing supernatant 1 were extracted with an 8.6 pH buffer solution. The supernatant obtained after centrifugation was labeled supernatant 2. Both supernatants where analyzed by isoelectric focusing and HPLC.
HbS-Oman binding to normal RBC membranes.
“Leaky” RBC membranes (ghosts) were prepared from a hematologically normal (HbAA) individual as follows: RBCs were pelleted from whole blood by centrifugation at 500g for 10 minutes at 4°C, and washed three times with 5 mmol/L sodium phosphate, pH 7.4, 140 mmol/L sodium chloride (PBS). Each time the small buffy coat was carefully discarded. The washed RBCs were lysed with 5 mmol/L sodium phosphate, pH 8.0 (5P8) and the RBC membranes (ghosts) were collected by centrifugation at 15,000g for 15 minutes at 4°C. The membranes were washed with 5P8 until white. Residual Hb and glycolytic enzymes were stripped by incubating the ghosts with 20 vol of 10 mmol/L phosphate, pH 7.5, 0.5 mol/L sodium chloride for 30 minutes on ice. The ghosts were collected by centrifugation, as described above, and washed once with 10 mmol/L sodium phosphate pH 6.0 (10P6). Under these conditions, the ghosts do not reseal and are thus “leaky.” An aliquot was taken for protein determination using the BCA method (Pierce Chemical Co, Rockford, IL) after solubilization in 1% sodium dodecyl sulfate (SDS).
The ghosts (1 mg/mL final concentration) were incubated with purified HbAA or HbS-Oman (20 mg/mL final concentration) in 10P6 (final concentration) for 90 minutes at 4°C in a total volume of 0.2 mL while rotating. The incubations were run in triplicate. After the incubation, ghosts were collected by centrifugation, as described above, and washed vigorously four times with ice-cold 10P6. After the final wash, the ghosts were resuspended in 0.2 mL ice-cold 10P6 and 0.04 mL was removed for SDS-polyacrylamide gel electrophoresis (SDS-PAGE) analysis (see below). The remainder was solubilized by addition of 2 vol of 20 mmol/L sodium phosphate, pH 7.4, 125 mmol/L sodium chloride, 1.5% Triton X-100. Hb in the solubilized ghosts was measured using Drabkin’s reagent (Sigma, St Louis, MO), and compared with an Hb standard. Hb binding results were expressed as moles of Hb dimer bound per mole of ghost band 3. It was assumed that band 3 represents 30% of ghost total protein and has a molecular weight (MWr) of 90 kD.
SDS-PAGE.
Ghosts, 0.02 mg, were solubilized and the proteins separated by SDS-PAGE on 7.5% acrylamide gels using the Fairbanks continuous buffer system. The gels were stained with Coomassie brilliant blue, and the protein bands were quantitated by scanning laser densitometry.
Gradients (analytical and preparative).
RBCs were either used for determination of density distribution or separated by density gradient centrifugation into three fractions on a Percoll (colloidal silica coated with polyvinyl pyrrolidone; Pharmacia Fine Chemicals, Inc, Piscataway, NJ) and Larex (arabinogalactan polysaccharide; Larex International Inc, Roseville, MN) gradient as previously described.5 6
Measurements of RBC Ca2+-activated K+efflux.
The maximal activity of the Ca2+-activated K+efflux was determined under optimized conditions in the presence of the calcium-ionophore A23187 as previously described by Romero et al7 in the presence and absence of 10 μmol/L clotrimazole (CLT). CLT has been shown to be a potent, high-affinity inhibitor of Ca2+-activated K+ channels (Gardos Channel) in human RBCs.8 The ionophore A23187 was used to increase cytosolic ionized Ca2+ and clamp it at various levels. Net K+ efflux was determined by incubating cells in an Na+ media containing the A23187 (60 μmol/L of RBCs). The Na+ media contained (mmol/L): 140 NaCl, 10 Tris-MOPS pH 7.4 at 37°C, 0.1 ouabain (to inhibit the Na+ pump), 10 glucose, 0.15 MgCl2, 0.1 bumetanide (to inhibit Na+:K+:2Cl− cotransport), 1 EGTA or 1 Tris-citrate; and total CaCl2 varied between 0 and 100 μmol/L, A23187 (60 μmol/L of RBCs), at 1% hematocrit. This gives a cytosolic ionized Ca2+ that is between <0.1 nmol/L Ca2+ with 1 mmol/L EGTA and 20 μmol/L Ca2+ with 1 mmol/L citrate. Cytosolic ionized Ca2+ was buffered at <0.1 nmol/L Ca2+ with 1 mmol/L EGTA or at ≥5 μmol/L Ca2+with 1 mmol/L citrate. Initial rates of K+ efflux in RBCs were measured by sampling the efflux media in duplicate at 1, 3, 5, and 7 minutes in the presence or absence of 10 μmol/L CLT. In experiments where the Ca2+ was reduced to <0.1 nmol/L, the samples were taken at 1, 3.5, and 7 minutes. K+ efflux was calculated from the slope of the regression line of K+concentration versus time taking into account the volume of RBCs used. The slope ± SE of the linear regression was calculated using Enzfitter software for the personal computer. The CLT-sensitive Ca2+-activated K+ efflux was estimated by subtracting the flux in the presence of CLT from the total flux at various cytosolic calciums. The CLT-sensitive K+efflux was then analyzed as a function of the cytosolic ionized calcium using a nonlinear regression analysis. This allowed for estimation of the Vmax and Km for calcium stimulation of Ca2+-activated K+ efflux.
The total calcium concentration of the flux media was measured by atomic absorption spectrophotometry using calcium standards (EM Sciences, Cherry Hill, NJ) in sodium media. A custom-made computer program was used to calculate the Ca2+ concentrations using the dissociation constant and correcting for ionic strength at pH 7.4 and 0.15 mmol/L MgCl2 as previously described.8CLT was obtained from Sigma (St Louis, MO).
Measurements of volume and N-ethylmaleimide (NEM)-stimulated K+ fluxes.
The protocol followed was identical to the ones described in Romero et al.7
RESULTS
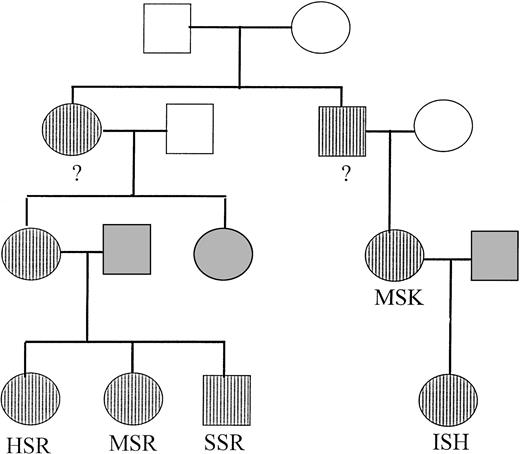
Clinical and laboratory values in five carriers of HbS-Oman.
The sample consists of three individuals with 20% to 23% Hb-S Oman (HSR, MSR, ISH) and two with levels of 13% and 14% (SSR, MSK) (Table 1 and pedigree in Fig 1). In the high S-Oman group all have silent carrier status for α-thalassemia, and correspondingly, they have moderately reduced MCV and MCH (70 to 76 fL and 23 to 25 pg). The second group, with low HbS-Oman expression, have concomitantly −α/−α status, and hence significantly lower MCV and MCH (66 to 67 fL and 68 fL and 21.4 to 21.7 pg). The level of anemia was also different between these groups: individuals with higher S-Oman had lower Hb than those with low levels of S-Oman and tended to have enlarged spleens. Correspondingly, reticulocyte counts tend to be lower in the latter than in the former. Nevertheless, the patient ISH is an exception, because she had a low reticulocyte count and the spleen was not palpable, probably due to young age. Finally, the HbF levels are only mildly to slightly elevated.
Hematological and Clinical Results in Five Heterozygous Carriers of Hb-Oman
| . | Age . | P* . | Hb g/dL . | MCV FL . | MCH pg . | RDW . | Recticulocytes % . | Spleen . | α Gene . | S-Oman % . | HbF % . |
|---|---|---|---|---|---|---|---|---|---|---|---|
| HSR | 18 | ++ | 9 | 75.7 | 25 | 23.4 | 4.9 | + | −α/αα | 22.3 | 1.65 |
| MSR | 11 | + | 8.3 | 69.0 | 23.2 | 29.2 | 5.4 | ++ | −α/αα | 19.7 | 4.6 |
| ISH | 6 | ++ | 9.9 | 70 | 23.2 | 17.9 | 1.9 | − | −α/αα | 19.8 | 2.2 |
| SSR | 37 | − | 13.8 | 66.3 | 21.7 | 13.9 | 1.3 | − | −α/−α | 14.7 | 0.76 |
| MSK | 40 | − | 11 | 66.8 | 21.4 | 15.8 | 1.1 | − | −α/−α | 12.6 | 0.73 |
Clinical phenotype.
Pedigree of the five heterozygous carriers of HbS-Oman described in Table 1. Hatched symbols indicate the presence of HbS-Oman in the heterozygous state. The question marks indicate the obligatory heterozygotes according to the pedigree.
Pedigree of the five heterozygous carriers of HbS-Oman described in Table 1. Hatched symbols indicate the presence of HbS-Oman in the heterozygous state. The question marks indicate the obligatory heterozygotes according to the pedigree.
Clinical records of three patients with high S-Oman expression show the following: MSR, 11 years old, had frequent painful crises and episodes of hypoxic encephalopathy and acute chest syndrome, qualifying for a severe phenotype; ISH, 6 years old, has frequent but mild painful crises; a third patient, HSR, 18 years old, with 22.3% S-Oman, required frequent transfusions between the ages of 3 and 10 and has had mild painful crises afterward. MoSR, a patient not included in the present series, 23 years old, 27% S-Oman, has had acute painful crises, acute chest syndrome, and episodes of pain in the shoulders. The two patients with 14% S-Oman (Table 1), plus another patient, female, 45 years old and 13.3% S-Oman (ZSK), report no clinical symptomatology.
Isopycnic gradient distribution of RBCs in S-Oman carriers.
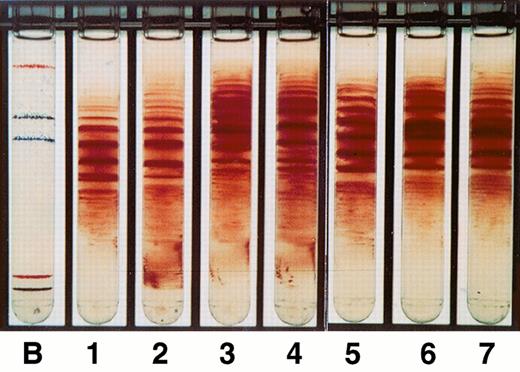
Figure2 depicts the isopycnic gradients for the five carriers. All of the patients had more light cells at the top of gradient, a consequence of the presence of α-thalassemia and hemolysis. The percent dense cells, compared with an AA subject, were increased in two of the high S-Oman expressors and less in the other three individuals. Not surprisingly, the exception was ISH, who was also different because she did not have a high reticulocyte count or a palpable spleen, and was only 6 years old. Dense cells are greatly decreased in early childhood sickle syndromes, most likely due to the presence of a relatively efficient spleen.
Percoll-Larex gradients of the five members of the pedigree. Lane B, density beads; lane 1, normal blood; lane 2, sickle cell anemia; lane 3, HSR (high HbS-Oman); lane 4, ISH (high HbS-Oman); lane 5 MSR (high HbS-Oman); lane 6 MSK (low HbS-Oman); lane 7 SSR (low HbS-Oman).
Percoll-Larex gradients of the five members of the pedigree. Lane B, density beads; lane 1, normal blood; lane 2, sickle cell anemia; lane 3, HSR (high HbS-Oman); lane 4, ISH (high HbS-Oman); lane 5 MSR (high HbS-Oman); lane 6 MSK (low HbS-Oman); lane 7 SSR (low HbS-Oman).
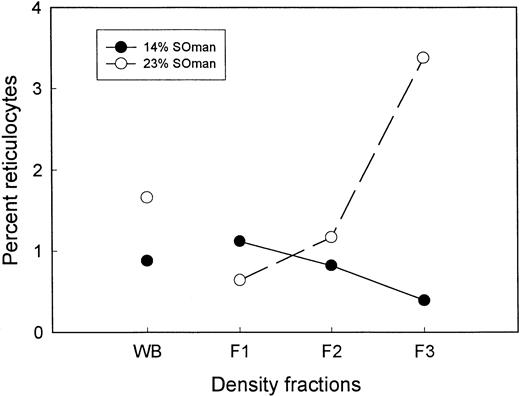
The isopycnic gradients were also used preparatively, which allowed separation of the cells into fractions 1, 2, and 3 of increasing density, which were then analyzed for the percent reticulocytes and irreversibly sickled cells. Figure 3depicts the percent reticulocytes as a function of increasing RBC density in both a low S-Oman patient (SSR; 14% S-Oman) and a high S-Oman patient (MSR; 20% S-Oman). Interestingly, the highest percentage in SSR is in the lightest fraction (F1), while in the high S-Oman patient, reticulocytes were located preferentially in the densest fraction (F3).
Reticulocyte count in three increasingly dense fractions isolated from the density gradient. The high S-Oman patient MSR (○) and the low S-Oman patient SSR (•). Notice that the highest percent of reticulocytes is found in F1 of SSR as is observed for AA, AS, and SS patients. The highest percent reticulocytes is found in F3 (the densest) in MSR, as is observed in CC and SC patients.
Reticulocyte count in three increasingly dense fractions isolated from the density gradient. The high S-Oman patient MSR (○) and the low S-Oman patient SSR (•). Notice that the highest percent of reticulocytes is found in F1 of SSR as is observed for AA, AS, and SS patients. The highest percent reticulocytes is found in F3 (the densest) in MSR, as is observed in CC and SC patients.
Blood smear and sickling of S-Oman trait RBCs.
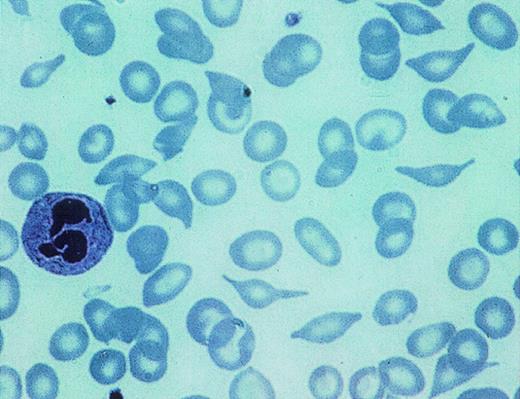
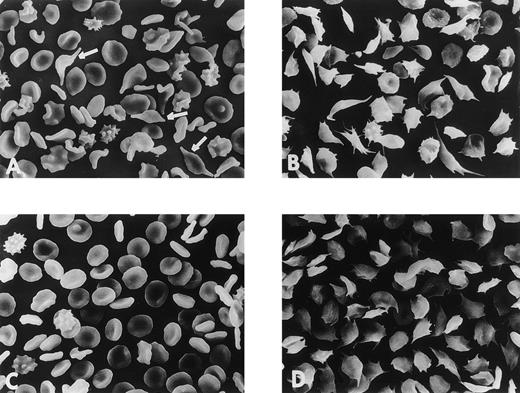
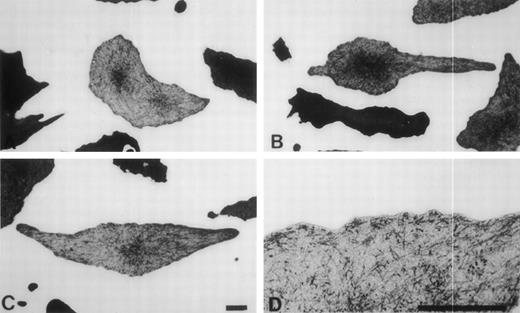
The most striking feature of the smear of the higher expressors of HbS-Oman was the presence of cells which appeared to be the consequence of a single polymerized domain of HbS-Oman traversing the RBC. Although the level of dehydration of these cells varied, they most frequently had little or no dehydration (Figs 4 [see page 4378] and 5). They suggest a “yarn/knitting needle” shape. These forms were very rare or absent in the blood of S-Oman patients with less than 15% S-Oman. These cells, when oxygenated, are devoid of polymer but retain their shape, qualifying for the name irreversibly sickled cells. When deoxygenated, they formed single or double domains, suggesting the presence of single or double nucleation events (Fig 6). Near the membrane, bunches of polymer were observed (Fig 6).
Hematoxyline-eosine stained smear of a patient with high S-Oman expression. The characteristic shapes that resemble a ball of yarn transversed by knitting needles of the irreversibly sickled cells found in these patients is clearly visible. Also visible are target cells and other deformed cells, including folded cells.
Hematoxyline-eosine stained smear of a patient with high S-Oman expression. The characteristic shapes that resemble a ball of yarn transversed by knitting needles of the irreversibly sickled cells found in these patients is clearly visible. Also visible are target cells and other deformed cells, including folded cells.
Scanning electron microscopy of RBCs from a high S-Oman patient. (A) Oxygenated; (B) deoxygenated. Notice the yarn/knitting needle shape of the irreversibly sickled cells characteristic of this disease, highlighted by white arrows. Notice that after full deoxygenation almost all of the cells sickled with long, thin protuberances. The lower two panels (C) and (D) are of a low S-Oman patient. (C) Oxygenated, looks quite normal except for a few echinocytic and otherwise deformed RBCs. No yarn/knitting needle cells. (D) Fully deoxygenated cells; again, almost all of the cells sickle, but with less elongated and numerous protuberances.
Scanning electron microscopy of RBCs from a high S-Oman patient. (A) Oxygenated; (B) deoxygenated. Notice the yarn/knitting needle shape of the irreversibly sickled cells characteristic of this disease, highlighted by white arrows. Notice that after full deoxygenation almost all of the cells sickled with long, thin protuberances. The lower two panels (C) and (D) are of a low S-Oman patient. (C) Oxygenated, looks quite normal except for a few echinocytic and otherwise deformed RBCs. No yarn/knitting needle cells. (D) Fully deoxygenated cells; again, almost all of the cells sickle, but with less elongated and numerous protuberances.
Transmission electron microscopy of “yarn/knitting needle” RBCs when deoxygenated in vitro. “Yarn/knitting” RBCs are irreversibly sickled cells, that is their shape does not change according to the presence or absence of intracellular polymer. These cells were likely formed by the presence of a single domain of polymer transecting the cell and growing to the extent that the membrane loses its elasticity and the deformation becomes permanent. By deoxygenating peripheral blood from a patient with a high expression of S-Oman we observed the type of domain formation that occurs in these cells. Notice that a single large domain is forming in the center (B and C), but much smaller domains are also formed, in the distal extension of the membrane as well as immediately under the membrane, as magnified in (D). (A) This RBC has a “banana” shape, capable of accommodating two long polymer domains separated by an angle approaching 180°: indeed, two major domains are being formed upon in vitro deoxygenation in these cells, following the requirement of the already established irreversibly deformed shape.
Transmission electron microscopy of “yarn/knitting needle” RBCs when deoxygenated in vitro. “Yarn/knitting” RBCs are irreversibly sickled cells, that is their shape does not change according to the presence or absence of intracellular polymer. These cells were likely formed by the presence of a single domain of polymer transecting the cell and growing to the extent that the membrane loses its elasticity and the deformation becomes permanent. By deoxygenating peripheral blood from a patient with a high expression of S-Oman we observed the type of domain formation that occurs in these cells. Notice that a single large domain is forming in the center (B and C), but much smaller domains are also formed, in the distal extension of the membrane as well as immediately under the membrane, as magnified in (D). (A) This RBC has a “banana” shape, capable of accommodating two long polymer domains separated by an angle approaching 180°: indeed, two major domains are being formed upon in vitro deoxygenation in these cells, following the requirement of the already established irreversibly deformed shape.
CSAT results.
Table 2 reports on the CSAT of hemolysates of SSR, a low HbS-Oman expressor, and ISH, a high S-Oman expressor, which are significantly different. The patient SSR, who is asymptomatic and has 14% S-Oman, has a CSAT significantly higher than sickle trait (an increase of ≈4 g/dL) that is similar to 50% mixtures of HbF and HbS, a fact that explains the lack of a pathological phenotype. The results on ISH are particularly interesting: the CSAT is very close to that of sickle trait. In other words, the phenotype is more severe than the CSAT predicts. Hence, we have to search for the nonpolymerization-dependent effect of HbS-Oman to explain the phenotype.
Hemolysate CSAT on Two Carriers of HbS-Oman: Comparison With Sickle Trait and Purified HbS
| Genotype . | Hb Composition . | CSAT (g/dL) . | Ratio . |
|---|---|---|---|
| A/S | A = 59.1% | 26.5 | 1.70 |
| S = 39.0% | |||
| F = 0.1% | |||
| A/S-Oman (SSR) | S-Oman = 14.0% | 30.4 | 1.95 |
| A = 82% | |||
| F = 0.5% | |||
| A/S-Oman (ISH) | S-Oman = 22.8% | 26.5 | 1.70 |
| A = 74% | |||
| F = 2.8% | |||
| S/S | Purified (100%) | 15.6 | 1.00 |
CSAT of SSR (low S-Oman), ISH (high S-Oman), and, for comparison purposes, sickle trait and mixtures of HbF and HbS.
Membrane retention of Hb by the RBC membrane after distilled water RBC lysis.
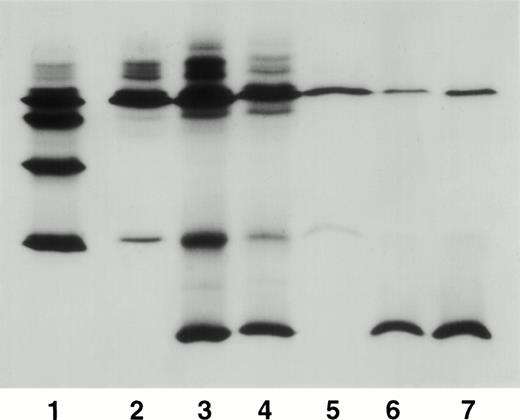
Hb retention was studied by comparing the Hb composition of supernatants 1 and 2 (Fig 7). Supernatant 1, generated by distilled water lysis, had percents of HbA and HbS-Oman, similar in proportion to the regular hemolysate. Supernatant 2, obtained by extracting the Hb left in the RBC ghosts after distilled water lysis, was enriched in HbS-Oman. For the patient with 15% S-Oman in the regular hemolysate, quantification of the bands in supernantant 2 (representing the Hb attached to the membrane after distilled water lysis) (Fig 5) gave a percent of HbS-Oman of 73.2% and HbA of 17.3% compared with 14.1% S-Oman and 57% HbA in supernatant 1. The other sample, from a carrier with 20% HbS-Oman in the regular hemolysate, had a very similar distribution, with S-Oman 69.4% and HbA 20.7% compared, numbers that are quite different from the distribution in supernatant 1 (20.8% S-Oman and 58.4% HbA). These numbers do not add up to 100% because IEF separates also Hbs A1c, S-OmanIc, F, and A2, not relevant to this analysis.
Isoelectrofocusing separation of the Hb tetramers present in supernatant 1 and supernatant 2 (see Materials and Methods). Lane 1, markers for HbS A, F, S, and C(A2) (from the top down). Lane 2, supernatant 1 of a normal hemolysate (HbA, traces of HbF and low levels of HbA2; the bands in front of HbA are postranslational modifications of HbA). Lane 3, supernatant 1 of patient SSR (HbA, low amounts of HbF and HbA2 and the slowest fraction, HbS-Oman). Lane 4, supernatant 1 of patient ISH (high S-Oman, similar distribution to that in 3 but less loaded). Lane 5, supernatant 2 of a normal hemolysate (HbA and very little A2). Lane 6, supernatant 2 of patient SSR, dramatic reduction of HbA and large increase in HbS-Oman. Lane 7, supernatant of patient ISH, very similar results that in lane 6. For quantification, see the text.
Isoelectrofocusing separation of the Hb tetramers present in supernatant 1 and supernatant 2 (see Materials and Methods). Lane 1, markers for HbS A, F, S, and C(A2) (from the top down). Lane 2, supernatant 1 of a normal hemolysate (HbA, traces of HbF and low levels of HbA2; the bands in front of HbA are postranslational modifications of HbA). Lane 3, supernatant 1 of patient SSR (HbA, low amounts of HbF and HbA2 and the slowest fraction, HbS-Oman). Lane 4, supernatant 1 of patient ISH (high S-Oman, similar distribution to that in 3 but less loaded). Lane 5, supernatant 2 of a normal hemolysate (HbA and very little A2). Lane 6, supernatant 2 of patient SSR, dramatic reduction of HbA and large increase in HbS-Oman. Lane 7, supernatant of patient ISH, very similar results that in lane 6. For quantification, see the text.
Binding of HbS-Oman to RBC “leaky” ghosts.
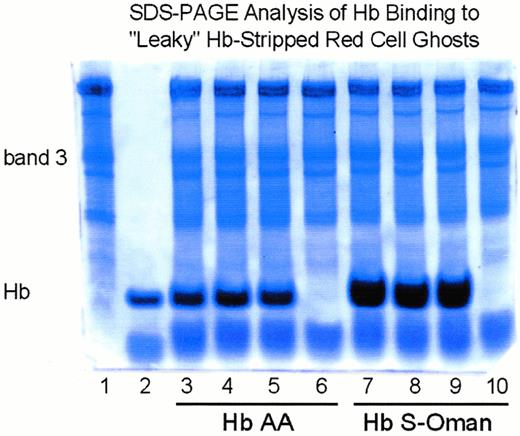
In two separate experiments we compared the binding of HbS-Oman and HbA to RBC ghosts. The results of one of these experiments are depicted in Table 3. The second experiment gave the same results: there is a threefold increase in binding of HbS-Oman to “leaky” ghost compared with HbA. In addition, gel electrophoresis confirmed the significantly increased binding of HbS-Oman to these ghosts (Fig 8 [see this page]).
Hb Binding to “Leaky” RBC Ghosts
| Hb Added . | Expt. No. (n = 3) . | Expt. No. 2 (n = 3) . |
|---|---|---|
| AA | 5.18 ± 1.19 | 4.04 ± 0.35 |
| S-Oman | 15.46 ± 0.1 | 16.96 ± 1.25 |
| P = .0066 | P = .0063 |
| Hb Added . | Expt. No. (n = 3) . | Expt. No. 2 (n = 3) . |
|---|---|---|
| AA | 5.18 ± 1.19 | 4.04 ± 0.35 |
| S-Oman | 15.46 ± 0.1 | 16.96 ± 1.25 |
| P = .0066 | P = .0063 |
Results expressed as mol Hb dimer bound/mol band 3 monomer. Pairedt-test used to determine significance of HbAA vHbS-Oman.
Increased binding of HbS-Oman to normal (HbAA) Hb-stripped “leaky” RBC ghost membranes. SDS-PAGE (7.5% acrylamide), using the Fairbanks discontinuous buffer system, stained with Coomassie brilliant blue of purified HbAA or HbS-Oman incubated with normal (HbAA) Hb-stripped “leaky” RBC ghost membranes. Lane 1, normal (HbAA) Hb-stripped “leaky” ghosts; lane 2, 0.005 mg purified HbS-Oman; lanes 3 through 5, “leaky” ghosts incubated with HbAA; lanes 6 and 10, “leaky” ghosts without added Hb; lanes 7 through 9, “leaky” ghosts incubated with HbS-Oman. The position of band 3 and Hb is indicated. There was considerably more binding of HbS-Oman to “leaky” ghosts compared with the binding of HbAA.
Increased binding of HbS-Oman to normal (HbAA) Hb-stripped “leaky” RBC ghost membranes. SDS-PAGE (7.5% acrylamide), using the Fairbanks discontinuous buffer system, stained with Coomassie brilliant blue of purified HbAA or HbS-Oman incubated with normal (HbAA) Hb-stripped “leaky” RBC ghost membranes. Lane 1, normal (HbAA) Hb-stripped “leaky” ghosts; lane 2, 0.005 mg purified HbS-Oman; lanes 3 through 5, “leaky” ghosts incubated with HbAA; lanes 6 and 10, “leaky” ghosts without added Hb; lanes 7 through 9, “leaky” ghosts incubated with HbS-Oman. The position of band 3 and Hb is indicated. There was considerably more binding of HbS-Oman to “leaky” ghosts compared with the binding of HbAA.
Ca2+-activated K+ efflux.
Human RBCs possess a Ca2+-activated, charybdotoxin (CTX) sensitive K+ efflux8-10 that is also sensitive to CLT.8 Experiments on RBCs from an SS patient showed that the presence of 20 μmol/L cytosolic Ca2+ and A23187 induced a maximal stimulation of the K+ efflux (4.27 ± 0.57 mmol/L cell × min). This efflux was reduced to 0.16 ± 0.19 mmol/L cell × min when the RBCs were incubated with 10 μmol/L CLT in the presence of 20 μmol/L cytosolic Ca2+and A23187. When cytosolic Ca2+ was buffered at <0.1 nmol/L with EGTA, in the presence of A23187, the K+ efflux was significantly reduced to 0.07 ± 0.14 mmol/L cell × min. The difference between K+ efflux in the presence and absence of CLT yields the Δ-CLT sensitive fraction, which in this experiment was 4.11 mmol/L cell × min. Therefore, the percent inhibition of the total maximal activity of the Ca2+-activated K+ efflux was approximately 99% for this experiment.
The kinetic parameters of the CLT-sensitive Ca2+-activated K+ efflux measurements in RBCs from SS and heterozygous S-Oman patients is of interest. In both cell types, the Ca2+-activated K+ efflux was already maximally stimulated by approximately 10 μmol/L cytosolic calcium. In the presence of CLT, Ca2+-activated K+ efflux values were not significantly different in both cell types. Therefore, the ΔCTX-sensitive K+ efflux was not significantly different in these cells. However, the Km for stimulation of the Ca2+-activated K+ efflux was significantly lower in S-Oman than in SS RBCs. The RBCs from HSR (S-Oman 22%) had a Km of 0.487 μm and a Vmaxof 6.22 FU while the RBCs of MSK (S-Oman 13%) had a Km of 1.81 μm and Vmax of 6.05 FU. This is in clear contrast to the values of Km 7.53 μm and 5.5 FU obtained for SS blood.
Volume- and NEM-stimulated K:Cl cotransport K+.
Three patients were studied: two with less than 14% S-Oman (RHK, SSR) and one with 20% HbS-Oman (MSR). The volume-stimulated K:Cl cotransports were 5.6 and 1.2 mmol/L cell × h, respectively, and the NEM-stimulated K:Cl cotransports were 25.6 and 24.0 mmol/L cell × h in the low S-Oman RBCs. The high S-Oman RBCs exhibited a volume stimulated K:Cl efflux of 14.7 mmol/L cell × h and an NEM-stimulated K:Cl cotransport of 56.7 mmol/L cell × h. For comparison, the average values for the Cl-dependent part of volume stimulated K:Cl cotransport for AA, SS, and CC cells are 2.5 ± 0.5, 15.8 ±1.5, 17.3 ± 1.5 mmol/L cells × h, respectively. The average value for NEM stimulation for SS RBCs has greater variability (32.7 ± 10.6 mmol/L cells × h).
DISCUSSION
The pedigree presented here corresponds to a new sickle syndrome characterized by the presence of anemia, high reticulocyte count, the presence of “yarn/knitting-needle” shaped RBCs, splenomegaly, painful crises, and, in one case, central nervous system (CNS) symptoms and acute chest syndrome. Because all the symptomatic individuals studied were concomitantly heterozygous for the African-type α-thalassemia (−α/αα), due to the extremely high incidence of α-thalassemia in Oman,11 we suspect that we are describing a milder form of this syndrome than would be the case in the absence of α-thalassemia. The clinical syndrome is only observed in individuals with hemolysates having more than 20% HbS-Oman. Individuals with a lower percent of the doubly mutated HbS (around 14%) and concomitant homozygosity for the African-type α-thalassemia (−α/−α) are asymptomatic clinically and hematologically have only slight to moderate RBC changes.
The failure of the original investigators who first described HbS-Oman1 to recognize the clinical syndrome stems from the fact that they had access to a single carrier who happened to have a concomitant −α/−α haplotype and, hence, a low expression (14%) of S-Oman.
Several factors contribute to the pathogenic effect of this double mutation. It is clear that the second mutation (β121 Glu → Lys) has an enhancing effect on polymerization, as shown by the CSAT of the hemolysate (not S-Oman purified) of a symptomatic patient, which is the same as that of a sickle trait (AS) despite the relatively low expression of 22% for S-Oman compared with 40% HbS in sickle trait. S-Oman shows that the effect of β121 Glu → Lys is also apparent in cis (that is, cis to the active β6Val site).
Nevertheless, the pro-polymerizing effects of β121 (Glu → Val) cannot entirely explain the phenotype. Pure S-Oman has a CSAT of 11 g/dL, which is almost identical to the 11.8 g/dL CSAT of S-Antilles, another super-hemoglobin S that is the product of a double mutation in the β-chain. The moderate sickle cell anemia phenotype of S-Antilles trait is the consequence of the enhancing effect of the β23 Val → Ile mutation on polymerization and a yet undefined effect of the right shift of the oxygen equilibrium curve observed both in HbS-Antilles as well as the recombinant hemoglobin α2β223Val → Ile.2 12 Considering the differences in expression between the two, of almost 40% to 50% for S-Antilles compared with the 20% to 22% of S-Oman, the phenotype of the latter should be quite mild or nonexistent. In fact, the phenotypes are very similar. Finally, the hemolysate CSAT’s lend further support to this analysis. These features suggest that there is an additional pathogenic effect due to the presence of the β121 (Glu → Lys) mutation.
We propose here that the β121 mutation, by increasing the charge difference by three, produces an abnormal interaction of the HbS-Oman tetramers containing the doubly mutated β-chain with the RBC membrane. A strong independent confirmation of this phenomena is the presence of moderate hemolytic anemia in the homozygotes of HbOARAB.12,13 Abnormal interaction with the membrane has been described for HbC (a two-charge difference)4,4,15 and for HbA2 (a two-charge difference).4 14 Evidence for an abnormal interaction of S-Oman with the membrane can be summarized as follows:
- (1)
The presence of dense reticulocytes, of the type seen only in individuals with SC and CC genotypes,16 which is the result of abnormal volume regulation of the reticulocytes leaving the marrow.
- (2)
The significant decrease in the Km of the Ca2+-activated K+ efflux, which suggests that this important channel requires less Ca2+ than it does in SS RBCs to extrude K+. The K:Cl cotransport activity seems to follow the extent of S-Oman expression; hence it seems to be sickling dependent, but a contribution of the nonsickling hemolysis induced by the second mutation might be operating through the increase in reticulocytes. Nevertheless, the effect of α-thalassemia needs to be further investigated.
- (3)
The increased association of HbS-Oman, over HbA and HbS, with the RBC membrane, and the over-representation of HbS-Oman in membrane extracts. In addition, binding of HbS-Oman to normal “leaky” Hb-stripped ghosts is increased threefold to fourfold compared with HbA.
- (4)
Presence of dense cells by isopycnic gradients.
- (5)
The presence of abundant nidus of sickle polymerization.
The presence of “yarn/knitting needle” cells, which is characteristic of the syndrome described here and most likely the consequence of the polymerization of S-Oman in a single domain, is limited to patients expressing HbS-Oman at the 20% to 22% level. Electron microscopy of in vitro deoxygenated S-Oman RBCs shows that cells already deformed to the “yarn/knitting needle” shape, due to previous events of polymerization that surpassed the yield coefficient of the membrane, exhibit one or two domains of polymerization. This represents a low number of nucleation events, which is not surprising considering the relatively low concentration of HbS-Oman.
We conclude that the pathophysiology of the sickle syndrome S-Oman heterozygote is the result of the following gene-product effects: (1) The sickle mutation (β6 Val) induces sickling; (2) The β121 Lys mutation enhances sickling; and (3) the β121 Lys mutation induces hemolysis and RBC shape changes.
We know that Hbs with increased positive charge (HbC, HbOARAB) are by themselves15-17 capable of reducing the volume of the RBC (with corresponding increase in MCHC), reducing the RBC life span, and producing morphological changes (folded cells). In the homozygous form, both of these Hbs produce hemolytic anemias.16,17 S-Oman heterozygotes have folded cells and reduced RBC life span, very much like CC and SC cells, although they do not have the uniformly increased density18 of these genotypes.
Finally, there is the matter at the low percentages of S-Oman found in the heterozygotes describe here. The difference in percentage of S-Oman are associated with the degree of α-thalassemia and the numbers are still low in absolute terms, suggesting that other factors are involved. Message instability or transcription abnormalities might be present and need to be excluded. Nevertheless, another interesting possibility is that the assembly of HbS-Oman is decreased by the very high positive charge of the βS-Oman, as Bunn19 has suggested for other positively charged Hbs (C,E,OARAB).
We postulate that the pathogenic mechanisms mediated by S-Oman, in addition to the facilitation of Hb polymerization, include a direct or indirect charge-dependent interaction between S-Oman and the RBC membrane, resulting in changes of the intracellular Hb concentration or increased cell density, by altering transport mechanisms and increasing RBC destruction.
ACKNOWLEDGMENT
We acknowledge the help of Nazim Fataliev’s competent purification of hemoglobin S-Oman, and to all those in the Sultan Qaboos Royal Hospital who helped in securing many valuable samples.
Supported by National Institutes of Health Grants No. HL38655 and HL55435, and by grants from the European Union (TS3-CT93-0244 DG12HSMU) to R.K.
The publication costs of this article were defrayed in part by page charge payment. This article must therefore be hereby marked “advertisement” in accordance with 18 U.S.C. section 1734 solely to indicate this fact.
REFERENCES
Author notes
Address reprint requests to Ronald L. Nagel, MD, Irving D. Karpas Professor of Medicine, Albert Einstein of Medicine, 1300 Morris Park Ave, U921, Bronx, NY 10461; e-mail: nagel@aecom.yu.edu.

This feature is available to Subscribers Only
Sign In or Create an Account Close Modal