Abstract
Selection of human cells for resistance to vincristine or doxorubicin often induces overexpression of the multidrug resistance 1 gene (MDR1), which encodes the cell surface P-glycoprotein, as a result of gene amplification or transcriptional activation. Moreover, overexpression of the MDR1 gene has been shown to be associated closely with clinical outcome in various hematological malignancies, including acute myeloid leukemia (AML). However, the precise mechanism underlying overexpression of the MDR1 gene during acquisition of drug resistance remains unclear. We recently described an inverse correlation between the methylation status of CpG sites at the promoter region and expression of the MDR1 gene in malignant cell lines. In this study, we expanded this analysis to 42 clinical AML samples. We adapted a quantitative reverse transcription-polymerase chain reaction (RT-PCR) assay for gene expression and a quantitative PCR after digestion by Hpa II for methylation status of the MDR1gene. We observed a statistically significant inverse correlation between methylation and MDR1 expression in clinical samples. The hypomethylation status of the MDR1 promoter region might be a necessary condition for MDR1 gene overexpression and establishment of P-glycoprotein–mediated multidrug resistance in AML patients.
CULTURED MAMMALIAN cells selected for resistance to vinka alkaloids or to anthracyclines often exhibit a multidrug resistance (MDR) phenotype. The acquisition of this phenotype is usually associated with increased expression of the multidrug resistance gene (MDR1) which encodes for a cell-surface P-glycoprotein (P-gp), which functions as a drug efflux pump, and thereby reduces the intracellular concentration of drugs.1-4 Thus, transfection of cells with cDNA corresponding to the MDR1 gene confers the multidrug resistance phenotype.5
P-gp is expressed in various malignancies and is believed to be one of the major obstacles to chemotherapy for hematopoietic malignancies, including acute myeloid leukemia (AML).6-8 Over the past decade, developments in intensive induction chemotherapy have resulted in complete remission (CR) rates of 60% to 80% in AML patients.9-11 However, some 20% of these patients are refractory to primary treatment and an even higher percentage will be refractory at relapse.12,13 In some relapsed or refractory cases, MDR1 mRNA or P-gp was overexpressed.14-17Most studies have consistently indicated that expression ofMDR1/P-gp is a marker of clinical outcome in AML.14-17 However, the underlying mechanism as to how expression of MDR1/P-gp is upregulated in AML remains unclear.
From a mechanistic point of view, two aspects have been shown to be involved in the acquisition of MDR. First, experiments indicate thattrans-activation of the MDR1 gene is associated with exogenous stimulation, including anticancer agents, carcinogens, and retinoic acid.18-21 This activation appears to be mediated through nuclear trans-acting factors.22-26 A second factor in MDR is the frequent amplification of the MDR1gene.27-29 However, neither amplification nor an increase in a trans-acting factor has been shown in clinical samples, suggesting the involvement of additional factors in overexpression of the MDR1 gene.
Some genes show an inverse correlation between DNA methylation and transcription in both normal and malignant cells,30,31suggesting that DNA methylation is one plausible regulator of gene expression, and mammalian DNA is heavily methylated at cytosine residues within CpG dinucleotides, with 60% to 80% of such residues being methylated. Inhibition of transcription by DNA methylation has been shown by transfection of genes methylated in vitro.32-34 The expression of many tissue-specific genes is correlated inversely with the methylation status of the promoter region.35,36 The pattern of DNA methylation often differs between normal and cancer cells. For example, the proto-oncogenes c-Fos, c-Myc, and c-H-Ras are hypomethylated in liver tumors and leukemias,37,38 but the tumor suppresser Rb gene is hypermethylated in retinoblastomas.39
We have established a mouse cell line into which a YAC clone containing the entire human MDR locus was introduced, and observed that the transfected human MDR1 gene is overexpressed a priori when selected by drug resistance to vincristine.40 Selective overexpression of the MDR1 gene was related closely to the methylation status of the MDR1 gene promoter region.41 Moreover, in a multidrug resistant cell line from head and neck cancer KB3-1 cells, we observed that transcriptional activation of the MDR1 gene was due to hypomethylation status at the 5′-flanking region (−100 to −50) (Kusaba, Nakayama, Harada, Nagayama, Nomoto, Kohno, Kuwano, and Wada, unpublished data, January 1997). In the present study, we asked if hypomethylation status at the promoter region may be associated with MDR1 gene expression in AML, and observed that the methylation status at the MDR1 gene promoter was associated with switch-on or -off of MDR1 gene expression.
MATERIALS and METHODS
Patients and samples.
Forty-two samples from 31 patients older than 15 years with AML and 10 healthy individuals were investigated in this study. For AML, the mean age was 50 ± 17 years (range, 19 to 78); 7 were older than 65 years. There were 16 men and 15 women. Eight patients (26%) had relapsed, and 6 patients (19%) were refractory to first-induction therapy. All human samples were obtained under an Institutional Review Board (IRB)-approved protocol with subjects providing informed consent. Bone marrow (BM) aspirates and peripheral blood (PB) cells were obtained for evaluation of AML phenotype and other studies. Histologic classification was performed on May-Grünwald-Giemsa–stained BM smears according to the French-American-British (FAB) criteria.42 According to the FAB classification, 5 patients were AML M1, 15 patients were AML M2, 5 patients were AML M3, 2 patients were AML M4, 3 patients were AML M5, and 1 patient was AML M6. CD34 status was defined as positive when more than 30% of blast cells were expressing CD34 antigen. All first-induction therapy except for M3 were BHAC-DMP (enocitabine, daunorubicin, 6-mercaptopurine, and prednisolone). AML M3 patients were treated with ATRA (all-trans retinoic acid). Relapsed patients were treated with Ara-C (cytosine arabinoside) and MIT (mitoxantrone). CR was defined as less than 5% blast cells in the BM. Cell samples from BM and PB were collected in heparinized tubes. Mononuclear cells (MNC) were isolated from the samples by Ficoll-Hypaque (Pharmacia, Uppsala, Sweden) density gradient centrifugation.
Isolation of DNA and RNA.
High-molecular-weight DNA was isolated from patients’ and healthy individuals’ samples as previously described.43 RNA was isolated by using RNA extraction reagent, ISOGEN-LS (Nippon Gene Co, Tokyo, Japan) according to the manufacturer’s protocol.
Quantitative reverse transcription-polymerase chain reaction (RT-PCR) analysis.
Single-stranded cDNA was prepared from 1 μg of total RNA and 2.5 μmol/L random primer (Takara Shuzo, Kyoto, Japan), in a total volume of 20 μL containing Moloney murine leukemia virus reverse transcriptase (GIBCO-BRL, Gaithersburg, MD) and RNase inhibitor (Takara Shuzo). PCR was performed in a final volume of 5 μL containing an amount of cDNA equivalent to 50 ng of total RNA, 1 μmol/L each of sense and antisense primers, and 1 U of Taq DNA polymerase (Amersham, Buckinghamshire, UK). The PCR primers were 5′-CACGTGGTTGGAAGCTAACC-3′ and 5′-GAAGGCCAGAGCATAAGATGC-3′ for the human MDR1 gene and 5′-GTGGAGCATTCAGACTTGTCTTTCAGC-3′ and 5′-TTCACTCAATCCAAATGCGGCATCTTC-3′ for human β2-microglobulin. For quantification of humanMDR1 and human β2-microglobulin mRNA by RT-PCR,44 45 the corresponding cDNA was diluted serially in water from 50 to 6 ng/μL for the human MDR1 gene, from 25 to 0.2 ng/μL for the human β2-microglobulin mRNA, and mixed in a final volume of 5 μL with 1 μmol/L primer pairs, 1 U of Taq DNA polymerase, and 1 μCi of [32P]dCTP. Amplification was performed in a DNA thermal cycler (Perkin Elmer, Tokyo, Japan) according to the following protocol: initial denaturation for 5 minutes at 95°C; 35 cycles of denaturation for 30 seconds at 95°C, primer annealing for 30 seconds at 60°C, and polymerization for 45 seconds at 72°C; and final extension for 10 minutes at 72°C for human MDR1, and initial denaturation for 5 minutes at 95°C; 25 cycles of denaturation for 30 seconds at 95°C, primer annealing for 30 seconds at 55°C, and polymerization for 30 seconds at 72°C; and final extension for 10 minutes at 72°C for human β2-microglobulin. The PCR products were separated by electrophoresis on 5% acrylamide gels, which were then stained with ethidium bromide, photographed, dried, and subjected to autoradiography and image analysis (BAS 2000; Fuji Film, Tokyo, Japan).
RNase protection assay.
RNase protection assay performed in this study was a modification of previously described methods.46,47 In brief, the probe used for RNase protection assay was a 1-kb Pst I-Pst I genomic fragment containing the MDR1 promoter region (Fig 1) subcloned into pBlue vector and linearized with PvuII. Transcripts originating from this promoter, referred to as the “downstream promoter,” protect 130-bp and 134-bp fragments of the RNA probe. A 324-nucleotide sequence of the same probe was protected by MDR1 transcripts that originate at an “upstream promoter.”47 β-Actin expression was measured by using a 412-bp cDNA fragment from 3′ untranslated region of a human β-actin cDNA subcloned into pGEM-3. Five micrograms of RNA was hybridized with 2 × 10⁵cpm of antisense RNA probe, and heat denaturation of the probe and sample at 85°C for 3 minutes was followed by overnight incubation at 42°C. The samples were separated on a 5% polyacrylamide gel at 200 V for 1 hour followed by autoradiography for 2 days. We evaluatedMDR1 mRNA levels standardized by β-actin expression (data not shown).
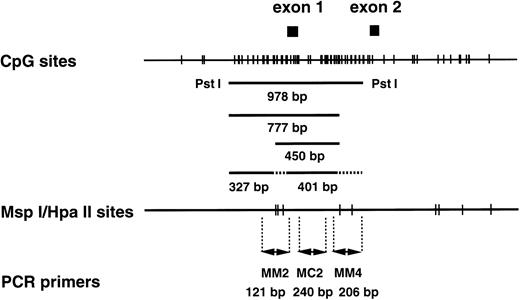
CpG sites and Msp I/Hpa II sites in the human MDR1 promoter region. (Top) The CpG sites are represented by short vertical bars. The positions of exons 1 and 2 are indicated as closed boxes. The 978-bp fragment, the 450-bp and 777-bp fragments, and the 327-bp and 401-bp fragments are generated from the templates with completely methylated, partially methylated, and without methylatedMsp I/Hpa II sites by Pst I/Hpa II digestion. The position corresponding to these fragments are indicated. (Middle) The Msp I/Hpa II recognition sites are represented by short vertical bars. (Bottom) PCR primers used in the methylation analysis. MM2 and MM4 are methylation-sensitive primer pairs, and MC2 is a positive control primer pair.
CpG sites and Msp I/Hpa II sites in the human MDR1 promoter region. (Top) The CpG sites are represented by short vertical bars. The positions of exons 1 and 2 are indicated as closed boxes. The 978-bp fragment, the 450-bp and 777-bp fragments, and the 327-bp and 401-bp fragments are generated from the templates with completely methylated, partially methylated, and without methylatedMsp I/Hpa II sites by Pst I/Hpa II digestion. The position corresponding to these fragments are indicated. (Middle) The Msp I/Hpa II recognition sites are represented by short vertical bars. (Bottom) PCR primers used in the methylation analysis. MM2 and MM4 are methylation-sensitive primer pairs, and MC2 is a positive control primer pair.
Immunohistochemistry.
Immunohistochemistry performed in this study was a modification of previously described methods.48 In brief, BM was fixed with 10% formalin and embedded in paraffin. Histological sections were stained with hematoxylin and eosin (H & E). P-gp was detected using polyclonal antibody Ab-1 (Calbiochem, Cambridge, MA) and monoclonal antibody MRK-16 (Kyowa Medics, Tokyo, Japan). The slides were deparaffinized, rinsed twice with phosphate-buffered saline (PBS), transferred to jars filled with citrate buffer (pH 6.0), and heated in a microwave oven (H2500 Microwave Processor; Energy Beam Science, Inc, Agawam, MA) for 10 minutes at a power of 700 W. After cooling at room temperature for 15 minutes, the slides were covered with normal pig or horse serum for 20 minutes, incubated with the Ab-1 or MRK-16 at a dilution of 1:10 at room temperature for 1 hour, and then stained with a biotin-conjugated pig anti-rabbit or horse anti-mouse antibody for 30 minutes followed by alkaline phosphate–conjugated streptavidin for 30 minutes.
In every specimens examined (at least 500 cells were examined), the percentage of P-gp+ cells was determined by two observers. We defined P-gp (−) for less than 1%, (+/−) for 1% to 5%, (+) for 5% to 10%, (++) for 10% to 20%, and (+++) for over 20%, respectively.
Quantitative PCR-based methylation analysis.
Three micrograms each of control and leukemia DNA was digested with 300 U of Msp I (Fermentas MBI, Vilnius, Lithuania) or HpaII (Takara Shuzo) at 37°C for 16 hours, added to 1/15 vol of 0.6 mol/L Tris (pH 7.5) and 1.5 mol/L NaCl, and then digested with 30 U of Pst I (Nippon Gene) at 37°C for 8 hours.
To analyze the methylation status of the MDR1 5′CpG promoter region, restriction-digested DNA was analyzed by PCR in 5-μL reactions containing 1 μmol/L each of sense and antisense primers, and 1 U of Taq DNA polymerase. The PCR primers (Fig 1) were 5′-TCTAGAGAGGTGCAACGGAAG-3′ and 5′-TCAGCCTCACCACAGATGAC-3′ for MM2 methylation-sensitive primers (121 bp), 5′-TGAAGTCCTCTGGCAAGTCC-3′ and 5′-ATTCTCCCTCCCGGTTCC-3′ for MM4 methylation-sensitive primers (206 bp), 5′-ATTTCACGTCTTGGTGGCC-3′ and 5′-TCCAGTGCCACTACGGTTTG-3′ for MC2 control primers (240 bp), and 5′-GGCGAAGGAGGTTGTCTATTC-3′ and 5′-AACGTTCTAGGAGAGTCGGG-3′ for TPI5 control primers (240 bp). For quantification of methylation status by PCR, the corresponding genomic DNA was diluted serially in water from 50 to 6 ng/μL and mixed in a final volume of 5 μL with 1 μmol/L primer pairs, 1 U of Taq DNA polymerase. Amplification was performed in a DNA thermal cycler according to the following protocol: initial denaturation for 10 minutes at 95°C; 25 cycles for MC2 and MM2 primers, 27 cycles for MM4 and TPI5 primers of denaturation for 30 seconds at 95°C, primer annealing for 30 seconds at 60°C, and polymerization for 30 seconds at 72°C; and final extension for 10 minutes at 72°C. The PCR products were separated by electrophoresis on 2% agarose gels, which were then stained with ethidium bromide, photographed, and subjected to scanner and image analysis (NIH image).
Southern blot analysis.
The methylation status of Msp I/HpaII sites was investigated by separating genomic DNA that had been digested withHpaII and Pst I on a 2.0% NuSieve 3:1 gel and transferring the DNA fragments to a nylon filter (Hybond N+; Amersham). A 978-bp PstI-Pst I (Fig 1) fragment of the promoter region of MDR1was used as probe.41 This probe contained fiveMsp I/HpaII sites as shown in Fig 1.
Statistical analysis.
Chi-squared tests and Mann-Whitney tests were used compare two or more groups (see Figs 4 and 9, and Table 1). Piecewise linear regression analysis was performed to examine the relationship between expression and methylation status of MDR1gene (see Fig 8).49 50 Computations were performed using SAS statistical software (SAS Institute, Inc, Cary, NC) on a SPARK Station 20 (Sun Microsystems, Mountain View, CA).
Reports and Our Data of MDR1/P-gp Expression and Clinical Course of AML Patients
| Investigators . | Year and References . | Methods . | Samples . | CR Rate (%) . | |
|---|---|---|---|---|---|
| MDR1/P-gp Positive . | MDR1/P-gp Negative . | ||||
| Kuwazuru et al | 1990 (14) | Western blot | 19 | 1/10 (10%) | 7/9 (77%) |
| Marie et al | 1991 (15) | Northern blot | 29 | 7/21 (30%) | 5/8 (63%) |
| Campos et al | 1992 (16) | FACS | 150 | 23/71 (32%) | 64/79 (81%) |
| Nüssler et al | 1996 (17) | FACS | 166 | 26/88 (29%) | 93/141 (66%) |
| Nakayama et al | This study | Quantitative RT-PCR | 34 | 7/21 (33%) | 8/13 (62%) |
RESULTS
Evaluation of MDR1 gene expression in AML patients by quantitative RT-PCR.
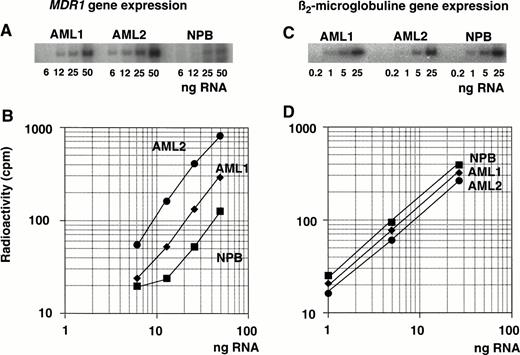
Expression of the MDR1 gene was determined by measuring the PCR products after amplification of serial diluted cDNA (Fig 2A). Serially diluted β2-microglobulin cDNA was amplified in parallel (Fig 2C) and both PCR products were quantitated using autoradiography. One microgram of total RNA was subjected to RT with random primers to generate each cDNA. The cDNAs were then diluted serially for the PCR reaction to ensure that amplification occurred within the exponential phase of the reaction, but not at plateau phase. Plateau phase appeared to be caused by an excess of PCR products and by a shortage of primers. Different dilutions of cDNA were tested within the exponential range depending on the level of MDR1 mRNA (Fig 2A). The diluted series of cDNA from AML1, AML2, and one healthy individual (NPB; normal peripheral blood) were used as templates for the PCR reaction withMDR1 primer pairs.
Determination of MDR1 gene expression in AML patients by quantitative RT-PCR analysis. RNA isolated from AML patients (AML1 and AML2) and a healthy individual (NPB) was reverse transcribed. Each cDNA was diluted, amplified by PCR with MDR1primer pairs (A) or β2-microglobulin primer pairs (C), and subjected to autoradiography after 5% polyacrylamide gel electrophoresis and image analysis; values are plotted in graph (B and D, respectively).
Determination of MDR1 gene expression in AML patients by quantitative RT-PCR analysis. RNA isolated from AML patients (AML1 and AML2) and a healthy individual (NPB) was reverse transcribed. Each cDNA was diluted, amplified by PCR with MDR1primer pairs (A) or β2-microglobulin primer pairs (C), and subjected to autoradiography after 5% polyacrylamide gel electrophoresis and image analysis; values are plotted in graph (B and D, respectively).
Figure 2B and D shows the results of the radioactive analysis of the PCR products as a function of the dilution rate of input RNA. The relative mRNA levels of the MDR1 gene were obtained from the dilution rate at the exponential range and normalized by dividing by the relative β2-microglobulin mRNA level. The β2-microglobulin mRNA levels were almost same (Fig 2D).MDR1 mRNA levels were, respectively, 2.2-fold and 6.4-fold higher in AML1 and AML2 than in NPB cells (Fig 2B).
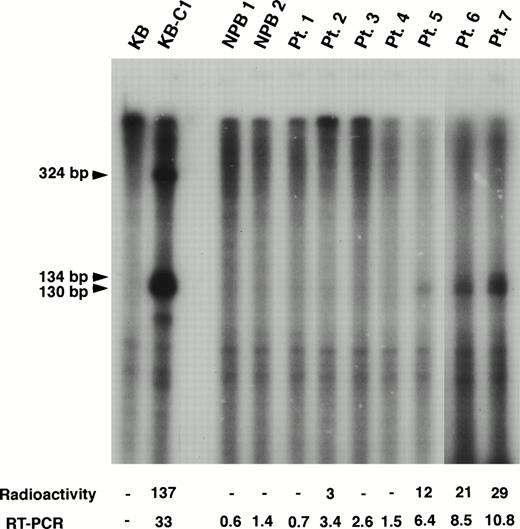
We also performed RNase protection assay to evaluate the mRNA level ofMDR1 and obtained good correlation with the results by RT-PCR for higher expression samples (Fig 3). For example, MDR1 expression levels obtained by RT-PCR analysis were 3.4, 6.4, 8.5, and 10.8 in patients (Pts.) 2, 5, 6, and 7 who show the relative value 3, 12, 21, and 29, respectively, by RNase protection assay (Fig 3). However, RT-PCR analysis was found to be more sensitive than RNase protection assay. We could not detect expression ofMDR1 gene when assayed by RNase protection assay in Pts. 1, 3 and 4 who show expression value 0.7, 2.6, and 1.5 by RT-PCR (Fig 3). The MDR1 transcripts of KB-C1 cells which overexpressedMDR1 and were used as a positive control, were detected as 130/134-bp and 324-bp fragments as reported,51whereas only 130/134-bp fragments were detected in Pts. 2, 5, 6, and 7.
RNase protection assay of normal PB cells and AML patients. In this experiment, the MDR1 antisense probe was used. The KB cells were used as a negative control and the multidrug resistant KB-C1 cells were used as a positive control. The sizes of protected products were indicated by arrows. Radioactivity corresponding to the 130/134-bp bands and mRNA levels obtained by quantitative RT-PCR analysis are presented below the panel.
RNase protection assay of normal PB cells and AML patients. In this experiment, the MDR1 antisense probe was used. The KB cells were used as a negative control and the multidrug resistant KB-C1 cells were used as a positive control. The sizes of protected products were indicated by arrows. Radioactivity corresponding to the 130/134-bp bands and mRNA levels obtained by quantitative RT-PCR analysis are presented below the panel.
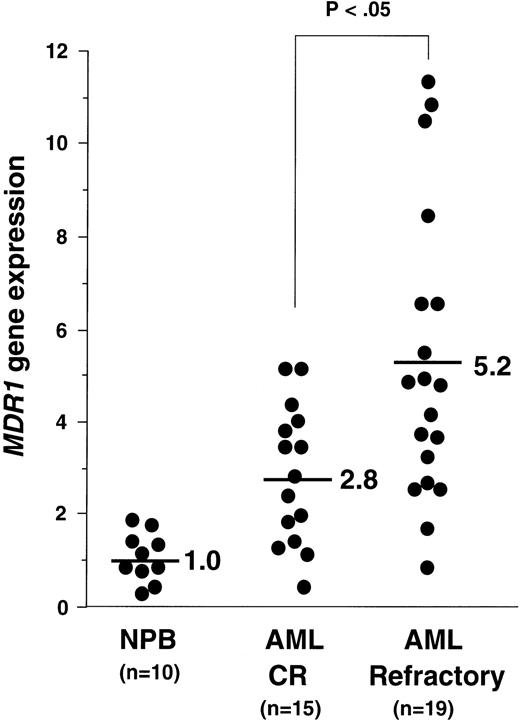
Using the quantitative RT-PCR analysis, we determined the amounts ofMDR1 mRNA in all samples. The average value of MDR1mRNA in PB cells of the 10 healthy individuals (NPB) was defined as 1.0. We presented the data of the MDR1 value of AML patients with CR and refractory, except for AML M3 in Fig 4. The average values of MDR1mRNA in AML patients with CR were 2.8 (n = 15), and in AML with refractory were 5.2 (n = 19) (Fig 4). We then evaluated the “MDR1 positive” samples. When we defined the “MDR1 positive” sample as 2.0, 3.0, and 4.0, the P values using the chi-squared test between theMDR1 values in AML patients with CR and those in AML with refractory were calculated as .1025, .0477, and .0787, respectively. We defined a sample as “MDR1 positive” when the expression value was more than 3.0. The CR ratio was 33% (7 of 21) and 62% (8 of 13) in the group of MDR1 positive and negative, respectively (Table 1). Five patients who were diagnosed as AML M3 and four patients who died during induction therapy were excluded from clinical outcome analysis.
MDR1 gene expression in NPB, AML with CR, and AML with refractory patients. Relative expression of MDR1 gene was determined by quantitative RT-PCR as described in Materials and Methods, dividing each value by the average of 10 NPB samples after normalizing for the amount of β2-microglobulin mRNA. Average values of relative MDR1 expression for CR and refractory AML are indicated.
MDR1 gene expression in NPB, AML with CR, and AML with refractory patients. Relative expression of MDR1 gene was determined by quantitative RT-PCR as described in Materials and Methods, dividing each value by the average of 10 NPB samples after normalizing for the amount of β2-microglobulin mRNA. Average values of relative MDR1 expression for CR and refractory AML are indicated.
Detection of P-gp using immunohistochemistry.
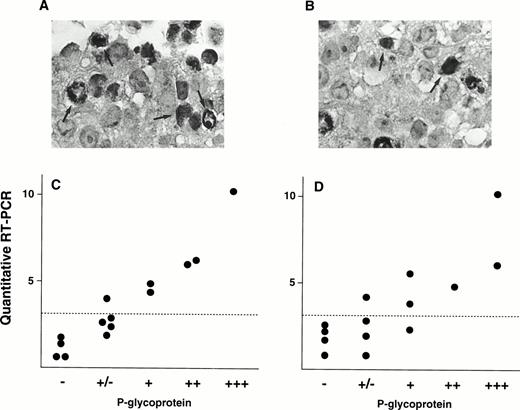
We also evaluated P-gp expression by immunohistochemical analysis. Figure 5A shows immunostaining data of P-gp on a patient (Pt. 7) who shows 10.8 of MDR1 expression value by quantitative RT-PCR, and this patient was scored as (+++) by the immunohistochemical analysis. In contrast, small portions of cells were stained with P-gp antibody and scored as (+) in a patient (Pt. 2) who had an expression value of 3.4 (Fig 5B). These two immunostaining data were using anti–P-gp antibody Ab-1. We further performed immunohistochemistry analysis on many other patients using two P-gp antibodies, Ab-1 and MRK-16. A relationship between the MDR1mRNA levels and P-gp staining for several samples was presented in Fig5C (Ab-1) and D (MRK-16). There is a good correlation between the mRNA levels obtained by RT-PCR assay and P-gp expression levels by immunohistochemistry.
Immunohistochemical staining of P-gp (A and B) and correlation of P-gp levels and MDR1 mRNA levels in AML patients (C and D). Examples of immunostaining using anti-P-gp antibody Ab-1 are shown in (A) and (B). A large portion of cancer cells were stained for P-gp in Pt. 7 (A) and a small portion of cancer cells in Pt. 2 (B) (original magnification × 400). Some of cells positively immunostained for P-gp were indicated by arrows. Immunohistochemical analysis was performed on many other patients with both anti–P-gp antibody Ab-1 (C) and MRK-16 (D). Correlations between P-gp levels by immunohistochemical analysis and MDR1 mRNA levels by RT-PCR are shown in (C) and (D). Dashed line indicates cut-off point ofMDR1 mRNA expression.
Immunohistochemical staining of P-gp (A and B) and correlation of P-gp levels and MDR1 mRNA levels in AML patients (C and D). Examples of immunostaining using anti-P-gp antibody Ab-1 are shown in (A) and (B). A large portion of cancer cells were stained for P-gp in Pt. 7 (A) and a small portion of cancer cells in Pt. 2 (B) (original magnification × 400). Some of cells positively immunostained for P-gp were indicated by arrows. Immunohistochemical analysis was performed on many other patients with both anti–P-gp antibody Ab-1 (C) and MRK-16 (D). Correlations between P-gp levels by immunohistochemical analysis and MDR1 mRNA levels by RT-PCR are shown in (C) and (D). Dashed line indicates cut-off point ofMDR1 mRNA expression.
Methylation status of the MDR1 promoter region.
In our recent study41 (and Kusaba, Nakayama, Harada, Nagayama, Nomoto, Kohno, Kuwano, and Wada, unpublished data, January 1997), we found an inverse correlation betweenMDR1 gene expression and methylation status of CpG sites at theMDR1 gene promoter in the multidrug resistant cell lines KB-C1 and KB/VJ300. A 978-bp fragment was detected in the drug-sensitive parental cell line, KB3-1, after Pst I fragments corresponding to the CpG sites at the MDR1 promoter region were digested further with Hpa II (Fig 1), and smaller fragments such as 327- and 401-bp fragments (Fig 1) were detected in the multidrug resistant counterpart. Therefore, we focused on CpG sites in this 978-bp region for analysis of methylation status in AML patients. To examine further methylation status in clinical samples, we used two primer pairs, MM2 and MM4, which amplify across the Msp I/Hpa II sites, for analysis of the methylation status of the MDR1 gene promoter region (Fig 1). Primer pair MC2 was used as a positive control to assess the quality of source genomic DNA (Fig 1). By contrast, TPI5, which crosses the never-methylated Msp I/Hpa II site at the triosephosphate isomerase gene promoter region, was used as a negative control.52
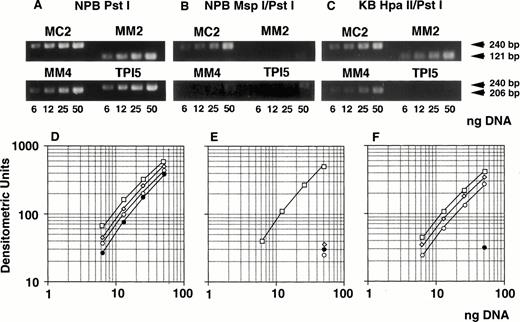
We determined optimal PCR conditions for analysis of methylation status as described below. At first, genomic DNA extracted from NPB was digested with Pst I, serially diluted, amplified by PCR, analyzed with NIH image software, and the graph was plotted. After serial PCR experiments using different cycle numbers, suitable numbers of PCR cycles were determined as 25 for MC2 and MM2, and 27 for MM4 and TPI5 (Fig 6A and D). Under these cycles, the amount of PCR products for each primer pairs were almost the same (Fig 6A and D). Second, NPB genomic DNA was digested with MspI, which is methylation-insensitive enzyme, and Pst I, and analyzed similarly. PCR products amplified by MM2, MM4, and TPI5 primer pairs were less than 12% of the PCR products by MC2 (Fig 6B and E), resulting from incomplete digestion. We then repeated experiment when the PCR product by the TPI5 primer pair was more than 12%. Third, we analyzed genomic DNA from the drug-sensitive KB3-1 cell line, in which the promoter region of the MDR1 gene was already known to be hypermethylated, as determined by Southern blot analysis (Kusaba, Nakayama, Harada, Nagayama, Nomoto, Kohno, Kuwano, and Wada, unpublished data, January 1997). Genomic DNA was digested with Hpa II, which is methylation-sensitive enzyme, and PstI, and then analyzed. PCR products of MM2 and MM4 were about 80% of the PCR products of MC2 (Fig 6C and F) as expected. PCR products amplified by MM2, MM4, and TPI5 primer pairs on Msp I–digested KB3-1 genomic DNA were less than 12% of PCR product amplified by MC2 (data not shown).
Determination of methylation status of the MDR1promoter region by quantitative PCR analysis. Genomic DNA isolated from either NPB (A, B, D, E) or KB 3-1 cell line (C, F) was digested withPst I (A, D), Msp I/Pst I (B, E), orHpa II/Pst I (C, F), respectively, serially diluted, and amplified by PCR. (A, B, and C) The ethidium bromide stain after electrophoresis of PCR products in a 2% agarose gel. The gel was analyzed with NIH image, and plotted as a graph (D, E, F). The corresponding region and size of PCR products for the primer pairs MM2, MM4, MC2, and TPI5 were the MDR1 promoter containing MspI/Hpa II sites (Fig 1) and 121 bp; MDR1 promoter containing Msp I/Hpa II sites (Fig 1), 206 bp;MDR1 promoter containing no Msp I/Hpa II site (Fig 1), 240 bp; and triosephosphate isomerase gene promoter containingMsp I/Hpa II sites, 240 bp, respectively. The results for PCR primer pairs MM2, MM4, MC2, and TPI5 were plotted by (◊), (○), (□), and (•), respectively.
Determination of methylation status of the MDR1promoter region by quantitative PCR analysis. Genomic DNA isolated from either NPB (A, B, D, E) or KB 3-1 cell line (C, F) was digested withPst I (A, D), Msp I/Pst I (B, E), orHpa II/Pst I (C, F), respectively, serially diluted, and amplified by PCR. (A, B, and C) The ethidium bromide stain after electrophoresis of PCR products in a 2% agarose gel. The gel was analyzed with NIH image, and plotted as a graph (D, E, F). The corresponding region and size of PCR products for the primer pairs MM2, MM4, MC2, and TPI5 were the MDR1 promoter containing MspI/Hpa II sites (Fig 1) and 121 bp; MDR1 promoter containing Msp I/Hpa II sites (Fig 1), 206 bp;MDR1 promoter containing no Msp I/Hpa II site (Fig 1), 240 bp; and triosephosphate isomerase gene promoter containingMsp I/Hpa II sites, 240 bp, respectively. The results for PCR primer pairs MM2, MM4, MC2, and TPI5 were plotted by (◊), (○), (□), and (•), respectively.
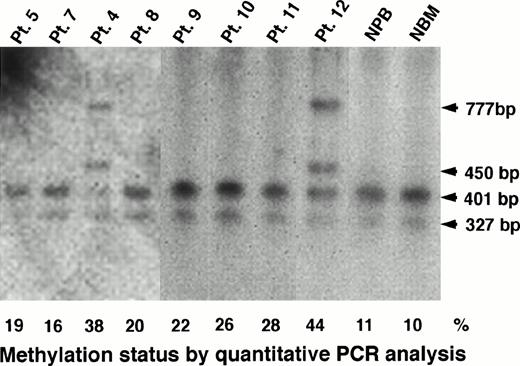
Southern blot analysis could confirm the results obtained by PCR analysis for heavily methylated patients. In Pts. 4 and 12, who had a methylation status of 38% and 44%, respectively, Southern blot analysis apparently showed undigested fragments of 450 bp and 777 bp (Figs 1 and 7). However, we could observe only completely digested fragments of 327 bp and 401 bp in Pts. 5, 7, 8, 9, 10, and 11 who had a methylation status of 19%, 16%, 20%, 22%, 26%, and 28%, respectively (Fig 7). In conclusion, we could not detect a low level of methylation status by Southern blot analysis, but we could detect it by PCR assay, and then we analyzed further the data obtained by quantitative PCR analysis.
Determination of methylation status of the MDR1promoter region by Southern blot analysis in AML patients, NPB, and normal bone marrow (NBM) cells. The 327-bp, 401-bp, 450-bp and 777-bp fragments were described in the legend to Fig 1. Methylation status (%) by quantitative PCR analysis is shown below the panel.
Determination of methylation status of the MDR1promoter region by Southern blot analysis in AML patients, NPB, and normal bone marrow (NBM) cells. The 327-bp, 401-bp, 450-bp and 777-bp fragments were described in the legend to Fig 1. Methylation status (%) by quantitative PCR analysis is shown below the panel.
Correlation between MDR1 gene expression and methylation status of 5′CpG sites at the MDR1 promoter region.
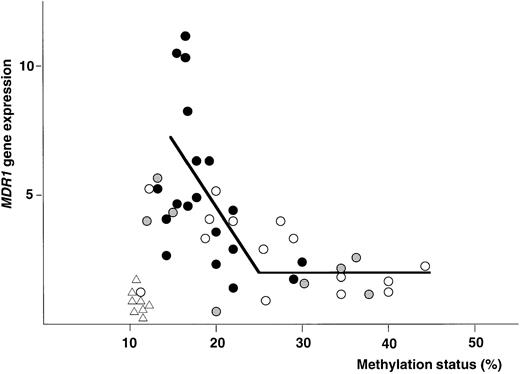
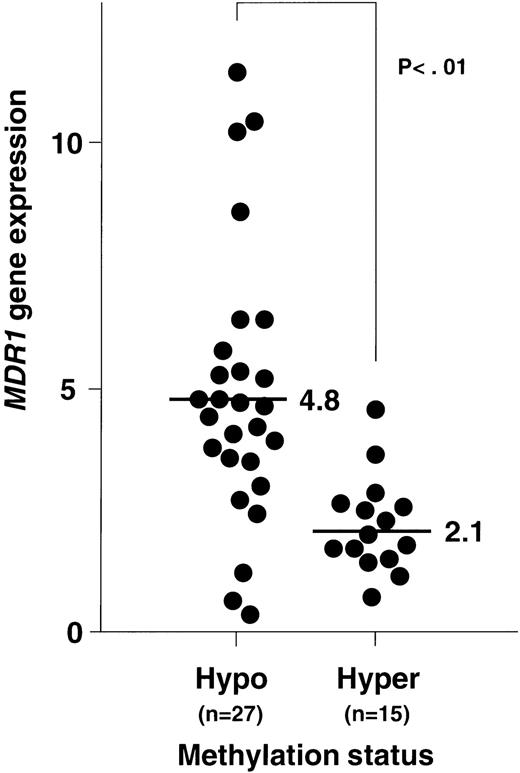
Figure 8 shows the plottings of the correlation between MDR1 gene expression and methylation status of 5′CpG sites at the MDR1 promoter region. At first, NPB genomic DNA was digested with Hpa II and Pst I, and then analyzed. All of NPB (n = 8) was within twofold of the average MDR1 expression levels in NPB as described before and within 12% of methylation status. We then analyzed methylation status and expression of the MDR1 gene in AML. Evaluation was performed with piecewise linear regression analysis. Regression lines were obtained when (1) 15% < ST < 25%, MDR1 = −0.53 (ST) + 9.81, and (2) when 25% < ST, MDR1 = 0.01 (ST) + 1.71; ST = percentage of methylation status, MDR1 = value of MDR1 gene expression. Inverse correlation was observed quantitatively in AML, and moreover relatively hypomethylation status was observed in AML with refractory (Fig8). We evaluated the cut-off point of methylation status. When we defined the cut-off point as 20%, 25%, and 30%, theP values of MDR1 gene expression between hypomethylation and hypermethylation status were calculated as .001, < .001, and .001, respectively. Then we defined the cut-off point as 25%. In the group with hypomethylated status, the number of patients who showed MDR1 positive expression were 22 of 27 (81%). In the group with hypermethylated status, the number of patients with MDR1 positive expression were only 2 of 15 (13%). Average MDR1 mRNA levels were 4.8 and 2.1 in the groups with hypomethylation and hypermethylation status, respectively (Fig 9). These results strongly indicate an inverse correlation between expression and methylation status of promoter CpG sites of the MDR1 gene in AML. In this study, 15 of 42 samples were hypermethylated with MM2 primers, but only 1 of 42 samples was hypermethylated with MM4 primers (data not shown).
The plottings of the correlation between MDR1gene expression and methylation status of 5′CpG sites at theMDR1 promoter region in NPB and AML patients. X-axis is methylation status described as percent (%). Y-axis is MDR1gene expression described as fold compared with average value of NPB. (▵), NPB; (○), AML with CR; (•), AML with refractory; and (◍), AML M3 and AML with unknown outcome. The solid line was piecewise linear regression line. The value of methylation status at which the slope changed significantly was 25%.
The plottings of the correlation between MDR1gene expression and methylation status of 5′CpG sites at theMDR1 promoter region in NPB and AML patients. X-axis is methylation status described as percent (%). Y-axis is MDR1gene expression described as fold compared with average value of NPB. (▵), NPB; (○), AML with CR; (•), AML with refractory; and (◍), AML M3 and AML with unknown outcome. The solid line was piecewise linear regression line. The value of methylation status at which the slope changed significantly was 25%.
Relationship between MDR1 gene expression and methylation status of 5′CpG sites at the MDR1 promoter region in AML patients. MDR1 gene expression was determined by quantitative RT-PCR (Fig 2), and the data were from Fig 4. Methylation status was analyzed by quantitative PCR (Fig 6). Criteria for hypomethylation and hypermethylation status were defined as described in Results. Average levels of MDR1 mRNA for each methylation status are indicated.
Relationship between MDR1 gene expression and methylation status of 5′CpG sites at the MDR1 promoter region in AML patients. MDR1 gene expression was determined by quantitative RT-PCR (Fig 2), and the data were from Fig 4. Methylation status was analyzed by quantitative PCR (Fig 6). Criteria for hypomethylation and hypermethylation status were defined as described in Results. Average levels of MDR1 mRNA for each methylation status are indicated.
Alteration of methylation status and MDR1 gene expression during the clinical course.
It is important to know if methylation status could affect expression of the MDR1 gene during the clinical course of AML. We evaluated three groups of the clinical course in AML, except for AML M3 (Table 2). The first group was primary diagnosis with CR. In this group, the average value of the MDR1gene expression was 2.7 (n = 12) and 8 of 12 (66%) were hypermethylation status. The second group was relapsed state with CR. The average value of the MDR1 gene was 2.8 (n = 4) and 2 of 4 (50%) were hypermethylation status. The third group was relapsed with refractory. The average value of the MDR1 gene was 4.9 (n = 7) and 0 of 7 (0%) were hypermethylation status.
Alteration of Methylation Status of MDR1Gene in the Three Groups of Clinical Status of AML Patients
| Status and Clinical Outcome . | No. of Patients With Hypermethylation* . | No. of Patients With MDR1 Positive† . | Average Value of MDR1 Gene Expression† . |
|---|---|---|---|
| Primary diagnosis with CR | 8/12 (66%) | 5/12 (42%) | 2.7 (n = 12) |
| Relapse with CR | 2/4 (50%) | 2/4 (50%) | 2.8 (n = 4) |
| Relapse with Refractory | 0/7 (0%) | 6/7 (86%) | 4.9 (n = 7) |
Methylation status was analyzed by PCR (Fig 6). Hypermethylation status defined as described in Results. Number of patients with hypermethylation status of MDR1 gene out of total number of patients tested, and frequency is shown in parentheses.
MDR1 expression was determined as described in the legend to Fig 4. Positive means more than 3.0. Total number of tested patients is presented in parentheses.
More than two samples during the clinical course were available for six patients. In the first patient, hypermethylation and low expression of the MDR1 gene were observed at both initial diagnosis and relapse. In the second patient, hypomethylation and high expression of the MDR1 gene were observed at initial diagnosis, and at first and second relapse. The third and fourth patients were refractory to induction therapy; hypomethylation and high expression of theMDR1 gene were observed throughout the clinical course. Alteration of methylation status and MDR1 gene expression was observed during the clinical course in two patients, which diagnosed at AML M2 (Table 3). In the Pt. 13, theMDR1 gene expression was negative and the promoter region was hypermethylated at diagnosis. At relapse, MDR1 was positive and the promoter region was hypomethylated. In the Pt. 14, the MDR1was negative and the promoter region was hypermethylated at diagnosis and first relapse. At second relapse, MDR1 was positive and the promoter region was hypomethylated.
Alteration of Methylation Status and MDR1Expression During the Clinical Course in Two AML Patients
| Status . | Methylation Status3-150 . | MDR1 Gene Expression3-151 . | Clinical Outcome . |
|---|---|---|---|
| Pt. 13 | |||
| Primary diagnosis | Hyper (34%) | Negative (1.9) | CR |
| Relapse | Hypo (17%) | Positive (4.9) | Refractory |
| Pt. 14 | |||
| Primary diagnosis | Hyper (29%) | Negative (2.8) | CR |
| First relapse | Hyper (34%) | Negative (2.0) | CR |
| Second relapse | Hypo (22%) | Positive (4.4) | Refractory |
Methylation status was analyzed by PCR (Fig 6) and represented as % valued in parenthesis. Hypo and hyper indicate hypomethylation and hypermethylation status defined as described in Results, respectively.
MDR1 expression was determined as described in the legend to Fig 4. Negative means <3.0, and positive means >3.0.
DISCUSSION
Expression of MDR1/P-gp is closely related to the clinical outcome of patients with AML.14-17 About 70% of patients with lower expression of MDR1/P-gp have CR, while only 30% to 40% of patients with higher expression of MDR1/P-gp will do as well.14-17 Our clinical data show that only 7 of 21 (33%) AML patients with MDR1 positive expression had CR, whereas in the 13 AML patients with MDR1 negative expression, 8 (62%) had CR (Table 1). We defined more than three times the average value ofMDR1 mRNA in NPB as MDR1 positive (Fig 2). Quantitative measurement of MDR1 gene levels is important for the choice of therapeutic drugs for cancer. Beck et al53 have shown that expression of MDR1/P-gp in clinical samples can be determined in a reliable and consistent fashion. In this study, we used quantitative PCR analysis on clinical samples from patients with AML.MDR1 gene expression was detectable in all patients and healthy individuals in this study; the PCR assay allows detection and quantitation of the MDR1 mRNA in samples too small for accurate measurement by Northern blot, Western blot, immunohistochemistry, or even by RNase protection assay. Expression of β2-microglobulin served as an endogenous control and was shown to be expressed at relatively constant levels when consistent RNA loading could be documented by gel electrophoresis and ethidium bromide staining.44 45
We chose AML samples that contained more than 50% blasts. Contamination with normal blood cells could result in underestimation of up to 50% of expression and methylation extent because both were expected to be very low in normal blood cells. Gene expression and methylation data may be corrected by blast content as follows. Each corrected value for both expression and methylation is calculated from (X × A) + (Y × B) = Z, where X is the corrected blast value, Y is 1 as the value in normal blood cells, andZ is the putative value estimated in Fig 4. A is the blast content and B is “1 − (blast content),” the contribution of normal blood cells. We obtained a much higher Pvalue, .005 by this correction; thus, contamination with normal blood cells appears not to lead to a wrong conclusion. It is also theoretically possible that a small fraction of CD34+ stem cells expressing high levels of MDR1 mRNA are included in the majority of cells expressing no MDR1 mRNA and carrying a hypermethylated MDR1 promoter. This type of heterogeneity also might underestimate the inverse correlation between expression and methylation status of the MDR1 gene.
AML patients expressing CD34 at diagnosis do not respond well to induction therapy,54 and leukemic cells expressing CD34 and other early hematopoietic progenitor markers also expressMDR1/P-gp.55,56 In this study, 4 of 6 (66%) CD34+ and 3 of 8 (38%) CD34− samples hadMDR1 positive expression. Four of 5 (80%) patients with AML M1 had MDR1 positive expression, while 1 of 5 (20%) patients with AML M3 had MDR1 positive expression. Leith et al57reported that elderly AML patients had a high frequency of MDR1gene overexpression and poor CR rate. In our present study, 3 of 5 (60%) patients had MDR1 positive expression and CR in the group of elderly patients (older than 65 years) at initial diagnosis. In contrast, 11 of 23 (48%) patients had MDR1 positive expression and 12 of 19 (63%) patients have CR in the group of younger patients (younger than 65 years), respectively.
The MDR1 promoter region is GC-rich, and it belongs to the CpG island, according to the criteria by Gardiner-Garden and Frommer.58 The presence of a methylated sequence in the 5′ regulatory regions of certain genes appears to determine the level of transcription,59 and DNA methylation often induces gene inactivation during in vitro transcription assays.60We have previously shown that the MDR1 promoter is hypomethylated in multidrug resistance cell lines.41 We observed that MDR1 gene expression was associated with methylation status of the promoter region in clinical AML cells. We and others have reported that MDR1 gene expression is mediated in part through a nuclear transacting factor, YB-1, which is expected to bind to the Y-box at −82 to −75 on the MDR1promoter.22-25,61 In the present study, 13 of 18MDR1 negative patients were hypermethylated at the promoter region near the Y-box (MM2), and only 1 was hypermethylated at the region between exon 1 and exon 2 (MM4). The methylation status at CpG sites near the Y-box might be important for MDR1 gene expression. These results suggest that demethylation of CpG sites of MDR1 promoter region is the necessary condition forMDR1 gene overexpression in AML. During the preparation of this report, Kantharidis et al62 have reported association of altered methylation of the human MDR1 promoter with multidrug resistance in a T-cell leukemia cell line and three patients of chronic lymphocytic leukemia. Although the data on clinical samples were preliminary in this report, they further support the conclusion reached here. Moreover, using the piecewise linear regression analysis, the value of drastically changing the slope was 25% of methylation status. This result was consistent with the lowest P value when we defined the cut-off point as also being 25%.
Because of low expression and under-methylation of the MDR1gene in NPB cells, we propose a two-step hypothesis for methylation status and expression of the MDR1 gene during cancer development and subsequent clinical course. First, de novo methylation occurs at CpG sites of the MDR1 promoter during carcinogenesis by increased DNA methyltransferase activity or other mechanisms.23 Next, de novo demethylation occurs, and theMDR1 gene is expressed by an anticancer drug or other cytotoxic stress. Alternatively, malignant cells may be a heterogeneous population consisting of low-expression/hypermethylated-MDR1cells and high-expression/hypomethylated-MDR1 cells; one might expect that the low-expression/hypermethylated-MDR1 population has an advantage during carcinogenesis and the high-expression/hypomethylated-MDR1 population has the advantage during chemotherapy. In the three AML groups of clinical course and in the two patients whose methylation status changed from hypermethylation to hypomethylation, this was accompanied by overexpression of the MDR1 gene, making it unlikely that theMDR1 overexpressing population was selected by chemotherapy. Although these events are so far undetermined, we prefer the first scenario.
Recently, Fojo et al47 51 showed the evidence that theMDR1 gene is frequently “turned on” by rearrangements which allow upstream constitutive promoters to control MDR1expression in some human cancer cell lines and ALL clinical samples. We could not detect any transcripts that came through from the upstream promoter by RNase protection assay for AML clinical samples. Expression from the upstream promoter may cause demethylation of the MDR1 promoter region, but expression from the upstream in advance of the demethylation seems unlikely in AML clinical samples.
In conclusion, methylation status on the MDR1 promoter region appears to be associated closely with MDR1 gene expression. Hypomethylation status of the MDR1 promoter might be a necessary condition for increasing MDR1 mRNA levels as well as acquirement of multidrug resistant phenotype in AML patients.
ACKNOWLEDGMENT
We thank Dr Kouhei Akazawa (Kyushu University) for statistical analysis; Drs Takeshi Uchiumi, Naoyuki Kawahara, Motoaki Shiratsuchi, Noriaki Matsui, and Masazumi Tsuneyoshi (Kyushu University) for technical discussion on immunohistochemistry; Dr Kimitoshi Kohno (University of Occupational and Environmental Health, Kitakyushu, Japan) for fruitful discussion; and Dr Ilseung Choi (Kyushu Cancer Center) for technical help.
Supported by grants from the Ministry of Education, Science, Sports, and Culture of Japan, the Fukuoka Anti-Cancer Research Fund, Second-Term Comprehensive Ten-Year Strategy for Cancer Control from the Ministry of Health and Welfare, and CREST (Core Research for Evolutional Science and Technology) of Japan Science and Technology Corporation (JST).
The publication costs of this article were defrayed in part by page charge payment. This article must therefore be hereby marked “advertisement” in accordance with 18 U.S.C. section 1734 solely to indicate this fact.
REFERENCES
Author notes
Address reprint requests to Morimasa Wada, PhD, Department of Biochemistry, Kyushu University School of Medicine, 3-1-1 Maidashi, Higashi-ku, Fukuoka 812-8582, Japan; e-mail: wada@biochem1.med.kyushu-u.ac.jp.

This feature is available to Subscribers Only
Sign In or Create an Account Close Modal