Previous reports showed that granulocyte colony-stimulating factor (G-CSF)-mobilized peripheral blood mononuclear cells (G-PBMC) are hyporesponsive to alloantigen compared with control PBMC. In the current study, neutralizing antibodies to interleukin-10 (IL-10) increased the proliferative response of G-PBMC to alloantigen by 50.14% (± 12.79%; n = 8), whereas the proliferative response of control PBMC was not affected. The inhibition of OKT3-stimulated CD4 cell proliferation by G-PBMC–derived CD14+ cells could also be abrogated by the addition of IL-10 neutralizing antibodies. Further, IL-10 levels correlated with the number of CD14 cells in these cultures. Constitutive IL-10 mRNA levels detected by quantitative reverse transcriptase-polymerase chain reaction (RT-PCR) were 10-fold higher in G-PBMC compared with control PBMC. This translated into significantly higher IL-10 levels after 24-hour lipopolysaccharide (LPS) stimulation of G-PBMC compared with control PBMC (P = .036). IL-10 mRNA levels were also fivefold higher in isolated G-PBMC-derived CD14 cells compared with control CD14 cells. This corresponded to increased constitutive production of IL-10 by isolated G-PBMC–derived CD14 cells compared with control CD14 cells (357.2 ± 104.5 v 51.7 ± 30.5, P = .051). In conclusion, these data suggest that monocytes contained within G-PBMC, which, in comparison to marrow, are increased in absolute number and relative proportion to T cells, may suppress T-cell responsiveness by secretion of IL-10.
GRANULOCYTE COLONY-stimulating factor (G-CSF)–mobilized peripheral blood mononuclear cells (G-PBMC) used for hematopoietic reconstitution after myeloablative therapy contain a large number of CD14+ monocytes. This is a direct result of G-CSF treatment of the donor, which increases peripheral monocyte counts, with additional enrichment for monocytes through the leukapheresis procedure. Overall, G-PBMC contain approximately 50 times more monocytes and 10 times more T cells than typical marrow grafts, which translates into monocyte–T-cell ratios five times greater in G-PBMC as compared with marrow or normal PBMC.1
We have reported previously that the large number of CD14+monocytes in G-PBMC can suppress alloantigen-induced T-cell proliferation in a dose-dependent and largely contact-independent fashion.1 In addition, CD4 T cells in G-PBMC compared with CD4 cells from normal PBMC controls show impaired induction of the CD28 responsive complex (CD28RC), a pivotal interleukin-2 (IL-2) transcription factor. The suppressed induction of CD28RC in G-PBMC was reversible after depleting monocytes.2 Other investigators using murine allogeneic transplantation models, showed that G-CSF treatment may also have direct effects on donor T-cell function by inducing a polarization toward a Th2-cytokine phenotype.3 4
The hyporesponsiveness of G-PBMC to alloantigen in vitro corresponds in theory to clinical observations in the allogeneic HLA-identical transplantation setting, where the G-PBMC products, which contain at least 10 times more T cells than marrow, have not translated into a higher incidence or severity of acute graft-versus-host disease (aGVHD).5-8 Whether these two observations are mechanistically related remains speculative. However, a better understanding of the mechanisms responsible for the hyporesponsiveness of G-PBMC to alloantigen could lead to strategies for optimizing the cellular composition of transplantation products. For this purpose, we extended our previous study and analyzed potential mechanisms of monocyte-mediated suppression. Data presented in this report suggest that IL-10, a potent antiinflammatory cytokine preferentially produced by activated monocytes/macrophages and T cells, is a factor by which monocytes suppress T-cell responsiveness in G-PBMC products.
MATERIALS AND METHODS
Donors, G-CSF–mobilization, and PBMC processing.
Samples were collected after written informed consent using forms approved by the Institutional Review Board of the Fred Hutchinson Cancer Research Center (FHCRC). Donors were treated by subcutaneous injection with recombinant human (rh)G-CSF (Amgen, Inc, Thousand Oaks, CA) at a dose of 16 μg/kg/d for 4 to 7 days. Leukapheresis was performed using a continuous flow blood cell separator (Cobe Laboratories, Lakewood, CO) on 2 consecutive days beginning on day 4 of rhG-CSF administration. Heparinized peripheral blood samples obtained from the same donor before the first administration of G-CSF (control PBMC) and samples from the first leukapheresis (G-PBMC) were used for comparative experiments. Control PBMC were isolated over Ficoll (Accu-Prep, Accurate Chemicals, Westbury, NY; 1.077 g/mL) step gradients, hemolysed (ammonium chloride 150 mmol/L; sodium bicarbonate 12 mmol/L) and washed three times in Hank's Balanced Salt Solution (HBSS)/1% bovine serum albumin (BSA). G-PBMC were suspended in HBSS/1% BSA and centrifuged at 200g for 10 minutes to remove platelets. All cells were cryopreserved to allow simultaneous testing.
Isolation of CD4 T cells and monocytes.
For fluorescence-activated cell sorting (FACS), cells were stained with LeuM3 (anti-CD14–phycoerythrin [PE]; Becton Dickinson, San Jose, CA) and Leu-3a (anti-CD4–fluorescein isothiocyanate [FITC]; Becton Dickinson). Staining for both CD14 and CD4 allowed clear separation of populations and minimized cross-contamination, as some CD14 cells coexpress CD4. After incubation with antibody conjugates for 20 minutes on ice, cells were washed twice in HBSS/1% BSA and sorted as described previously.9 Purity of CD4 and CD14 cells was always greater than 96% after sorting. Cells were counted, resuspended in RPMI 1640 medium supplemented with 10% fetal calf serum (FCS), penicillin (100 U/mL), and streptomycin sulfate (100 g/mL). Viability always exceeded 95% as determined by trypan blue exclusion.
In some experiments monocytes were obtained after sheep erythrocyte-rosetting to deplete for T cells,10 followed by cell sorting based on light scattering characteristics or followed by counterflow centrifugal elutriation.11 This approach avoided staining with anti-CD14 antibodies and minimized the possibility of nonspecific activation. The purity of CD14+cells obtained using this technique was typically greater than 85%.
Mixed leukocyte cultures (MLC).
Cultures were established in round-bottom 96-well plates (Costar, Cambridge, MA). Responder PBMC or sorted CD4 cells in indicated numbers were cultured with 1.0 × 10⁵ irradiated (30 Gy), allogeneic, DR-mismatched PBMC stimulators in 200 μL RPMI 1640 medium supplemented with 10% FCS, L-glutamine (0.4 mg/mL), penicillin (100 U/mL), and streptomycin (100 g/mL). At 120 hours, cultures were pulsed with 3H-thymidine (1.0 μCi/well) for the final 18 hours. Cells were harvested and 3H-thymidine incorporation was measured by liquid scintillation counting. In some experiments neutralizing monoclonal antibody to hIL-10 (mouse IgG2b, clone 217, R&D Systems, Minneapolis, MN) at 4 μg/mL was added at the initiation of cultures.
Polyclonal stimulation assay using immobilized anti-CD3.
Flat-bottom 96-well plates (Costar) were coated overnight at 4°C with monoclonal antibody OKT3 (Ortho, Raritan, NJ) at 50 ng/mL in Tris-HCl buffer (pH 9.6). Plates were washed twice with phosphate-buffered saline (PBS)/1% BSA before adding cells. PBMC or sorted CD4 cells were suspended in RPMI/10% FCS and seeded at indicated concentrations. At 96 hours, cultures were pulsed with3H-thymidine for the final 18 hours. For monocyte-suppression studies, sorted or elutriated CD14 cells were added to the cultures on day 0. Neutralizing antibodies to IL-10 (NAB IL-10) were used as described above.
Immunomagnetic cell sorting for CD14 depletion of G-PBMC.
CD14-depleted fractions of G-PBMC containing less than 2% CD14 cells were obtained by negative selection using LeuM3 anti-CD14–PE, mouse antihuman-IgG2a (Becton Dickinson) as primary antibody, and rat antimouse-IgG2a+b conjugated to magnetic microbeads as secondary antibody according to the manufacturer's instructions (Miltenyi Biotec GmbH, Bergisch Gladbach, Germany).
IL-10 reverse transcriptase-polymerase chain reaction (RT-PCR).
Cells were pelleted and lysed in Proteinase K/sodium dodecyl sulfate (SDS) buffer (GIBCO-BRL, Gaithersburg, MD; Boehringer Mannheim, Indianapolis, IN) as described previously.12 Total RNA was extracted by phenol-chloroform, precipitated with ethanol, and resuspended in RNAse-free water.13 Extracted RNA was treated twice with DNAse (Promega, Madison, WI) to digest genomic DNA followed by phenol-chloroform extraction and ethanol precipitation.
RNA for IL-10 and β2-microglobulin (β2m) analysis was denatured and reverse transcribed by using 0.1 μg/mL pdT12-18 (Pharmacia, Piscataway, NJ), Moloney murine leukemia virus (MMLV)-RT (GIBCO-BRL), 0.5 mmol/L of each dNTP (Pharmacia), 25 mmol/L dithiothreitol (DTT), 0.2 U/mL RNAsin (Promega) and 1x First Strand Buffer (GIBCO-BRL) in a final volume of 20 μL. For PCR amplification, first-strand cDNA corresponding to approximately 104 cells was added to PCR mixture (0.5 U Taq-polymerase [AmpliTaq, Perkin Elmer, Branchburg, NJ], 0.2 mmol/L dNTP, 5 μg/mL specific primers, RNAse-free water, 50 mmol/L KCl, 10 mmol/L Tris, 0.001% gelatin, and 1.25 mmol/L MgCl2 for IL-10, and 2.5 mmol/L MgCl2 for β2m) in a total volume of 25 μL. The reaction mixtures were amplified in a Perkin Elmer thermal cycler 9600 for 35 cycles with the following temperature profile: 4 minutes at 94°C, (15 seconds at 94°C, 45 seconds at 56°C, 30 seconds at 72°C) × 35, and 5 minutes at 72°C. PCR with β2m-specific primers was performed on each sample as a control for efficient cDNA synthesis. Negative controls were included for every PCR analysis. PCR products were separated in 4% agarose gels and stained with ethidium bromide. Specific primers were custom synthesized (FHCRC Shared Resources Facility): 5′ IL-10 ACCAAGACCCAGACATCAAG; 3′ IL-10 GAGGTACAATAAGGTTTCTCAAG; 5′ β2m ATGTCTCGCTCCGTGGCCTTAGCT; 3′ β2m CCTCCATGATGCTGCTTACATGTC. Amplification products were 350 bp for IL-10 and 380 bp for β2m. The feasibility of this technique for semiquantitative measurements was confirmed by cDNA-dilution series.
Cytokine analysis.
Culture supernatants were harvested from triplicate cultures at indicated timepoints and frozen at −20°C until analysis.Lipopolysaccharide (LPS; from Escherichia coli 026:B6; Sigma, St Louis, MO) for stimulation was used at a concentration between 0.01 and 1.0 μg/mL. Cytokine enzyme-linked immunosorbent assays (ELISAs) were performed by Allen Farrand of the FHCRC Shared Resources Facility. For IL-1α, tumor necrosis factor-α (TNF-α), and interferon-γ (IFN-γ), polystyrene 96-well plates (Costar) were coated overnight (ON) at 4°C with cytokine-specific capture antibodies in 50 mmol/L Na carbonate, pH 9.5. Capture antibody concentrations were 2.5 μg/mL for IL-1α (PharMingen, San Diego, CA), 2 μg/mL for TNF-α (Boehringer Mannheim Biochemicals), and 1 μg/mL for IFN-γ (Endogen, Boston, MA). The next day, plates were washed and nonspecific binding was blocked by incubation with 1% BSA/Tris-buffered saline (TBS; Sigma) at room temperature (RT) for 1 hour. Plates were then washed three times with PBS-T before addition of samples. Diluted samples, controls, and standards were incubated ON at 4°C. The next day, plates were washed five times with PBS-T and detection of captured IL-1α was accomplished by addition of 0.5 μg/mL mouse antihuman IL-1α–biotin conjugate (PharMingen); detection of captured IFN-γ by addition of a 0.5 μg/mL of mouse antihuman IFN-γ–biotin conjugate (Endogen). Detection of captured TNF-α was accomplished by addition of a 0.05 U/μL mouse antihuman TNF-α–horseradish peroxidase (HRP) conjugate (Boehringer Mannheim Biochemicals) in 1% BSA/5 mmol/L EDTA/TBS-T at RT and IL-1α and IFN-γ antibody-cytokine complex was detected by using avidin D-HRP (Vector Labs, Burlingame, CA).
For human IL-8 and IL-10, 96-well plates (Costar) were coated ON at RT with 2 μg/mL of mouse antihuman IL-8 or rat antihuman IL-10 (Endogen) in PBS. Nonspecific binding was blocked with 1% BSA/TBS at RT for 1 hour and plates were washed three times with PBS-T. Diluted samples were incubated in 0.1% BSA/TBS-T containing 25 ng/mL of mouse antihuman IL-8–biotin or 100 ng/mL of rat antihuman IL-10 (Endogen) in 96-well plates (Costar) for 2 hours before addition to the binding plate. After transfer to binding plates, samples were incubated another 2 hours at RT. Detection of captured IL-8 or IL-10 was accomplished by addition of PolyHRP-SA20 conjugate (Research Diagnostics Inc, Flanders, NJ) at a 1:20,000 dilution of 0.1% BSA/TBS-T at RT. After 30 minutes incubation, all plates were washed five times with PBS-T before substrate (TMB, 2-Component, KPL) was added. Reactions were stopped with 1 mol/L H3PO4. Optical density was determined at 450 to 650 nm using a microplate reader (Vmax; Molecular Devices, Sunnyvale, CA). Unknown values were calculated from a standard curve using recombinant human standards (R&D Systems). All samples, standards, and controls were run in duplicates. Interassay and intraassay coefficients of variation (CVs) were determined to be less than 10% with assay sensitivities of <5 pg/mL for IL-1α, <1 pg/mL for IFN-γ, and TNF-α, and <0.5 pg/mL for IL-8 and IL-10.
Statistical analysis.
Proliferation and cytokine data are summarized with means and standard errors. Statistical comparisons were performed using t-tests. Where appropriate, paired versions of the t-test were applied.
RESULTS
Monocytes suppress OKT3-stimulated T-cell proliferation.
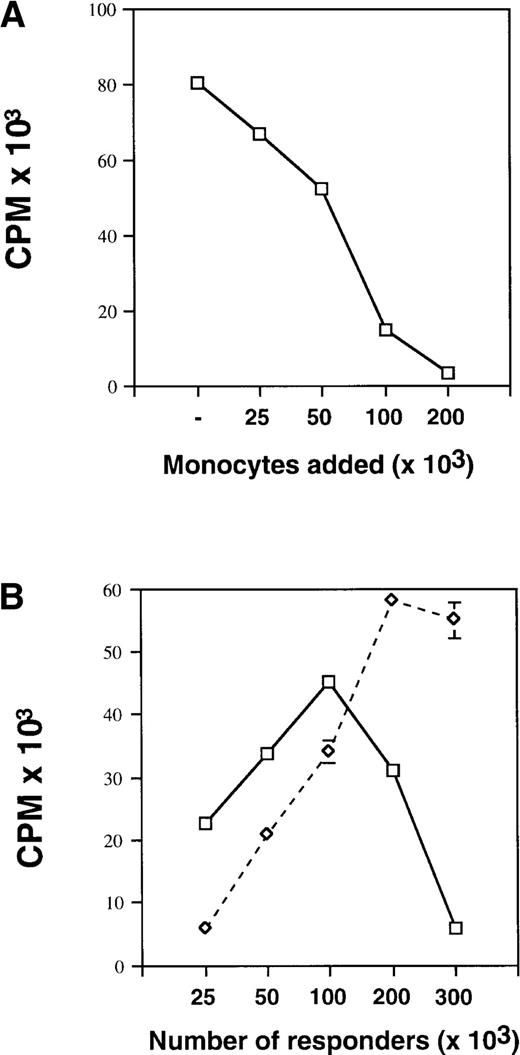
We have reported previously that control and G-PBMC–derived CD14 cells suppress proliferation of autologous PBMC responders or purified CD4 responders in MLC in a dose-dependent fashion when irradiated allogeneic stimulators were used.1 We have now extended our previous study using immobilized OKT3 for polyclonal stimulation of T-cell proliferation. As shown in Fig 1A, the addition of increasing numbers of control monocytes obtained by elutriation to a fixed number (100 × 103) of autologous PBMC responders lead to a dose-dependent suppression of proliferation. When increasing numbers of unfractionated G-PBMC were stimulated with immobilized OKT3 (Fig 1B), proliferation decreased progressively after exceeding a threshold number of approximately 100 × 103 cells/200 μL. This threshold number varied dependent on the proportion of monocytes present in a sample. In contrast, CD14-depleted G-PBMC containing less than 2% CD14+ cells showed increasing proliferation up to cell concentrations of 300 × 103 cells/200 μL (Fig 2B). These results suggest that monocytes also suppress OKT3-stimulated T-cell proliferation in a dose-dependent manner.
Monocytes suppress OKT3-stimulated T-cell proliferation. (A) Control PBMC at fixed numbers (100 × 103) plus varying numbers of autologous control monocytes obtained by counterflow centrifugal elutriation were cultured in flat-bottom 96-well plates precoated with OKT3 antibody at a concentration of 50 ng/mL. Proliferation was measured on day 4 by 3H-thymidine incorporation. Values represent the mean ± SEM from triplicate cultures. (B) Unfractionated G-PBMC (solid line) or CD14-depleted G-PBMC (dashed line) at increasing numbers were cultured in OKT3-coated 96-well plates. Cultures were pulsed and harvested as described above. Results from one of three experiments are shown.
Monocytes suppress OKT3-stimulated T-cell proliferation. (A) Control PBMC at fixed numbers (100 × 103) plus varying numbers of autologous control monocytes obtained by counterflow centrifugal elutriation were cultured in flat-bottom 96-well plates precoated with OKT3 antibody at a concentration of 50 ng/mL. Proliferation was measured on day 4 by 3H-thymidine incorporation. Values represent the mean ± SEM from triplicate cultures. (B) Unfractionated G-PBMC (solid line) or CD14-depleted G-PBMC (dashed line) at increasing numbers were cultured in OKT3-coated 96-well plates. Cultures were pulsed and harvested as described above. Results from one of three experiments are shown.
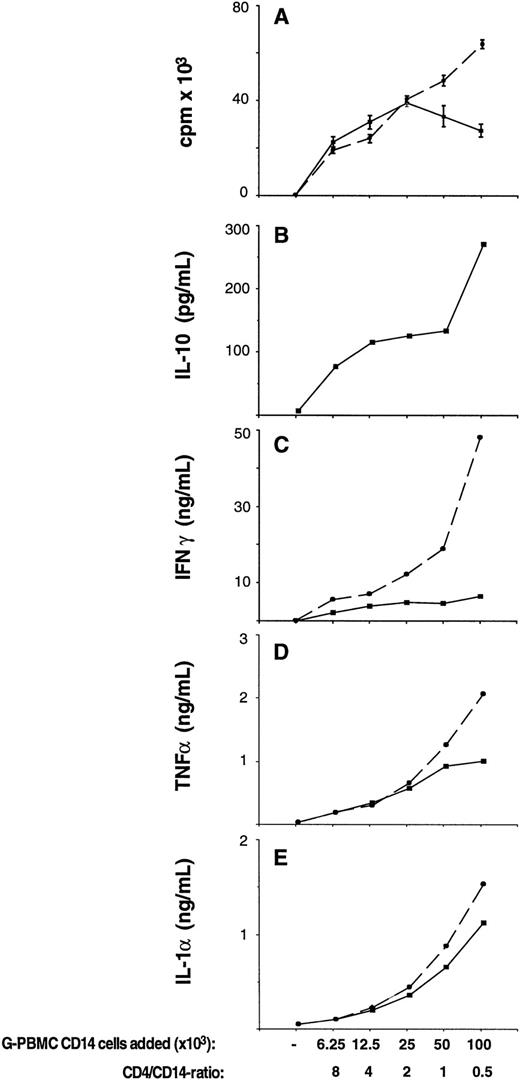
Endogenously produced IL-10 suppresses OKT3-stimulated T-cell proliferation and inflammatory cytokine production in cocultures between G-PBMC-derived CD4 and CD14 cells. CD4 cells at fixed numbers (50 × 103) plus sorted CD14 cells at varying numbers were cultured in flat-bottom 96-well plates precoated with OKT3 antibody at a concentration of 50 ng/mL. (A) Proliferation was measured on day 4 by3H-thymidine incorporation in cultures with (dashed lines) or without (solid lines) neutralizing antibodies to IL-10. Values represent the mean ± SEM from triplicate cultures. (B through E) Concentrations of cytokines IL-10, IFN-γ, TNF-α, and IL-1α as indicated were determined at the time of the proliferation assay (day 4) by ELISA in cultures without (solid lines) or with (dashed lines) neutralizing antibodies to IL-10. Shown is the mean of duplicate ELISA determinations using pooled supernatants from triplicate cultures.
Endogenously produced IL-10 suppresses OKT3-stimulated T-cell proliferation and inflammatory cytokine production in cocultures between G-PBMC-derived CD4 and CD14 cells. CD4 cells at fixed numbers (50 × 103) plus sorted CD14 cells at varying numbers were cultured in flat-bottom 96-well plates precoated with OKT3 antibody at a concentration of 50 ng/mL. (A) Proliferation was measured on day 4 by3H-thymidine incorporation in cultures with (dashed lines) or without (solid lines) neutralizing antibodies to IL-10. Values represent the mean ± SEM from triplicate cultures. (B through E) Concentrations of cytokines IL-10, IFN-γ, TNF-α, and IL-1α as indicated were determined at the time of the proliferation assay (day 4) by ELISA in cultures without (solid lines) or with (dashed lines) neutralizing antibodies to IL-10. Shown is the mean of duplicate ELISA determinations using pooled supernatants from triplicate cultures.
Endogenously produced IL-10 suppresses OKT3-stimulated T-cell proliferation and proinflammatory cytokine production.
Monocytes are a major source of the antiinflammatory cytokine IL-10.14-18 To test whether IL-10 might be involved in monocyte-mediated suppression, fixed numbers of sorted G-PBMC–derived CD4 cells plus varying numbers of G-PBMC–derived CD14 cells were stimulated with immobilized OKT-3 in the presence or absence of NAB IL-10. As shown in Fig 2A, 50 × 103 CD4 cells alone did not proliferate, as accessory cells were not present in this system. The addition of small numbers of CD14 cells (6.25 to 12.5 × 10³ G-PBMC–derived CD14 cells; CD4/CD14 ratio 8:1 to 4:1), however, lead to a steep increase in proliferation. After exceeding a threshold number of 25 × 103 CD14 cells (CD4/CD14 ratio 2:1), proliferation decreased. The CD4/CD14 ratio was 4.3 in control PBMC, 0.9 in G-PBMC, and 2.4 in aspirated marrow.1 In the presence of NAB IL-10, G-PBMC–derived CD14 cells even at higher numbers (100 × 103 CD14 cells; CD4/CD14 ratio 1:2) were not suppressive. Corresponding IL-10 levels in culture supernatants at the time when the cultures were pulsed (day 4) are shown in Fig 2B. IL-10 levels increased with increasing numbers of monocytes added to the cultures. These data indicate that endogenously produced IL-10 is a mediator of monocyte-suppression of T-cell proliferation. Figures 1C to E summarize levels for IFN-γ, TNF-α, and IL-1α in the same cultures generated in the presence or absence of NAB IL-10. They show that IL-10 is a potent suppressor of inflammatory cytokine production in these cultures with the strongest inhibitory effect on IFN-γ.
Neutralization of endogenous IL-10 can partially overcome proliferative hyporesponsiveness in G-PBMC.
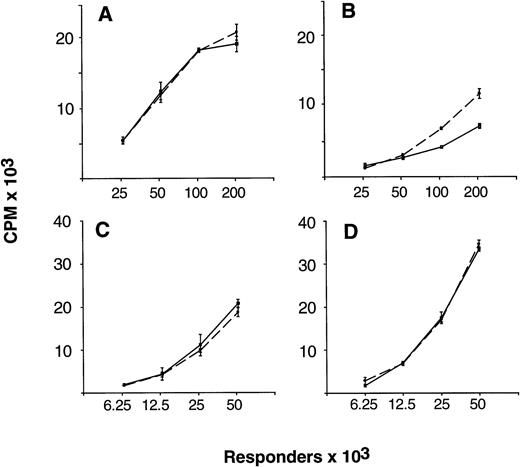
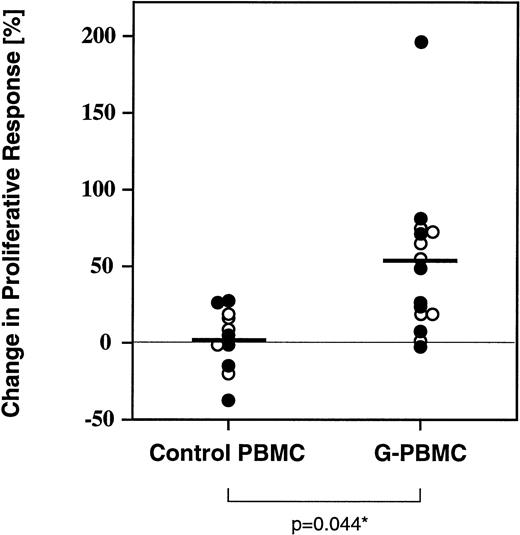
As reported previously, unfractionated G-PBMC contained a several-fold greater proportion of monocytes and showed substantially lower proliferative responses in MLC as compared with equivalent numbers of unfractionated control PBMC.1 To determine the role of endogenously produced IL-10 in causing proliferative hyporesponsiveness of G-PBMC, allogeneic MLC in the presence and absence of NAB IL-10 were initiated using paired samples of unfractionated control and G-PBMC responders. As shown in Fig 3B, proliferative hyporesponsiveness of G-PBMC could be partially overcome when NAB IL-10 were added at initiation of culture, in particular at high responder cell concentrations (100 and 200 × 103 cells/200 μL). Neutralization of IL-10 did not significantly increase proliferative responsiveness when control PBMC responders were used (Fig 3A). Furthermore, neutralization of endogenous IL-10 did not increase proliferation when sorted G-PBMC–derived CD4 responders were used instead of unfractionated G-PBMC (Fig 3C and D). Figure 4 summarizes changes in proliferative responses with NAB IL-10 in allogeneic MLC in a larger series of experiments comparing control PBMC (n = 6) with G-PBMC (n = 8) responders. The mean (± standard error of mean [SEM]) increase in proliferation with IL-10 neutralization was 1.71% (± 5.90%) for control PBMC responders and 50.14% (± 12.79%) for G-PBMC responders, respectively (P = .044, paired t-test). Therefore, endogenously produced IL-10 is partially responsible for proliferative hyporesponsiveness seen with alloantigen-stimulated G-PBMC.
Neutralization of endogenous IL-10 can partially overcome proliferative hyporesponsiveness of G-PBMC in MLC. Unfractionated control PBMC (A) and G-PBMC (B), or purified control CD4 cells (C) and G-PBMC–derived CD4 cells (D) from one donor were used at indicated numbers as responders with 100 × 103 irradiated (30 Gy) allogeneic PBMC stimulators in MLC. Proliferation was measured on day 5 by 3H-thymidine incorporation in cultures without (solid lines) or with (dashed lines) neutralizing antibodies to IL-10. Values represent the mean ± SEM from triplicate cultures. Shown is one of three experiments with side-by-side comparison of unfractionated and purified CD4 cell responders.
Neutralization of endogenous IL-10 can partially overcome proliferative hyporesponsiveness of G-PBMC in MLC. Unfractionated control PBMC (A) and G-PBMC (B), or purified control CD4 cells (C) and G-PBMC–derived CD4 cells (D) from one donor were used at indicated numbers as responders with 100 × 103 irradiated (30 Gy) allogeneic PBMC stimulators in MLC. Proliferation was measured on day 5 by 3H-thymidine incorporation in cultures without (solid lines) or with (dashed lines) neutralizing antibodies to IL-10. Values represent the mean ± SEM from triplicate cultures. Shown is one of three experiments with side-by-side comparison of unfractionated and purified CD4 cell responders.
Change of proliferative responsiveness of control and G-PBMC with neutralization of endogenous IL-10 in MLC. In the experiment, 105 (○) or 2 × 10⁵ (•) unfractionated control (n = 6) or G-PBMC (n = 8) responders plus 100 × 103 irradiated (30 Gy) allogeneic PBMC stimulators were cultured in round-bottom 96-well plates. Proliferation was measured on day 5 by 3H-thymidine incorporation as described in Materials and Methods. Values represent the mean change of proliferation in triplicate cultures containing neutralizing antibodies to IL-10 compared with controls. *Only data points derived from paired G-PBMC and control PBMC samples contributed to the P value (n = 6).
Change of proliferative responsiveness of control and G-PBMC with neutralization of endogenous IL-10 in MLC. In the experiment, 105 (○) or 2 × 10⁵ (•) unfractionated control (n = 6) or G-PBMC (n = 8) responders plus 100 × 103 irradiated (30 Gy) allogeneic PBMC stimulators were cultured in round-bottom 96-well plates. Proliferation was measured on day 5 by 3H-thymidine incorporation as described in Materials and Methods. Values represent the mean change of proliferation in triplicate cultures containing neutralizing antibodies to IL-10 compared with controls. *Only data points derived from paired G-PBMC and control PBMC samples contributed to the P value (n = 6).
IL-10 mRNA expression in control and G-PBMC.
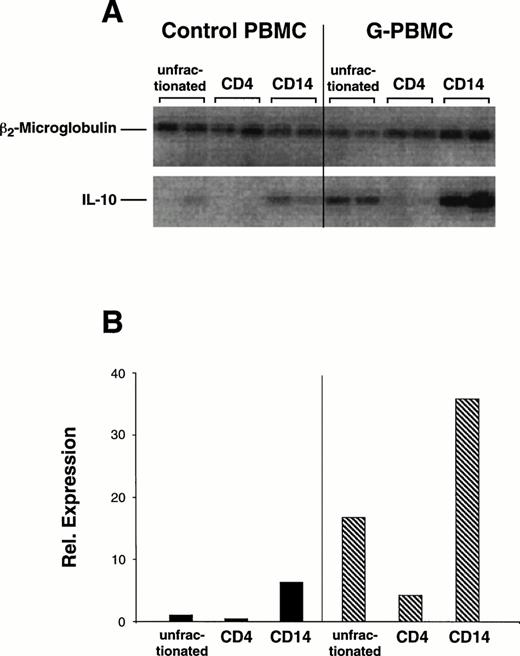
Constitutive expression levels of IL-10 mRNA in unfractionated control and G-PBMC and sorted populations of control and G-PBMC–derived CD4 and CD14 cells were compared by RT-PCR (Fig5). Mean quantitation values for duplicate amplification products (Fig5A) were normalized against β2m as a control for sufficient cDNA synthesis (Fig 5B). Two experiments with paired samples from different normal donors showed that relative expression of IL-10 mRNA was about 10-fold greater in unfractionated G-PBMC compared with unfractionated control PBMC (10.2 v 1.0 relative units). Baseline IL-10 mRNA expression in purified CD4 cells was almost undetectable. Sorted CD14 cells had a strong signal and expression in G-PBMC–derived CD14 cells was approximately five times greater than in control CD14 cells (20.63 v 4.30 relative units). Hence, the strong constitutive mRNA signal for IL-10 in unfractionated G-PBMC was due to the large number of CD14 cells, which also expressed qualitatively more IL-10 mRNA than control CD14 cells.
Constitutive IL-10 mRNA and β2-microglobulin expression in control and G-PBMC. (A) RT-PCR for IL-10 and β2-microglobulin was performed from mRNA extracts of unfractionated PBMC or sorted CD4 and CD14 cells as described in Materials and Methods. The purity of sorted populations exceeded 96%. (B) Mean quantitations (ImageQuant software) of duplicate amplification products were normalized against signals obtained for β2-microglobulin. Shown is one of two experiments using paired control and G-PBMC samples from each of two donors.
Constitutive IL-10 mRNA and β2-microglobulin expression in control and G-PBMC. (A) RT-PCR for IL-10 and β2-microglobulin was performed from mRNA extracts of unfractionated PBMC or sorted CD4 and CD14 cells as described in Materials and Methods. The purity of sorted populations exceeded 96%. (B) Mean quantitations (ImageQuant software) of duplicate amplification products were normalized against signals obtained for β2-microglobulin. Shown is one of two experiments using paired control and G-PBMC samples from each of two donors.
Cytokine production by unfractionated control and G-PBMC and purified monocytes.
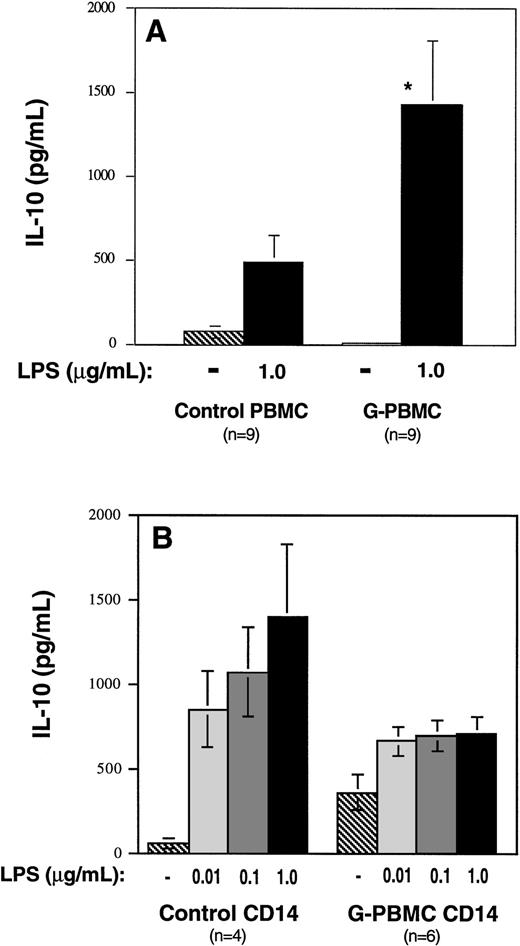
IL-10 levels were determined in 24-hour conditioned medium from unstimulated and LPS-stimulated cultures (1.5 × 10⁶cells/mL) (Fig 6). Baseline production by unfractionated control PBMC (n = 9) and G-PBMC (n = 9) was 72.9 ± 35.6 pg/mL and 7.9 ± 5.2 pg/mL, respectively. LPS stimulation (1 μg/mL) increased IL-10 production in control PBMC to 488.8 (± 159.9) pg/mL, which was 6.7-fold above baseline and to 1428.4 (± 378.0) pg/mL in G-PBMC, which was 180.8-fold above baseline. The difference in IL-10 production between stimulated products was statistically significant (P = .036).
IL-10 production by unfractionated control and G-PBMC and purified control and G-PBMC monocytes. (A) Unfractionated mononuclear cells (1.5 × 10⁶/mL), or (B) purified monocytes (0.5 × 10⁶/mL) were isolated as described in Materials and Methods and cultured in flat-bottom 96-well plates in the presence or absence of LPS at indicated concentrations. Supernatants from triplicate cultures were harvested after 24 hours, pooled, and IL-10 levels were determined by ELISA. (*) Indicates a P value < .05 compared with control.
IL-10 production by unfractionated control and G-PBMC and purified control and G-PBMC monocytes. (A) Unfractionated mononuclear cells (1.5 × 10⁶/mL), or (B) purified monocytes (0.5 × 10⁶/mL) were isolated as described in Materials and Methods and cultured in flat-bottom 96-well plates in the presence or absence of LPS at indicated concentrations. Supernatants from triplicate cultures were harvested after 24 hours, pooled, and IL-10 levels were determined by ELISA. (*) Indicates a P value < .05 compared with control.
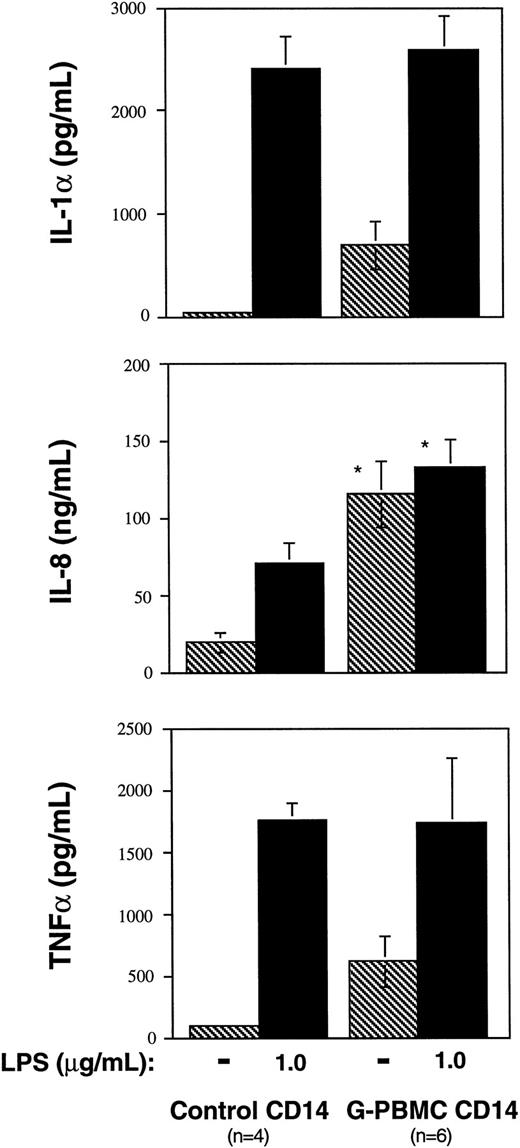
We then determined whether there were qualitative differences in production of cytokines IL-10, IL-1α, IL-8, and TNF-α between control and G-PBMC–derived CD14 cells. To minimize the possibility of nonspecific activation through anti-CD14 staining, monocyte-enriched fractions were prepared without antibody labeling by cell sorting based on light scattering characteristics. The purity of CD14+cells obtained was greater than 85%. As shown in Figs 6B and7, there was a trend for greater constitutive production of IL-10, IL-1α, IL-8, and TNF-α by CD14 cells isolated from G-PBMC (n = 6) compared with those isolated from control PBMC (n = 4). This difference was statistically significant for constitutive secretion of IL-8 (P = .007). However, LPS-induced secretion of these cytokines was not significantly different between these two groups. Thus, the approximately threefold higher LPS-induced IL-10 levels in unfractionated G-PBMC compared with unfractionated control PBMC were due to differences in monocyte quantity rather than quality.
Production of IL-1α, IL-8, and TNF-α by purified control and G-PBMC monocytes. Purified monocytes were isolated as described in Materials and Methods and cultured at 0.5 × 10⁶/mL in flat-bottom 96-well plates in the presence or absence of LPS (1 μg/mL). Supernatants from triplicate cultures were harvested after 24 hours, pooled, and cytokine levels were determined by ELISA. (*) Indicates a P value < .05 compared with control.
Production of IL-1α, IL-8, and TNF-α by purified control and G-PBMC monocytes. Purified monocytes were isolated as described in Materials and Methods and cultured at 0.5 × 10⁶/mL in flat-bottom 96-well plates in the presence or absence of LPS (1 μg/mL). Supernatants from triplicate cultures were harvested after 24 hours, pooled, and cytokine levels were determined by ELISA. (*) Indicates a P value < .05 compared with control.
DISCUSSION
The present study identifies IL-10 as a monocyte-derived factor responsible for the suppression of T-cell proliferation and inflammatory cytokine production in G-PBMC. This finding extends our previous study that showed CD14+ monocytes in G-PBMC were able to suppress T-cell proliferation in a dose-dependent and largely contact-independent fashion.1 Sufficiently large numbers of monocytes from unmobilized blood were also suppressive indicating that monocyte-mediated suppression was mainly due to quantitative rather than qualitative differences. Therefore, the 50-fold increase in monocyte number, and increased ratio of monocytes to T cells in G-PBMC may explain the hyporesponsiveness of G-PBMC when tested in vitro.
Our interest in IL-10 as a potential factor causing proliferative hyporesponsiveness in G-PBMC was prompted by its known immunosuppressive effects and the fact that monocytes are a major source of this cytokine.14-18 IL-10 is also produced by activated T cells, B lymphocytes, and keratinocytes.18-20It has been shown to be suppressive for T-cell activation and proliferation by downregulating pivotal monocyte accessory functions such as costimulatory molecules B7-1 and B7-2, and HLA class II molecules.21-25 Furthermore, IL-10 is a potent inhibitor of Th1-cytokine production by T cells,19 but it also inhibits proinflammatory cytokine production by monocytes, potentially through autocrine mechanisms.15,16 Finally, IL-10 has been shown to have direct, accessory cell-independent, inhibitory effects on T-cell proliferation by interfering with IL-2 production,26,27 and it may induce long-lasting antigen-specific anergy in T cells.28 Taken together, IL-10 is a potent negative regulator of the immune response, including reactions to alloantigen.
In this report, we show that monocyte-suppression of OKT3-stimulated CD4 cell proliferation could be largely overcome by neutralizing the endogenously produced IL-10 (Fig 2). Further, neutralization of endogenous IL-10 in allogeneic MLC increased proliferative responsiveness of G-PBMC by approximately 50% without causing significant changes in proliferation when control PBMC were used (Figs3 and 4). This finding corresponded to approximately threefold higher IL-10 levels in LPS-stimulated supernatants from G-PBMC compared with control PBMC (Fig 6). However, proliferative hyporesponsiveness of G-PBMC was not completely reversible with IL-10 neutralization, suggesting that IL-10 was not exclusively responsible for suppression in MLC (Fig 3).
We also addressed the question as to whether G-CSF treatment might alter cytokine production by monocytes. Our data show that equal numbers of control and G-PBMC–derived monocytes produced comparable amounts of monokines IL-10, IL-1α, TNF-α, and IL-8 with LPS stimulation (Fig 6B and 7). Hence, the most plausible explanation for higher IL-10 levels in LPS-stimulated G-PBMC appears to be the large number of monocytes rather than differences in cytokine production on a cell-per-cell basis. However, baseline IL-10 mRNA levels by RT-PCR were fivefold higher (Fig 5) and there was also a trend for higher constitutive levels of IL-10, IL-1α, IL-8, and TNF-α in supernatants from isolated G-PBMC–derived CD14 cells compared with control CD14 cells. Therefore, CD14 cells in G-PBMC may have a lower stimulatory threshold for production and secretion of certain cytokines including IL-10.
Bacchetta et al29 reported high levels of IL-10 transcripts in non–T-cell subsets of PBMC from transplanted severe combined immunodeficiency (SCID) patients who had developed mixed chimerism compared with PBMC of normal controls. Another report described decreased PBMC IL-10 production in vitro by cells from patients who developed chronic GVHD after allogeneic marrow transplantation compared with cells from patients without this complication.30 Even though the overall clinical experience with IL-10 in the transplantation setting is very limited, these in vitro data suggest a possible role of IL-10 in dampening GVH reactions and maintaining in vivo tolerance.
When recipients of G-PBMC were compared with recipients of marrow, increased numbers of monocytes and monocyte progenitors transferred with G-PBMC products translated into increased monocyte counts during at least the first 2 months posttransplantation.31 A direct comparison of posttransplantation IL-10 serum levels between recipients of G-PBMC and marrow would be interesting but, to our knowledge, has not yet been performed.
Therapeutic strategies currently used to successfully prevent aGVHD show that immunosuppression needs to be present during the early phase of donor T-cell encounter with host-antigen. Therefore, it seems reasonable to speculate that large numbers of IL-10-producing monocytes transferred with a graft may lead to transient or even long-lasting dampening of alloreactivity. However, the outcome of patients receiving G-PBMC products regarding the development of chronic GVHD remains to be seen.
Taken together, our data suggest that monocytes in G-CSF–mobilized blood products can suppress T-cell responsiveness through production of IL-10. These findings might help to explain why the infusion of 10 times more T cells in G-PBMC compared with marrow does not increase the incidence or severity of aGVHD. They may also raise the question as to whether all CD34-enrichment strategies for T-cell depletion are a reasonable clinical approach, as they can be accompanied by a loss of monocytes.
ACKNOWLEDGMENT
We thank Dr Peter Kiener, Bristol-Myers Squibb, for technical support regarding counterflow centrifugal elutriation of monocytes and Dr William Bensinger, FHCRC, for providing the leukapheresis samples for the study.
Supported in part by Grants No. DK51417 and CA18221 from the National Institutes of Health, Department of Health and Human Services, Bethesda, MD.
Address reprint requests to Marco Mielcarek, MD, Fred Hutchinson Cancer Research Center, 1124 Columbia St, M-318, Seattle, WA 98104.
The publication costs of this article were defrayed in part by page charge payment. This article must therefore be hereby marked "advertisement" is accordance with 18 U.S.C. section 1734 solely to indicate this fact.

This feature is available to Subscribers Only
Sign In or Create an Account Close Modal