The MLL (ALL-1, HRX) gene is frequently involved in chromosomal translocations in acute leukemia and has homology with Drosophila trithorax, which controls homeobox gene expression and embryogenesis. To elucidate the function of Mll, we generated mice with a mutated Mll locus. Mice with a homozygous mutation were embryonic lethal and died at embryonic day 11.5 to 14.5, showing edematous bodies and petechiae. Histological examination revealed that hematopoietic cells were decreased in the liver of homozygous embryos, although they were composed of erythroid, myeloid, monocytic, and megakaryocytic cells with normal differentiation. Colony-forming assays using cells from fetal livers and yolk sacs showed that the number of colonies was markedly reduced and many of the colonies delayed to be recognized in Mllmu/mu embryos, although some of the colonies from Mllmu/mu embryos developed similarly with that from Mll+/+ and Mll+/mu embryos, suggesting the delayed onset of the proliferation of hematopoitic precursors. These data show that the hematopoietic precursors were greatly reduced in mutant mice, and suggest that Mll functions as a regulator of the growth of hematopoietic precursors.
MLL (ALL-1, HRX) is located on band q23 of chromosome 11 and involved in reciprocal translocations with at least 25 chromosomal loci.1-4 These translocations are frequently observed in acute leukemia, including acute lymphoblastic leukemia, acute myeloblastic leukemia, acute myelomonocytic leukemia, and acute monocytic leukemia, and the prognosis of these patients is poor.1 The breakpoints of 11q23 are concentrated in a restricted region of Mll, exon 8-14.5,6 Partial duplication and interstitial deletion of Mll have also been reported in acute leukemia.7 8
The Mll gene codes for a large protein, predicted to be 431 kD, that shows homology with Drosophila trithorax4,6,9 and is expressed in many organs and tissues including brain, cerebellum, cerebral cortex, spinal cord, colon, liver, fetal liver, spleen, thymus, tonsil, kidney, heart, thyroid gland, lung, testis, and skeletal muscle in humans.6,10 Trithorax has a zinc finger domain and is considered to have DNA-binding capacity.11,12In Drosophila, trithorax controls the expression of homeobox proteins and regulates embryogenesis.12,13 Mll also has an AT hook, the domain that has DNA-binding capacity. In addition, Mll has been shown to be localized in nuclei, supporting the idea that Mll is a DNA-binding protein.10,14 Further, CAT assay has shown Mll to have a domain for transcriptional activation, which is located 3′ of the translocation cluster region.15 The Mll region encompassing amino acids 2829-2883 is a minimal transactivation domain that showed 300- to 500-fold activation in GAL4/CAT assay. It was suggested that the loss of this domain is related to the leukemogenesis caused by chimeric proteins derived from chromosomal translocations involving Mll.16
The function of Mll was previously analyzed in knockout mice that were generated by disrupting exon 3B, which is located between the AT hook and trithorax motifs.17 It was shown that heterozygously mutated mice showed homeotic transformations during embryogenesis and hematological abnormalities including anemia and thrombocytopenia, and that Mll controlled homeobox expression. Further hematological abnormalities were investigated by colony-forming assay of yolk sacs in homozygously mutated embryos that died at embryonic day 10.5-11.5 (E10.5-11.5 ).18 These studies showed smaller numbers of colonies from homozygously mutated yolk sacs than from wild-type and heterozygous yolk sacs and demonstrated that colony-forming-unit granulocytes, erythroids, macrophages, megakaryocytes (CFU-GEMM), colony-forming unit-macrophages (CFU-M), and burst-forming unit-erythroids (BFU-E) were markedly decreased in homozygously mutated embryos.18 Another study using in vitro colony-forming assay showed that double Mll knockout embryonic stem (ES) cells formed a significantly greater number of hematopoietic colonies than normal ES cells and that these colonies consisted of immature hematopoietic cells.19 Further, chimeric mice carrying an Mll-AF9 fusion gene found in t(9,11) developed tumors that were restricted to acute myeloid leukemia.20 However, the function of Mll still remains to be clarified.
We generated mutant mice of Mll locus by replacing the region including exons 12-14 with PGK-neo to reveal the function of Mll. Because the major breakpoint cluster region of Mll is restricted to the genomic region of exon 8-14, 3′ of exon 14 should code a major function of Mll. Homozygously mutated mice died at E11.5-14.5. We discuss here the hematological abnormalities of homozygously mutated mice.
MATERIALS AND METHODS
Construction of the targeting vector.
We screened the 129/Sv mouse genomic library in the Lambda Fix II phage vector (Stratagene, La Jolla, CA) with an Mll cDNA fragment and obtained genomic fragments encompassing exons 11-16. After making a restriction map and performing sequencing, we disrupted the region including exons 12-14 by replacing it with a neomycin-resistant gene (neo) driven by a phosphoglycerol kinase (PGK) promoter.21 We inserted a 1.3-kbHindIII-HincII fragment 5′ of exon 12 and a 1.6-kb EcoRI-BglII fragment of the PGK-neo cassette into an Xba I site and an EcoRI-BamHI site of the pBluescript SK (Stratagene), respectively, in which the SspI fragment was replaced with the PGK-tk cassette as described.21 To obtain the final targeting vector, we inserted a 13.2-kb Kpn I fragment 3′ of exon 14 into anSal I-Kpn I site of pBluescript SK containing 5′ of exon 12, PGK-neo, and PGK-tk.
Generation of mutant mice.
The targeting vector was linealized by Not I digestion, electroporated into E14-1 ES cells (1 × 10⁷), and selected with G418 (0.4 mg/mL) and gancyclovir (2 μmol/L). Resistant colonies were selected, expanded, and screened for homologous recombination by Southern blot analysis. Screened ES cells heterozygous for the Mll mutation were injected into E3.5 blastocysts derived from C57BL/6J, and the blastocysts were transferred into the uteri of pseudo-pregnant ICR females. Chimeric mice were mated with C57BL/6J, and germline transmission was confirmed by Southern blot analysis. Brother-sister mating was then performed to generate homozygous mutants.
cDNA synthesis and polymerase chain reaction (PCR).
Total RNA was prepared from whole embryos and livers at E12.5 using LiCl/urea, and 1 μg of total RNA was reverse transcribed by Moloney murine leukemia virus-reverse transcriptase (GIBCO-BRL, Rockville, MD) in a 20-μL reaction volume, using random hexamers. PCR amplifications were performed with GeneAmp 2400 (Perkin-Elmer, Foster City, CA) and AmpliTaq DNA polymerase (Perkin-Elmer) in a 50-μL reaction volume, using 1 μL of cDNA solution and the following primers: Mll-5′, 5′-AGTGGATGCCTTCCAAAGCC-3′ and 5′-GAGACCTGCTTGCTGGACTT-3′; Mll-3′, 5′-CCAGCAGTGAGCATGTAGAG-3′, and 5′-TGAAGGCGGAAGCACTGCGT-3′. Twenty cycles of amplification were performed for the cDNA from livers (94°C for 30 seconds, 55 to 65°C for 30 seconds, 72°C for 30 seconds) using the following primers at the indicated annealing temperatures: Hoxa10, 5′-CTGGCCTCTGGCTCGACCGA-3′ and 5′-GTCCGTGAGGTGGACGCTAC-3′ at 58°C; Hoxb3, 5′-CCACCTACTACGACAACACC-3′ and 5′-TTGCCTCGACTCTTTCATCC-3′ at 55°C; Hoxa7, 5′-CAAAATGCCGAGCCGACTTC-3′ and 5′-CAGGGGTAGATGCGGAAACT-3′ at 58°C; Hoxa9 5′-GAGAATGAGAGCGGCGGAGA-3′ and 5′-AGACAGAAGGAGACGGACAG-3′ at 55°C; Hoxc4, 5′-CCACCACCACCCTGAGAAAT-3′ and 5′-TAACCTGGTGATGTCCTCTG-3′ at 56°C; erythropoietin receptor 5′-TCATGTAGCCTGCACCAGGCTCCC-3′ and 5′-GTTGCTCAGAACACACTCAGTGCG-3′ at 65°C; GATA1 5′-CATTGGCCCCTTGTGAGGCCAGAGA-3′ and 5′-ACCTGATGGAGCTTGAAATAGAGGC-3′ at 55°C. Amplified products were electrophoresed and blotted to HybondN+ (Amersham, Amersham Place, Bucks, UK). The membranes were hybridized with the probes generated by PCR amplification.
Hematological analysis.
The total number of leukocytes and total red blood cells of wild-type and heterozygous mice were determined at 4 weeks of age from blood samples obtained from the eyes. Embryonic blood samples were collected from the umbilical cord, cytocentrifuged on glass slides, and stained with May-Grünwald/Giemsa.
Histological analysis.
For histological analysis, formalin-fixed paraffin-embedded sections of embryos were stained with hematoxylin and eosin (HE) using standard techniques.
Methylcellulose colony-forming assay.
Fetal liver cells were obtained from E12.5 embryos and dissected by mechanical manipulation. Cells were suspended in α minimum essential medium (αMEM) (GIBCO-BRL), and the number of viable cells was examined by tripan-blue staining. A total of 3 × 10⁴cells were cultured with 20% fetal calf serum (FCS), 1.2% methylcellulose, 2-mercaptoethanol (100 μmol/L), and cytokines (human erythropoietin [hEPO] at a final concentration of 2 U/mL, human granulocyte colony-stimulating factor [hG-CSF] at 10 ng/mL, human interleukin-6 [hIL-6] at 100 ng/mL, mouse granulocyte-macrophage CSF [mGM-CSF] at 100 ng/mL, mouse stem cell factor [mSCF] at 100 ng/mL, and mouse IL-3 [mIL-3] at 500 U/mL). After incubation in a fully humidified atmosphere of 5% CO2 and 95% air at 37°C for 7 days or 14 days, colonies were counted under a microscope. Yolk sac cells were obtained from E10.5 embryos and dissected by mechanical manipulation. Cells were suspended in αMEM, and the number of viable cells was examined by tripan-blue staining. The cells were cultured under conditions described previously.22
Flow cytometric analysis.
Single-cell suspensions from fetal livers at E12.5 were prepared using phosphate-buffered saline (PBS) and 4% FCS. These suspensions were depleted of red blood cells using 0.14 mol/L NH4Cl in 17 mmol/L Tris (pH 7.3) before staining. Cells (5 × 10⁵) were incubated with fluorescein isothiocyanate (FITC)-conjugated anti–Gr-1 and phycoerythrin (PE)-conjugated anti-Mac1 (PharMingen, San Diego, CA) and analyzed using a FACScan (Becton Dickinson). Dead cells were excluded on the basis of propidium iodide uptake, and 10,000 events were acquired.
Northern blot analysis.
Total RNA was prepared from whole embryos and livers at E12.5. Ten micrograms of RNA was electrophoresed, blotted to HybondN+ (Amersham), and hybridized with a 32P-labeled 0.4-kb XbaI-PvuII fragment of mouse retinoblastoma gene. Filters were rehybridized with a 32P-labeled 0.85-kb fragment of mouse GAPDH.
Western blot analysis.
Whole fetal body lysate from E12.5 embryos was electrophoresed in 12% sodium dodecyl sulfate (SDS)-polyacrylamide gels, and the gels were transferred to Immobilon-P (Millipore, Bedford, MA) with a semi-dry blotting apparatus. After blocking the membrane with nonfat milk, the membranes were incubated with anti-cdk2, anti-cdk4, anti-cyclinD1, and anti-cyclinD3 antibodies (Transduction Laboratories Inc, Lexington, KY). For detection of the first antibodies, we used ECL Western blot analysis (Amersham).
In situ hybridization.
Riboprobes for in situ hybridization were prepared using a DIG RNA labeling kit (Boehringer Mannheim GmbH Biochemica, Mannheim, Germany) according to the manufacturer's instructions. For the Rb probe, a cDNA fragment was amplified by reverse transcriptase (RT)-PCR using primers 5′-ACTCTGGGGCATCTGCATCT-3′ and 5′-TCTTCTGGGTGTTCGAGGTG-3′, and inserted in the pBluescriptKS(−) (Stratagene). Hybridization was performed as discribed.23
Whole-mount immunohistochemistry.
Embryos were fixed in 4% paraformaldehyde and stored in methanol at −20°C. For staining, embryos were incubated about 30 minutes with methanol containing 50% dimethyl sulfoxide (DMSO), and washed by methanol containing 50% DMSO and 2% Triton X-100. The embryos were blocked for 10 minutes by 1% periodate, and washed by Tris buffer saline (pH 7.4). The embryos were blocked one overnight by 5% nonfat milk, and stained overnight by F4/80 rat anti-mouse macrophage antibody (ICN/Cappel, Costa Mesa, CA). The embryos were washed for 6 hours and incubated in peroxidase-conjugated anti-rat IgG second antibody (Cedarlane, Ontario, Canada). The embryos were washed for 6 hours and detected using 0.1 mg/mL diaminobenzidine for 1 hour, followed by 20 minutes' exposure to the same diaminobenzidine solution containing 0.03% hydrogen peroxidase. The developed embryos were stocked in 2:1 benzylbenzoate:benzylalcohol.
RESULTS
Generation of mutant mice of Mll locus.
The Mll gene, which spans 100 kb and contains at least 37 exons, has an AT-hook, methyltransferase homology region, zinc finger domain, and two trithorax homology regions. At the 11q23 translocation, Mll has a break cluster region that is located at exons 8-14. Because we considered the function of Mll to be dependent on the 3′ of exon 14, we constructed a targeting vector in which the region containing exons 12-14 was replaced with PGK-neo (Fig 1A). The targeting vector was electroporated into an E14 line of ES cells and selected by G418 and gancyclovir. Targeted ES cells were injected into blastocysts of C57BL/6J mice. The chimeras were mated with C57BL/6J mice, and the Mll mutation was transmitted through the germline.
Targeted disruption of Mll. (A) Restriction map of wild-type allele (a), targeting vector (b), and mutant allele (c). Exons, PGK-neo, and PGK-tk are depicted as closed boxes. Exons are numbered according to human MLL exons previously reported.40 Arrows indicate the transcriptional direction of PGK-neo. H, HindIII; Hc, HincII; K, Kpn I; RV, EcoRV; X, Xho I. (B) Southern blot analysis of fetal DNA. Genomic DNA isolated from embryos was digested withEcoRV and hybridized with the probe shown in (A). Bands are indicated corresponding to wild-type (12.5 kb) and mutant (3.5 kb) genes. Wild-type (+/+), heterozygous (+/mu), and homozygous (mu/mu) genotypes are shown. (C) RT-PCR analysis of Mll transcripts from F2 fetus. The primers of Mll-5′ and Mll-3′ are indicated by arrows in (D). The numbers of exons are shown in boxes. Deleted exons are depicted as shaded boxes.
Targeted disruption of Mll. (A) Restriction map of wild-type allele (a), targeting vector (b), and mutant allele (c). Exons, PGK-neo, and PGK-tk are depicted as closed boxes. Exons are numbered according to human MLL exons previously reported.40 Arrows indicate the transcriptional direction of PGK-neo. H, HindIII; Hc, HincII; K, Kpn I; RV, EcoRV; X, Xho I. (B) Southern blot analysis of fetal DNA. Genomic DNA isolated from embryos was digested withEcoRV and hybridized with the probe shown in (A). Bands are indicated corresponding to wild-type (12.5 kb) and mutant (3.5 kb) genes. Wild-type (+/+), heterozygous (+/mu), and homozygous (mu/mu) genotypes are shown. (C) RT-PCR analysis of Mll transcripts from F2 fetus. The primers of Mll-5′ and Mll-3′ are indicated by arrows in (D). The numbers of exons are shown in boxes. Deleted exons are depicted as shaded boxes.
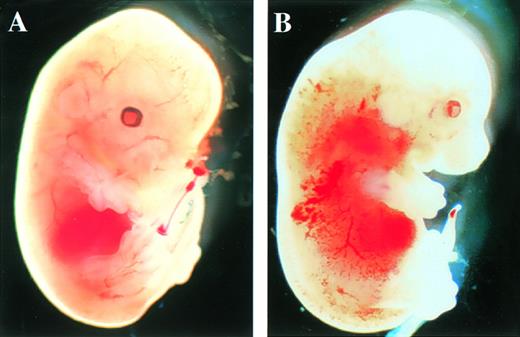
After the intercrossing of heterozygous mice, the genotypes of their litters were examined at 4 weeks of age by Southern blot analysis (Fig1B), and no homozygous mice were found. Because we did not observe the death of mice until 4 weeks of age, homozygous mice seemed to be lethal during gestation. To determine when embryonic lethality occurred, we analyzed embryos at various stages of gestation (Table 1). At E14.5, we observed no live homozygous embryos. At E12.5, some of the homozygous embryos were dead, as ascertained by the absence of heartbeat at the time of dissection. Therefore, we concluded that homozygous embryos died at E11.5-14.5. The appearance of homozygous embryos at E12.5-13.5 was edematous, with bleeding apparent under the skin (Fig 2).
Genotypes of the Various Stages of Gestation
| . | n . | +/+ . | +/mu . | mu/mu . |
|---|---|---|---|---|
| E10.5 | 20 | 7 | 9 | 4 |
| E11.5 | 56 | 16 | 25 | 15 |
| E12.5 | 373 | 99 | 202 | 72 |
| E13.5 | 55 | 12 | 36 | 7 |
| E14.5 | 25 | 6 | 19 | 0 |
| E18.5 | 17 | 5 | 12 | 0 |
| Newborn | 18 | 7 | 11 | 0 |
| 4 wks | 139 | 55 | 84 | 0 |
| . | n . | +/+ . | +/mu . | mu/mu . |
|---|---|---|---|---|
| E10.5 | 20 | 7 | 9 | 4 |
| E11.5 | 56 | 16 | 25 | 15 |
| E12.5 | 373 | 99 | 202 | 72 |
| E13.5 | 55 | 12 | 36 | 7 |
| E14.5 | 25 | 6 | 19 | 0 |
| E18.5 | 17 | 5 | 12 | 0 |
| Newborn | 18 | 7 | 11 | 0 |
| 4 wks | 139 | 55 | 84 | 0 |
Genotypes were examined by Southern blot analysis using the probe shown in Fig 1. None of the data include resorbed or dead embryos. The morning on which a vaginal plug was identified was counted as day 0.5 of gestation.
Appearance of embryos at E13.5. (A) Wild-type littermate. (B) Appearance of the homozygous Mll embryo. Subcutaneous edema and hemorrhage are seen.
Appearance of embryos at E13.5. (A) Wild-type littermate. (B) Appearance of the homozygous Mll embryo. Subcutaneous edema and hemorrhage are seen.
We determined by RT-PCR whether the region of exons 12-14 was deleted in homozygous (Mllmu/mu) embryos (Fig 1C and D). We detected the transcript of 5′ of exon 8, where methyltransferase is located, in Mllmu/mu embryos as well as in wild-type (Mll+/+) and heterozygous (Mll+/mu) embryos. However, we did not detect the transcript of 3′ of exon 11 in Mllmu/mu embryos except for two aberrant transcripts, which were found to be out of frame from our examination of the sequences (data not shown).
Hematological abnormalities in heterozygous mice.
The numbers of red blood cells and white blood cells in the peripheral blood of Mll+/+ and Mll+/mu littermates were examined at 6 weeks of age (Table 2). The Mll+/mu mice had mild anemia compared with Mll+/+ littermates. However, the number of white blood cells of Mll+/mu mice was not significantly different from Mll+/+ littermates.
Average Number of Peripheral Blood Cells
| . | n . | WBC/μL . | RBC × 106/μL . |
|---|---|---|---|
| +/+ | 24 | 6,725 ± 1,745 | 5.40 ± 1.22 |
| +/mu | 36 | 5,915 ± 2,294 | 4.82 ± 1.28 |
| . | n . | WBC/μL . | RBC × 106/μL . |
|---|---|---|---|
| +/+ | 24 | 6,725 ± 1,745 | 5.40 ± 1.22 |
| +/mu | 36 | 5,915 ± 2,294 | 4.82 ± 1.28 |
Peripheral blood was obtained from Mll+/+ and Mll+/mu mice at 6 weeks of age. Red blood cells were significantly fewer in Mll+/mu mice than in Mll+/+ mice (P < .05). Statistical significance was calculated using Student's t-test.
Abbreviations: RBC, red blood cells; WBC, white blood cells.
Histological examination of fetal livers.
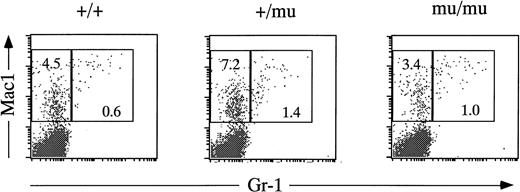
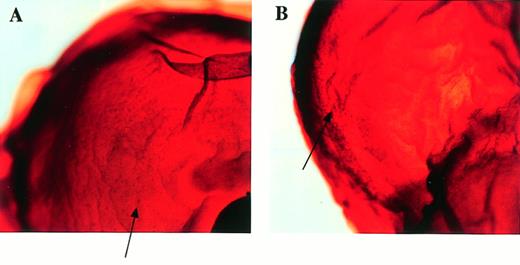
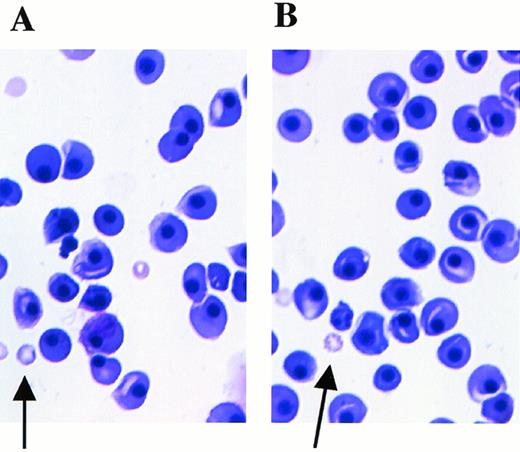
Fetal livers from Mll+/+, Mll+/mu, and Mllmu/mu littermates at E11.5 and E12.5 were examined histologically. Fetal liver cells, particularly hematopoietic cells, were slightly reduced in Mllmu/mu embryos compared with those in Mll+/+ and Mll+/mu littermates at E11.5 (Fig 3A and B). The decrease in hematopoietic cells was prominent in the livers of Mllmu/muembryos compared with those of Mll+/+ and Mll+/mu littermates at E12.5 (Fig 3C through F). In addition, the total number of cells in Mllmu/mu fetal livers was decreased at E12.5 in comparison with those of Mll+/+ and Mll+/mu littermates (Table 3). However, the appearance of fetal liver cells was similar among Mll+/+, Mll+/mu, and Mllmu/mu littermates in the liver stamp specimens stained with May-Grünwald/Giemsa. Erythroid, myeloid, and monocytic cells were present at various stages of differentiation in Mll+/+, Mll+/mu, and Mllmu/mu fetal livers (Fig 4A through D, Table 4). Megakaryocytes were also present in Mllmu/mu fetal livers (Fig 4E and F, Table 4). The presence of granulocytes and monocytes in Mllmu/mu fetal livers was also confirmed by fluorescence-activated cell sorter (FACS) analysis using anti-Mac1 and anti-Gr1 antibodies (Fig 5). We also confirmed the presence of macrophages in tissues of Mllmu/mu embryos by immunohistochemistry using the antimacrophage antibody F4/80 (Fig 6, see page 110). Further, we analyzed the components of peripheral blood at E12.5 and found mostly nucleated red blood cells, with few leukocytes and a few anucleated red blood cells derived from definitive erythropoiesis in fetal liver. These findings were similar among Mll+/+, Mll+/mu, and Mllmu/mu embryos (Fig 7, see page 115).
Histological examination of fetal livers. (A and B) Sections of fetal liver at E11.5 stained with HE (original magnification [OM] × 200). Hematopoietic cells in Mllmu/mu fetal liver were slightly decreased. (C through F) Sections of fetal liver at E12.5 stained with HE (OM × 100). The decrease of hematopoietic cells in Mllmu/mu was prominent. (A, C, and E) Mll+/+; (B, D, and F) Mllmu/mu.
Histological examination of fetal livers. (A and B) Sections of fetal liver at E11.5 stained with HE (original magnification [OM] × 200). Hematopoietic cells in Mllmu/mu fetal liver were slightly decreased. (C through F) Sections of fetal liver at E12.5 stained with HE (OM × 100). The decrease of hematopoietic cells in Mllmu/mu was prominent. (A, C, and E) Mll+/+; (B, D, and F) Mllmu/mu.
Average Number of Fetal Liver Cells at E12.5
| +/+ . | +/mu . | mu/mu . |
|---|---|---|
| n = 20 | n = 39 | n = 10 |
| 148 ± 86 | 133 ± 79 | 75 ± 36 |
| +/+ . | +/mu . | mu/mu . |
|---|---|---|
| n = 20 | n = 39 | n = 10 |
| 148 ± 86 | 133 ± 79 | 75 ± 36 |
Fetal liver cells were significantly fewer in Mllmu/muthan in Mll+/+ and Mll+/mu(P < .01). Statistical significance was calculated using Student's t-test.
Stamp specimens of fetal livers at E12.5 stained with May-Grünwald/Giemsa. (A and B) Arrows indicate granulocytes. (C and D) Arrows indicate monocytic cells. (E and F) Arrows indicate megakaryocytes. OM × 200. (A and E) Mll+/mu; (C) Mll+/+; (B, D, and F) Mllmu/mu.
Stamp specimens of fetal livers at E12.5 stained with May-Grünwald/Giemsa. (A and B) Arrows indicate granulocytes. (C and D) Arrows indicate monocytic cells. (E and F) Arrows indicate megakaryocytes. OM × 200. (A and E) Mll+/mu; (C) Mll+/+; (B, D, and F) Mllmu/mu.
Differentiation of Hematopoietic Cells in Fetal Livers
| . | Immature Myeloid Cell . | Granulocyte . | Monocyte . | Erythroblast . | Megakaryocyte . |
|---|---|---|---|---|---|
| +/+ | 3.8 | 0.8 | 0.0 | 95.2 | 0.2 |
| +/mu | 4.9 | 0.4 | 0.4 | 94.2 | 0.0 |
| +/mu | 2.9 | 0.5 | 0.5 | 95.9 | 0.2 |
| +/mu | 3.0 | 0.5 | 0.1 | 96.2 | 0.1 |
| mu/mu | 5.2 | 0.5 | 0.5 | 93.8 | 0.0 |
| mu/mu | 2.9 | 1.1 | 1.1 | 94.9 | 0.0 |
| mu/mu | 1.8 | 0.4 | 0.2 | 97.3 | 0.2 |
The number of cells were counted depending on their morphology using stamp specimen at E12.5. The numbers are indicated as the percentage of total hematopoietic cells counted. About 700 cells were counted in each sample.
Abbreviations: +/+, Mll+/+; +/mu, Mll+/mu; mu/mu, Mllmu/mu.
FACS analysis of fetal liver cells at E12.5. Fetal liver cells are stained by anti–Gr-1 and anti-Mac1 antibodies. Numbers in rectangles indicate percentages of Mac1+Gr-1− cells and Mac1+Gr-1+ cells.
FACS analysis of fetal liver cells at E12.5. Fetal liver cells are stained by anti–Gr-1 and anti-Mac1 antibodies. Numbers in rectangles indicate percentages of Mac1+Gr-1− cells and Mac1+Gr-1+ cells.
Detection of macrophages in Mllmu/mu embryos by whole-mount immunohistochemistry using antimacrophage antibody F4/80. The heads of embryos at E12.5 are magnified (OM × 80). There are many F4/80+ cells (arrows). (A) Mll+/mu; (B) Mllmu/mu.
Detection of macrophages in Mllmu/mu embryos by whole-mount immunohistochemistry using antimacrophage antibody F4/80. The heads of embryos at E12.5 are magnified (OM × 80). There are many F4/80+ cells (arrows). (A) Mll+/mu; (B) Mllmu/mu.
Peripheral blood smears at E12.5 stained with May-Grünwald/Giemsa. Arrows indicate anucleated red blood cells derived from definitive hematopoiesis. (A) Mll+/mu; (B) Mllmu/mu.
Peripheral blood smears at E12.5 stained with May-Grünwald/Giemsa. Arrows indicate anucleated red blood cells derived from definitive hematopoiesis. (A) Mll+/mu; (B) Mllmu/mu.
Colony-forming assays of fetal livers and yolk sacs.
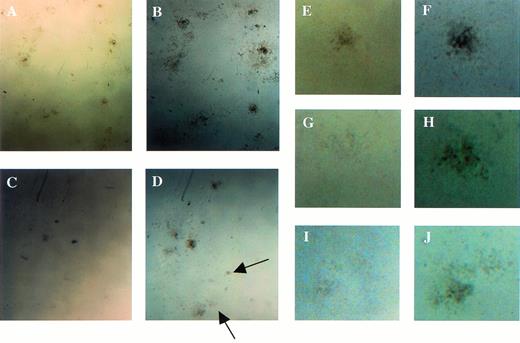
To investigate the reason for the decrease in hematopoietic cells in the livers of Mllmu/mu embryos, we performed a colony-forming assay using E12.5 livers. Colonies were counted under a microscope after 7 and 14 days of culture. After 7 days of culture, the average number of hematopoietic colonies per 3 × 10⁴liver cells of Mllmu/mu embryos was about one fifth that of Mll+/+ and Mll+/mu embryos (Fig 8A), although the number of colonies from Mllmu/mu liver cells was increased after 14 days of culture (Fig 8B). As the number of liver cells in Mllmu/muembryos was about half of that in Mll+/+ and Mll+/mu embryos, the number of colonies per liver from Mllmu/mu embryos was much less than that from Mll+/+ and Mll+/mu embryos even after 14 days of culture. The colonies were smaller and fewer than those of Mll+/+ and Mll+/mu embryos at 7th day of culture, and many small colonies had appeared at 14th day of culture in Mllmu/mu embryos. It was contrary to the observation in Mll+/+ and Mll+/mu embryos at 14th day of culture, in which most colonies were large (Fig 9, see page 115). Further, we performed the colony-forming assay using cells from fetal liver at E13.0 and assessed colonies morphologically (Table 5). The number of colonies in Mllmu/mu livers was less than one tenth of that in Mll+/+ and Mll+/mu livers even after 14 days of culture. Therefore, the colonies of every lineage were decreased, although the decrease of GM colonies was most prominent. In addition, we performed a colony-forming assay using cells from yolk sacs at E10.5. The number of colonies per yolk sac in Mllmu/muembryos was less than one fifth that of Mll+/+ and Mll+/mu embryos after 7 days of culture (Fig 8C). Prolonged culture for an additional 7 days also increased the number of colonies from Mllmu/mu embryos, but the number was still less than that from Mll+/+ embryos (Fig 8D).
Colony-forming assay of fetal livers and yolk sacs. (A) Colony-forming assay of 3 × 10⁴ fetal liver cells of Mll+/+, Mll+/mu, and Mllmu/muembryos at E12.5. The number of colonies of Mll+/+ (n = 13), Mll+/mu (n = 26), and Mllmu/mu (n = 7) after 7 days of culture is shown. (B) Colony-forming assay of 3 × 10⁴ fetal liver cells of Mll+/+, Mll+/mu, and Mllmu/mu embryos at E12.5. The number of colonies of Mll+/+ (n = 8), Mll+/mu (n = 22), and Mllmu/mu (n = 5) after 14 days of culture is shown. (C) Colony-forming assay of yolk sac of Mll+/+, Mll+/mu, and Mllmu/mu embryos at E 10.5. The number of colonies of Mll+/+ (n = 8), Mll+/mu (n = 8), and Mllmu/mu (n = 5) after 7 days of culture is shown. (D) Colony-forming assay of yolk sac of Mll+/+, Mll+/mu, and Mllmu/mu embryos at E 10.5. The number of colonies of Mll+/+ (n = 8), Mll+/mu (n = 8), and Mllmu/mu (n = 5) after 14 days of culture is shown. n, number of embryos analyzed. Bars indicate standard deviations, and (▪) indicates the average of the number of colonies. Statistically significant difference at #$<.001, ♠⧫+<.01, *<.05. Statistical analysis was performed by Student's t-test and Welch's t-test.
Colony-forming assay of fetal livers and yolk sacs. (A) Colony-forming assay of 3 × 10⁴ fetal liver cells of Mll+/+, Mll+/mu, and Mllmu/muembryos at E12.5. The number of colonies of Mll+/+ (n = 13), Mll+/mu (n = 26), and Mllmu/mu (n = 7) after 7 days of culture is shown. (B) Colony-forming assay of 3 × 10⁴ fetal liver cells of Mll+/+, Mll+/mu, and Mllmu/mu embryos at E12.5. The number of colonies of Mll+/+ (n = 8), Mll+/mu (n = 22), and Mllmu/mu (n = 5) after 14 days of culture is shown. (C) Colony-forming assay of yolk sac of Mll+/+, Mll+/mu, and Mllmu/mu embryos at E 10.5. The number of colonies of Mll+/+ (n = 8), Mll+/mu (n = 8), and Mllmu/mu (n = 5) after 7 days of culture is shown. (D) Colony-forming assay of yolk sac of Mll+/+, Mll+/mu, and Mllmu/mu embryos at E 10.5. The number of colonies of Mll+/+ (n = 8), Mll+/mu (n = 8), and Mllmu/mu (n = 5) after 14 days of culture is shown. n, number of embryos analyzed. Bars indicate standard deviations, and (▪) indicates the average of the number of colonies. Statistically significant difference at #$<.001, ♠⧫+<.01, *<.05. Statistical analysis was performed by Student's t-test and Welch's t-test.
Examination of colonies derived from the colony-forming assays using fetal liver cells at E12.5. (A, C, E, G, and I) The appearance of the colonies at the 7th and (B, D, F, H, and J) at 14th days of culture. Arrows indicate small colonies that had appeared at 14th day of culture in Mllmu/mu. (E through J) Magnified views of single colony. (A, B, E, and F) Mll+/+; (C, D, G, H, I, andJ) Mllmu/mu.
Examination of colonies derived from the colony-forming assays using fetal liver cells at E12.5. (A, C, E, G, and I) The appearance of the colonies at the 7th and (B, D, F, H, and J) at 14th days of culture. Arrows indicate small colonies that had appeared at 14th day of culture in Mllmu/mu. (E through J) Magnified views of single colony. (A, B, E, and F) Mll+/+; (C, D, G, H, I, andJ) Mllmu/mu.
Colony-Forming Assay Using Fetal Liver Cells at E13.0
| . | n . | Total . | E . | Mix . | GM . |
|---|---|---|---|---|---|
| A. | |||||
| +/+ | 1 | 4,984 | 336 | 280 | 4,368 |
| +/mu | 3 | 2,514 ± 787∥ | 276 ± 43‡ | 69 ± 38¶ | 2,184 ± 752# |
| mu/mu | 3 | 148 ± 47∥ | 66 ± 51‡ | 16 ± 15¶ | 66 ± 13# |
| B. | |||||
| +/+ | 1 | 8,400 | 1,960 | 168 | 6,384 |
| +/mu | 3 | 5,640 ± 650* | 1,228 ± 247§ | 86 ± 76 | 4,635 ± 387† |
| mu/mu | 3 | 543 ± 250* | 214 ± 175§ | 16 ± 17 | 313 ± 64† |
(A) Numbers of colonies per total liver at 7th day of culture. (B) Numbers of colonies per total liver at 14th day of culture.
Abbreviations: E, erythroid colony; Mix, mixed colony; GM, granulocyte-macrophage colony; n, number of embryos analyzed; +/+, Mll+/+; +/mu, Mll+/mu; mu/mu, Mllmu/mu.
Statistically significant difference at *†<.001; ‡§<.01; ∥¶#<.05. Statistical analysis was performed by Student'st-test and Welch's t-test.
Analysis of Hox gene family expression and erythroid hematopoietic markers.
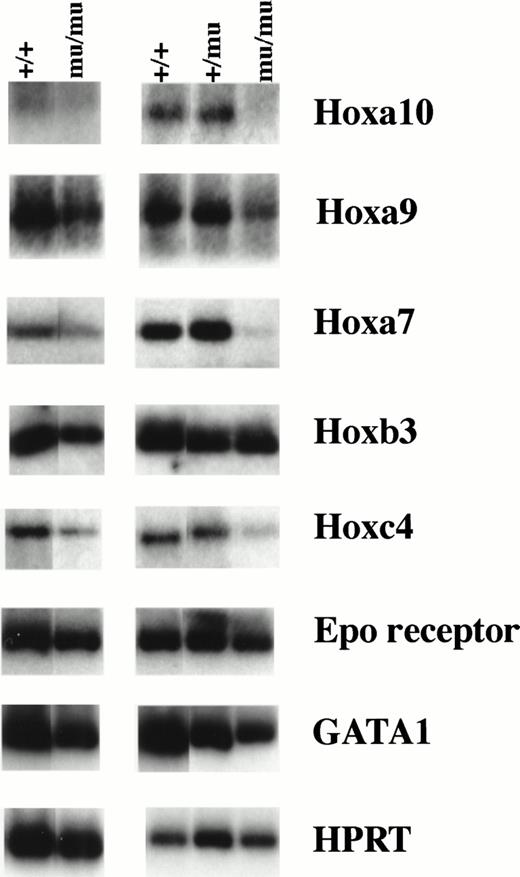
We investigated the expression of the Hox gene family including Hoxa9, Hoxa10, Hoxa7, Hoxb3, Hoxb4, Hoxb6, Hoxb8, Hoxc4, Hoxc9, and Hoxb5. RT-PCR using RNA from whole embryos at E12.5 showed similar Hox gene expression among Mll+/+, Mll+/mu, and Mllmu/mu embryos except for Hoxa7 and Hoxc9 (data not shown). Hoxa7 and Hoxc9 expression was lower in Mllmu/muembryos than in Mll+/mu and Mll+/+ embryos. We also examined Hox gene expression using RNA from fetal livers at E12.5 (Fig 10). The expression of Hoxa9, Hoxa10, and Hoxa7 was decreased in Mllmu/mu fetal livers as compared with Mll+/+ and Mll+/mu fetal livers. We detected similar expression of Hoxb3, very low expression of Hoxb5, Hoxb8, and Hoxb6, and no expression of Hoxc9 and Hoxb4 in all Mll+/+, Mll+/mu, and Mllmu/mu fetal livers. Hoxc4 expression varied among Mllmu/mu fetal livers. We also examined the expression of Epo receptor (Epo-R) and GATA1. The expression of Epo-R and GATA1 was lower in Mllmu/mu fetal livers than in Mll+/+ and Mll+/mu fetal livers (Fig 10). This finding is consistent with the observation that hematopoietic cells were greatly reduced in Mllmu/mu embryos compared with those in Mll+/+and Mll+/mu littermates. However, the reduction of Hoxa9, Hoxa10, and Hoxa7 expression in Mllmu/mu fetal livers was more significant than that of Epo-R and GATA1.
RT-PCR analysis of Hox genes and hematopoietic markers. RNA was extracted from fetal livers at E12.5. Results from two independent experiments are shown. +/+,Mll+/+; +/mu, Mll+/mu; mu/mu, Mllmu/mu.
RT-PCR analysis of Hox genes and hematopoietic markers. RNA was extracted from fetal livers at E12.5. Results from two independent experiments are shown. +/+,Mll+/+; +/mu, Mll+/mu; mu/mu, Mllmu/mu.
Analysis of expression of cell-cycle–related genes.
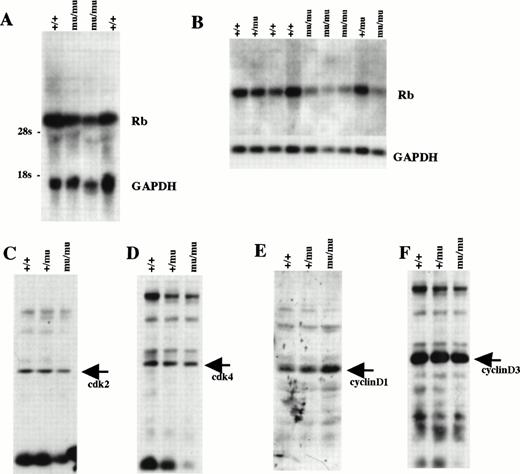
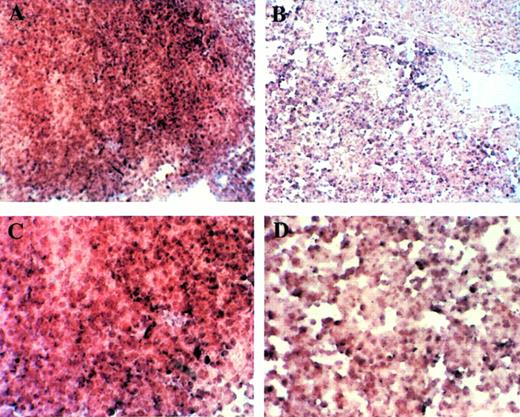
We examined Rb expression by Northern blot analysis using whole-body samples from E12.5 (Fig 11A). Rb expression seemed to be lower in Mllmu/mu embryos than in Mll+/+ embryos. The reduced expression of Rb in Mllmu/mu embryos was more evident when it was examined using RNA from fetal livers at E12.5 (Fig 11B). Further, the expression of cdk2, cdk4, cyclinD1, and cyclinD3 was examined by Western blot analysis using lysate from whole bodies at E12.5 (Fig 11C through F). Their expression was similar among Mll+/+, Mll+/mu, and Mllmu/mu embryos. Further, we examined Rb expression in fetal liver by in situ hybridization. The Rb expression was detected in the hematopoietic cells of Mllmu/mu fetal livers as well as Mll+/+ fetal livers (Fig 12).
Cell-cycle–related gene expression. (A) Northern blot analysis of Rb using RNA from whole embryos at E12.5. (B) Northern blot analysis of Rb using RNA from fetal livers at E12.5. (C) Western blot analysis of cdk2 using whole-body lysate at E12.5. (D) Western blot analysis of cdk4 using whole-body lysate at E12.5. (E) Western blot analysis of cyclinD1 using whole-body lysate at E12.5. (F) Western blot analysis of cyclinD3 using whole-body lysate at E12.5. +/+, Mll+/+; +/mu, Mll+/mu; mu/mu, Mllmu/mu.
Cell-cycle–related gene expression. (A) Northern blot analysis of Rb using RNA from whole embryos at E12.5. (B) Northern blot analysis of Rb using RNA from fetal livers at E12.5. (C) Western blot analysis of cdk2 using whole-body lysate at E12.5. (D) Western blot analysis of cdk4 using whole-body lysate at E12.5. (E) Western blot analysis of cyclinD1 using whole-body lysate at E12.5. (F) Western blot analysis of cyclinD3 using whole-body lysate at E12.5. +/+, Mll+/+; +/mu, Mll+/mu; mu/mu, Mllmu/mu.
Examination of Rb expression in fetal liver at E12.5 by in situ hybridization. Rb expression was detected in hematopoietic cells of Mllmu/mu livers as well as Mll+/+livers. (A and B) OM × 100. (C and D) OM × 200. (A and C) Mll+/+; (B and D) Mllmu/mu.
Examination of Rb expression in fetal liver at E12.5 by in situ hybridization. Rb expression was detected in hematopoietic cells of Mllmu/mu livers as well as Mll+/+livers. (A and B) OM × 100. (C and D) OM × 200. (A and C) Mll+/+; (B and D) Mllmu/mu.
DISCUSSION
We generated mutant mice of Mll locus and studied their hematopoiesis. The Mllmu/mu mice were embryonic lethal at E11.5-14.5, although previous studies of Mll knockout mice found embryonic lethality at E10.5.17 It is likely that the difference in time of lethality was caused by a difference in the construction of the targeting vectors, because exons 12-14 were deleted in our targeting vector and exon 3b was deleted in the targeting vector previously reported.17 It was recently reported that the N-terminus of Mll protein is suspected to function in directing the Mll protein to its target genes.24 Therefore, it may be that our Mllmu/mu mice produced a truncated Mll protein coded by the 5′ of exon 12 and still retained some functions of Mll, although our repeated experiments to detect a truncated Mll protein have been unsuccessful.
At E12.5-13.5, Mllmu/mu embryos appeared edematous and had subcutaneous petechiae, although histological study did not show any abnormalities in the heart or blood vessels of Mllmu/muembryos. Further, the petechiae would not have been caused by thrombocytopenia because NF-E2 knockout mice that lacked platelets were not embryonic lethal and the embryos did not show hemorrhage.25 Details of the edema and homeotic transformations of Mllmu/mu mice will be reported in a separate paper (H.Y. and T.K., manuscript in preparation).
Histological examination of the livers showed that hematopoietic cells in Mllmu/mu embryos were markedly reduced but were composed of erythroid, myeloid, and monocytic cells with normal differentiation. There were also a few megakaryocytes in Mllmu/mu fetal livers. The presence of monocytes and granulocytes in Mllmu/mu fetal livers was also confirmed by FACS analysis. In addition, macrophages in the tissues of Mllmu/mu embryos were detected by immunohistochemistry using anti-mouse macrophge antibody F4/80. Therefore, all lineages in hematopoietic cells without a skewing to primitive hematopoietic cells were observed in Mllmu/mu embryos.
By colony-forming assays using fetal livers as well as yolk sacs, we observed a marked reduction of hematopoietic precursors and a delayed colony formation in Mllmu/mu embryos. The difference of the number of hematopoietic precursors between Mllmu/mu embryos and their counterparts seemed to be increasing during development, because the difference of colony formation was most prominent when we used embryos at E13 although these embryos were not deteriorated. Some colonies from Mllmu/mu embryos were similar in size with those from Mll+/+ and Mll+/mu embryos at 7th and 14th day of culture. However, many colonies that were not visible at 7th day of culture were recognized at 14th day of culture in the assay using Mllmu/mu embryos. Therefore, the delayed colony formation observed in Mllmu/mu embryos is likely to be caused by a delay in the onset of the proliferation of hematopoietic precursors. We did not observe evident abnormalities in the distribution of the lineages of hematopoietic cells such as colonies with primitive hematopoietic cells. However, the disturbance of differentiation into specific lineages has not been excluded despite the nearly normal differentiation of hematopoietic cells observed in Mllmu/mu livers, because GM colony formation seemed to be severely reduced (Table 5). This observation is consistent with the previous study which showed a lineage-specific decrease in CFU-GEMM and CFU-M.18 They also found that Mll−/− colonies were fewer in number, took longer to develop, and contained fewer cells than their wild-type and heterozygous counterparts.18 These findings are also similar to our results of colony assay using fetal livers and yolk sacs. Thus, the data from histological analysis of fetal livers and colony formation assays showed that hematopoietic precursors were greatly decreased and the growth of hematopoietic cells, especially hematopoietic precursors, was disturbed in Mllmu/muembryos, implicating the role of Mll in the growth regulation of hematopoietic precursors. However, RT-PCR analysis did not show much difference in the expression of receptors for hematopoietic growth factors including Epo-R, gp-130, common β receptor, and c-fms(M-CSF receptor) among Mll+/+, Mll+/mu, and Mllmu/mu embryos, indicating that these hematopoietic growth factors are not responsible for the hematological abnormalities.
We investigated the expression of the Hox gene family including Hoxa9, Hoxa10, Hoxa7, Hoxb3, Hoxb4, Hoxb6, Hoxb8, Hoxc4, Hoxc9, and Hoxb5, because Mll has homology with the Drosophila trithorax, which has a zinc finger domain and controls the expression of homeobox genes during the embryogenesis of Drosophila.13 The expression of some of these genes has been reported in normal hematopoietic cells as well as malignant hematopoietic cells.26-28 Hoxa9 is concerned with leukemogenesis in humans,29 and Hoxa9-deficient mice showed hematological abnormalities similar to those of Mllmu/mumice.30 Antisense oligomers of Hoxb3, Hoxb4, Hoxb5, and Hoxb6 reduced colony formation of the hematopoietic cells.31 The overexpression of Hoxb4 especially influenced hematopoiesis, and Hoxb4 was suggested to regulate early hematopoietic proliferation.32,33 The induction by retrovirus of Hoxb6 expression in mouse bone marrow cells resulted in immortality of the infected cells.34 Further, the overexpression of Hoxb3 in hematopoietic cells blocked differentiation to B-lymphoid cells, influenced T-cell development, and induced granulopoiesis.35 We also examined Hoxc9 and Hoxa7 expression because it has been reported that these genes are not expressed in Mll-deficient embryos.17 Apart from Hoxc9 and Hoxa7, we detected similar Hox gene expression among Mll+/+, Mll+/mu, and Mllmu/muembryos when we used RNA from total embryos. The expression of Hoxc9 and Hoxa7 was detectable not only by RT-PCR analysis but also by whole mount in-situ hybridization in E12.5 Mllmu/mu embryos (data not shown), although their expression levels were decreased in Mllmu/mu embryos. When we used RNA from livers at E12.5, we detected reduced Hoxa9, Hoxa10, and Hoxa7 expression by RT-PCR. These Hox genes may be the candidates responsible for the growth retardation of hematopoietic cells in Mllmu/mu embryos, because our RT-PCR study detected more significant reductions in the expression of Hoxa9, Hoxa10, and Hoxa7 than in the expression of Epo-R and GATA1 in Mllmu/mu fetal livers. However, the possibility still exists that other cell types than hematopoietic cells caused the reduction of these Hox genes.
We also analyzed the expression of genes that control the cell cycle, because the phenotype of Rb-deficient mice was similar to that of Mllmu/mu mice and both showed retarded growth of hematopoietic cells.36-38 In vitro examination using the antisense oligomer of Rb showed that Rb is concerned with erythroid differentiation.39 Rb expression was lower in Mllmu/mu embryos than in Mll+/+ embryos, especially when we used samples from fetal liver. Therefore, we investigated Rb expression in the fetal liver by in situ hybridization. We detected Rb expression in hematopoietic cells of Mllmu/mu fetal livers as well as Mll+/+ fetal livers. Thus, we consider that the reduction of Rb expression in Mllmu/mu fetal livers observed by Northern blot analysis is caused by the decrease of hematopoietic cells in Mllmu/mufetal livers. We also examined other cell-cycle–related proteins, including cyclinD1, cyclinD3, cdk2, and cdk4 that regulate cell cycle at the point G1 to S state, but they were expressed similarly among Mll+/+, Mll+/mu, and Mllmu/muembryos.
We analyzed the hematological abnormalities of the mutant mice of Mll locus. Our data suggested that Mll functions in the control of the growth of hematopoietic progenitors. Although we observed the decreased expression of HoxA cluster genes in Mllmu/mu livers, the mechanism which causes the growth disturbance of hematopoietic cells remains to be clarified. Indeed, further investigation will be needed to elucidate the mechanism of leukemogenesis by the chromosomal translocation involving Mll, because the different mutations of both functional copies of Mll generated by us and another group did not lead to the complete blockage of differentiation or the acceleration of the growth of hematopoietic cells.
ACKNOWLEDGMENT
We thank M. Sato for advice on histological examination; Y. Higashi, T. Ogura, and N. Takahashi for the probes of Hox genes; M. Seto for anti-Mll antibody; and T. Matsunashi for technical assistance. We thank R. Hiraiwa and Y. Ishinishi for maintaining mouse colonies and M. Ooi for secretarial assistance.
Address reprint requests to Toshihisa Komori, MD, Department of Medicine III, Osaka University Medical School, 2-2 Yamada-oka, Suita, Osaka, 565, Japan.
The publication costs of this article were defrayed in part by page charge payment. This article must therefore be hereby marked "advertisement" is accordance with 18 U.S.C. section 1734 solely to indicate this fact.


![Fig. 3. Histological examination of fetal livers. (A and B) Sections of fetal liver at E11.5 stained with HE (original magnification [OM] × 200). Hematopoietic cells in Mllmu/mu fetal liver were slightly decreased. (C through F) Sections of fetal liver at E12.5 stained with HE (OM × 100). The decrease of hematopoietic cells in Mllmu/mu was prominent. (A, C, and E) Mll+/+; (B, D, and F) Mllmu/mu.](https://ash.silverchair-cdn.com/ash/content_public/journal/blood/92/1/10.1182_blood.v92.1.108.413k11_108_117/5/m_blod413yag03z.jpeg?Expires=1763504865&Signature=sapCoPgboDjNefdJ~OHKpcg-9iSG~qo~R31Wd50RHA71ynSTB47hg292cOu40T8FccBd6X15FeMBBSk-AIokFxTBHFKK9gq796svggqj8ykto~cLcrnjhbRuo6XwsOyhxmupgZ29~TWTF-JByUZ~MPIMl9PqG5e-loIs8PD9e3kpD7bHpI6n-v2epXni6A4aMHqHWy7y9TV~w7bzlj~pOkVybKsP2MqZPqpTYB~7hUStcxA1ffC3Lt~uG2tYHjRLrFg8vwZnNYwfmn07cs2kjkwStr9n8G2qqRw83~lNWTSJLAcsE8nmYVccZ92fEgkAT~lcbDV~qtMI7aB6ZSjvvA__&Key-Pair-Id=APKAIE5G5CRDK6RD3PGA)


This feature is available to Subscribers Only
Sign In or Create an Account Close Modal