Abstract
Fludarabine (F-ara-A), an adenine nucleoside analog with efficacy in B-cell chronic lymphocytic leukemia (B-CLL), has also been shown to have a long-lasting suppressive effect on T lymphocytes. In heterogeneous clinical samples, apoptosis cannot be detected by standard methods in small cellular subsets. We developed, therefore, a combined assay of in situ end-labeling of nicked DNA by terminal deoxynucleotide transferase, with measurements of cellular DNA content and surface antigens (CD3, CD4, CD8, and CD19) by multiparametric flow cytometry. This assay was used to determine F-ara-A–induced apoptosis in different lymphocyte subsets from CLL patients and normal controls treated with F-ara-A in vitro. Apoptosis was also correlated to bcl-2 protein levels. We observed a direct effect of F-ara-A on both B-CLL and T lymphocytes. The response to F-ara-A in B-CLL lymphocytes in vitro was Rai stage–dependent, the early-stages being more responsive (P = .01). Higher levels of spontaneous apoptosis were observed in B-CLL lymphocytes from early stage patients (P = .02). No difference was observed in spontaneous apoptosis of normal T cells in B-CLL, although T lymphocytes in late-stage disease were more sensitive to F-ara-A–induced apoptosis. Incubation with cyclosporin A did not affect B-CLL and T-lymphocyte survival compared with control cultures. Results suggested a direct apoptotic effect of F-ara-A on B-CLL lymphocytes that decreases with increasing clinical stage. No correlation was found between bcl-2 and spontaneous or F-ara-A–induced apoptosis. Apoptosis occurred at all cell-cycle stages and was not restricted to cells in S phase. The mechanisms of this stage-dependent apoptosis in CLL remain to be elucidated.
FLUDARABINE (9-β-D-arabinofuranosyl-2-fluoroadenine; F-ara-A) is an adenine nucleoside analog resistant to adenosine deaminase that has been extensively used to successfully treat various hematological malignancies.1,2 Although F-ara-A's major action is inhibition of DNA synthesis, clinical investigations have shown strong therapeutic activity in indolent lymphocytic malignancies with very low growth fraction.3-5 Other mechanisms of action have been shown for F-ara-A, such as incorporation into RNA, effect on methylation, DNA repair, and nicotinamide adenine dinucleotide metabolism.2 The mechanism by which F-ara-A induces apoptosis in both proliferating and quiescent cells has not yet been completely established, however, and is an active focus of investigation. Evaluation of the effects of F-ara-A in clinical samples in vivo and in vitro is difficult because of the complex interactions among different cell populations that influence growth or maintenance of the leukemic clone as well as its response to chemotherapy. In chronic lymphocytic leukemia (CLL), an often indolent disease, F-ara-A proved to be a markedly cytoreductive agent,6 but it also induced profound T lymphopenia.7 Subsequent studies showed that CD4 and CD8 T-lymphocyte subsets are rapidly depressed when F-ara-A therapy is initiated, revealing that this lymphocytotoxic agent may exert preferential cytotoxicity toward T lymphocytes.8This observation raises the possibility that the F-ara-A effect on B-CLL cells could be exerted, at least in part, by a reduction of T lymphocytes and their cytokine production or other functions. Indeed, the role of T lymphocytes in B-cell activation, proliferation, differentiation, and isotype switching is well recognized.9Little is known, however, about the interaction of T lymphocytes and leukemic B cells in CLL. Although T lymphocytes represent a minority of the circulating lymphocytes, their absolute number is generally increased in CLL.10,11 A role for T lymphocytes in B-CLL may also be postulated from published observations of a reduction in B-CLL cells after treatment with cyclosporin A (CyA).12,13Although CyA's direct effect on B-CLL cannot be excluded,14 it may have affected B-CLL through inhibition of T-lymphocyte cytokine production.15,16 In CLL cells, CyA has also been shown to inhibits cytokine-induced proliferation.17
We investigated the in vitro effect of F-ara-A in B and T peripheral blood lymphocytes from 25 CLL patients and 4 normal controls. We also evaluated the effect of CyA in 5 CLL samples. This approach was intended to address the question of whether F-ara-A directly affects the B-CLL lymphocyte compartment or whether its effect could be modulated indirectly through T lymphocytes. We explored the correlation between bcl-2 protein expression and F-ara-A–induced and spontaneous apoptosis. Finally, to test whether recruitment of cells in the S phase was required for F-ara-A–inducted apoptosis, we investigated the possible correlation of apoptosis with cell-cycle stage. For this purpose we developed an in situ end labeling (ISEL) technique to simultaneously detect DNA strand breaks associated with apoptosis,18 cell surface antigens, and cellular DNA content.
MATERIALS AND METHODS
Reagents.
F-ara-A was provided by Dr V.L. Narayanan, Drug Synthesis and Chemistry Branch Division of Cancer Treatment, National Cancer Institute, Bethesda, MD. CyA was purchased from Sandoz (East Hanover, NJ). Phycoerythrin (PE)- and peridinin chlorophyl (PerCP)-conjugated monoclonal antibodies (MoAb) specific for CD3, CD4, CD8, CD19, CD5, and control antibodies with irrelevant specificities were purchased from Becton Dickinson (San Jose, CA); fluorescein isothiocyanate (FITC) bcl-2 MoAb and isotype IgG1 control were from Dako Corporation (Carpinteria, CA). Terminal deoxynucleotide transferase (Tdt), biotin-16-2′-deoxyuridine-5′-triphosphate (b-dUTP), and Tdt reaction buffer were obtained from Boehringer-Mannheim Co (Indianapolis, IN). Hoechst 33342 was purchased from Polysciences, Inc (Warrington, PA).
Patients, cell isolation, and incubation conditions.
Patient samples were obtained with informed consent according to institutional guidelines. All CLL patients fulfilled the National Cancer Institute (NCI) criteria for the diagnosis of CLL19and had been without treatment for at least 2 months before the analysis. Immunophenotyping by dual-parameter flow cytometry showed coexpression of CD5 and B-cell antigens and isotypic light-chain expression. Rai clinical staging system was applied.20 CLL patients were grouped in two categories according to the Rai stage at the time of the analysis: group 1, patients at stages 0 and I (18 patients) and group 2, patients at stages II, III, and IV (7 patients).
Freshly obtained peripheral blood from CLL patients and 4 healthy subjects was fractionated by Ficoll-Histopaque-1077 (Sigma, St Louis, MO) sedimentation. Mononuclear cells were resuspended in RPMI 1640 medium (GIBCO-BRL, Gaithersburg, MD) supplemented with streptomycin, penicillin, and 10% fetal calf serum (GIBCO) at a concentration of 0.5 to 1 × 10⁷ cells per milliliter. Cells were incubated at 37°C in an atmosphere of 5% CO2with various drugs for the times indicated.
Immunofluorescence detection and flow cytometry.
Cells obtained from the cultures were washed twice in cold phosphate-buffered saline (PBS). One million cells were resuspended in 100 μL of PBS and 1% bovine serum albumin (BSA) and incubated for 30 minutes at 4°C with PE- or PerCP-conjugated MoAbs at the concentration of 10 μg/mL. PE- and PerCP-conjugated MoAb with irrelevant specificities were used as controls. Cells were then washed twice in cold PBS and processed for bcl-2 or apoptosis measurement as described following.
Bcl-2 immunofluorescence detection and quantitation.
Bcl-2 proto-oncogene protein staining was performed in combination with detection of CD19 and CD5. Briefly, after staining with CD5-PE and CD19-PerCP, cells were washed twice and fixed in 1% paraformaldehyde for 15 minutes on ice, followed by permeabilization with 70% ethanol for 15 minutes on ice; cells were then washed in cold PBS before the addition of 10 μg/mL of FITC-conjugated anti–bcl-2 or isotype IgG1 MoAb. Intensity of bcl-2 expression was measured on a logarithmic scale, and bcl-2 quantitation was assessed by Quantum Simply Cellular microbeads with QuickCal Software (Flow Cytometry Standard Corporation, Triangle Park, NC) as previously described21 22 and expressed as antibody-binding capacity (ABC) as an estimate of the number of antibody molecules bound per cell. A FACScan flow cytometer (Becton Dickinson) equipped with an argon laser (488 nm) was used to measure fluorescence. Data were analyzed using Lysys II software (Becton Dickinson).
Measurement of apoptosis: ISEL of DNA strand breaks associated with apoptosis.
For multiparametric analysis of surface antigens, ISEL for apoptosis and DNA content, cells stained with MoAbs were fixed in 2 mL of 1% freshly prepared paraformaldehyde in PBS (pH 7.4) for 15 minutes at 4°C on a horizontal shaker. Samples were washed once and stored at −20°C in 70% ethanol for up to 2 weeks. After being rehydrated in PBS, cells were resuspended in 50 μL of cacodylate buffer containing 0.2 mmol/L potassium cacodylate, 2.5 mmol/L Tris-HCl (pH 6.6), 2.5 mmol/L CoCl2, 0.25 mg/mL BSA, 7 U Tdt, and 0.5 μmol/L biotin-16-dUTP. Cells were incubated in this solution at 37°C for 1 hour, then rinsed twice in PBS and resuspended in 100 μL avidin FITC at 2.5 μg/mL in 4× SSC with 0.1% Triton X-100 and 1% BSA. After 30 minutes of incubation at room temperature in the dark, cells were rinsed in PBS with 0.1% Triton X-100 and resuspended in 500 μL of PBS for flow cytometric analysis. Control reactions lacked Tdt. We measured a total of at least 3 × 10⁴ cells per sample, setting a “live gate” on CD3+ cells to ensure acquisition of at least 1 × 10⁴ cells for those samples in which T-lymphocyte subpopulations were a small fraction of the entire number of cells.
DNA staining and analysis.
For DNA staining we used a 20-fold concentrated Hoechst 33342 stock solution dissolved in distilled water to a concentration of 10 μg/mL with 10% Tween 20. One hundred microliters of this solution were mixed into the cell suspension, resulting in a final concentration of 0.5 μg/mL of Hoechst 33342 and incubated at 4°C for 8 hours. Samples were measured with a FACSVantage flow cytometer equipped with a Coherent Enterprise laser (Becton Dickinson, Mountain View, CA). The Enterprise laser was tuned to emit at 325 nm and 488 nm simultaneously. The laser power was adjusted to 100 mW for 488 nm for ISEL and MoAb excitation and to 40 mW for UV (Hoechst 33342 DNA-fluorescence). The filters used for the fluorochromes excited at 488 nm were 530 nm, 585 nm, and 650 nm for FITC, PE, and PerCP, respectively; a blue filter (470 nm) was used for Hoechst fluorescence. Data acquisition was done with a Hewlett Packard 3000 System combined with Lysys II software. Compensation and amplification were set with specific isotype controls. A pulse processor was used for doublet-discrimination by calculating width, height, and area of the analog fluorescence signal of the DNA parameters.
Statistics.
Statistical analysis was performed using Student's t-test and the Spearman rank correlation coefficient.
RESULTS
F-ara-A–induced apoptosis in B and T lymphocytes from CLL patients and healthy individuals.
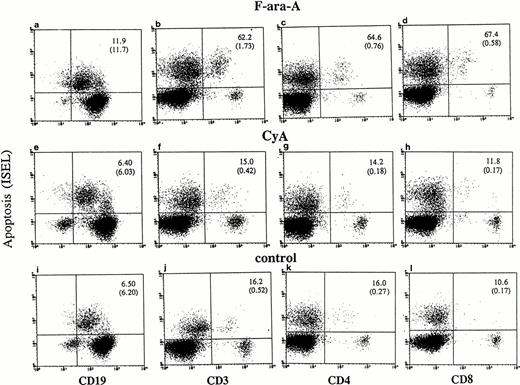
Cultured lymphocytes from healthy individuals and CLL patients were treated with F-ara-A (3 μmol/L),23-25 and the degree of apoptosis was evaluated in the different lymphocyte compartments at 24, 48, and 72 hours. As shown in Fig 1,apoptotic ISEL+ cells could be determined in CD19+, CD3+, CD4+, and CD8+ antigen-defined cell populations. In the example shown in Fig 1 (patient No. 24), after 72 hours spontaneous apoptosis was 6.5%, 16.2%, 16%, and 10.6% in CD19+, CD3+, CD4+, and CD8+ cells, respectively. In the same antigen-defined populations F-ara-A–induced apoptosis was 11.9%, 62.2%, 64.6%, and 67.4%, which reflect the relative resistance of F-ara-A–induced apoptosis in CD19+cells but not in CD3+ T lymphocytes in these patients (stage IV). An assay that detects apoptosis in the entire population only would have missed the disproportionate apoptosis between B-CLL and T lymphocytes. In fact, although CD3+/ISEL+cells are only 1.73% (Fig 1B, number in parenthesis) of the entire population, they represent 62.2% of the CD3+ lymphocytes.
Flow cytometric determination of apoptosis by ISEL in antigen defined subpopulations (patient No. 24, Table 1). Peripheral lymphocytes were incubated in vitro in the presence or absence of F-ara-A (3 μmol/L) or CyA (100 ng/mL). Apoptosis was evaluated after 72 hours in CD19+, CD3+, CD4+, and CD8+ lymphocytes. The number in the top right quadrant represents the percentage of apoptotic cells in the antigen-defined population. The numbers in parentheses represent the percentage of antigen-defined apoptotic cells within the total number of peripheral lymphocytes.
Flow cytometric determination of apoptosis by ISEL in antigen defined subpopulations (patient No. 24, Table 1). Peripheral lymphocytes were incubated in vitro in the presence or absence of F-ara-A (3 μmol/L) or CyA (100 ng/mL). Apoptosis was evaluated after 72 hours in CD19+, CD3+, CD4+, and CD8+ lymphocytes. The number in the top right quadrant represents the percentage of apoptotic cells in the antigen-defined population. The numbers in parentheses represent the percentage of antigen-defined apoptotic cells within the total number of peripheral lymphocytes.
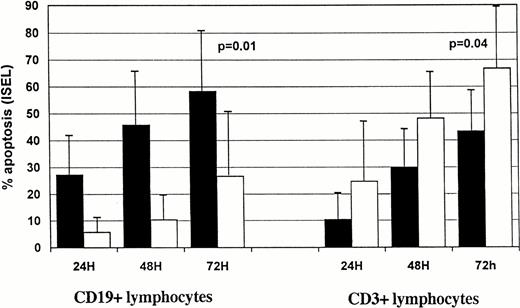
In CLL samples we observed a time-dependent increase in the percentage of F-ara-A–induced apoptotic cells (Fig2). Within the CD19+ cell compartment 27.1 ± 16.5% of apoptotic cells were already detectable after 24 h in group 1 patients vs. 5.6% ± 7.1% in group 2 (Fig 2A). The number of CD19+ apoptotic cells in the two groups constantly increased during the second day of incubation, reaching 58.3 ± 23.7% for group 1 versus 26.5 ± 23.3% for group 2 (P = .01) at 72 hours. Time-dependent induction of apoptosis was also observed in the CD3+ compartment of the two patient groups (Fig 2A). Interestingly, F-ara-A treatment induced less apoptosis in T cells in group 1 (43.2 ± 15%) compared with 66.9 ± 23.4% in group 2 patients (P = .04). We then investigated whether F-ara-A–induced apoptosis in CLL T cells had differential effects on CD4+ and CD8+ T-cell subpopulations. In five samples analyzed CD4+ and CD8+ T-lymphocyte subcompartments were equally affected by F-ara-A (a representative experiment is shown in Fig 1).
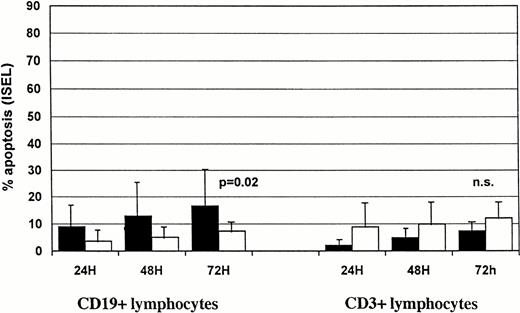
Kinetics of F-ara-Ainduced (A) and spontaneous (B) apoptosis in T-normal and B-CLL peripheral lymphocytes from 25 patients. Suspensions of peripheral lymphocytes were incubated alone or in the presence of 3 μmol/L F-ara-A for 72 hours. Patients were grouped according to Rai stages 0 to I (solid bars) and stages II to IV (open bars). Apoptosis was measured by using ISEL in antigen-defined lymphocyte subpopulations and expressed as percentages. Bars represent the mean values in each group plus standard deviation. Statistical significance was evaluated at 72 hours, using the Studentt-test.
Kinetics of F-ara-Ainduced (A) and spontaneous (B) apoptosis in T-normal and B-CLL peripheral lymphocytes from 25 patients. Suspensions of peripheral lymphocytes were incubated alone or in the presence of 3 μmol/L F-ara-A for 72 hours. Patients were grouped according to Rai stages 0 to I (solid bars) and stages II to IV (open bars). Apoptosis was measured by using ISEL in antigen-defined lymphocyte subpopulations and expressed as percentages. Bars represent the mean values in each group plus standard deviation. Statistical significance was evaluated at 72 hours, using the Studentt-test.
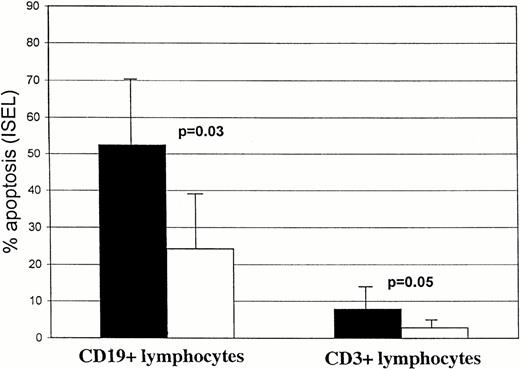
We also tested F-ara-A effects on normal B and T cells from four healthy subjects. After 24 hours of incubation with F-ara-A, we detected 52.5% ± 17.7 and 7.9% ± 4.2 apoptotic lymphocytes within CD19+ and CD3+ cells, respectively (Fig3). Data suggest that, under these in vitro conditions, normal B cells from healthy subjects are more susceptible to F-ara-A–induced apoptosis than B-CLL lymphocytes (52.5 ± 17.7 for healthy subjects v 27.1 ± 16.5% and 5.6% ± 7.1% for group 1 and group 2 CLL patients, respectively), whereas the susceptibility of normal T cells is comparable to group 1 CLL patients but lower than group 2 (7.9% ± 4.2 for healthy subjects v10.5 ± 10 and 24.8 ± 21.1 for group 1 and group 2 CLL patients, respectively).
Spontaneous and F-ara-A–induced and apoptosis (% ± SD) in CD19+ and CD3+ peripheral lymphocytes from four healthy subjects after 24-hour incubation in vitro. Solid bars, F-ara-A; open bars, control.
Spontaneous and F-ara-A–induced and apoptosis (% ± SD) in CD19+ and CD3+ peripheral lymphocytes from four healthy subjects after 24-hour incubation in vitro. Solid bars, F-ara-A; open bars, control.
Spontaneous apoptosis in B and T lymphocytes from healthy individuals and CLL patients.
The extent of spontaneous apoptosis over a 72-hour period was measured in lymphocyte subsets of peripheral blood cells from 25 patients with CLL and 4 normal individuals. Figure 2B shows spontaneous apoptosis in CD19+ and CD3+ lymphocytes after 24, 48, and 72 hours in group 1 and group 2 CLL patients. Few apoptotic cells were detected after 24 hours in CD19+ and CD3+compartments of group 1 and 2 patients. A slight increase in the percentage of spontaneously apoptotic cells was observed in both B- and T-cell compartments with time in the two groups of patients. After 72 hours, CLL lymphocytes showed 16.5 ± 13.5% spontaneous apoptosis in the CD19+ compartment of group 1 patients, compared with 8.1 ± 3.9 in group 2 (P = .02). Group 1 and group 2 did not differ significantly in spontaneous apoptosis of CD3+lymphocytes (7.3 ± 4.2% v 12.0 ± 6.0%;P = .09).
Normal B lymphocytes (Fig 3) showed a higher percentage of apoptotic cells after 24 hours than did T lymphocytes (24.2% ± 14.3v 2.9% ± 1.5), suggesting that under these in vitro conditions B cells were more susceptible to spontaneous apoptosis than T cells.
Effect of CyA on lymphocytes.
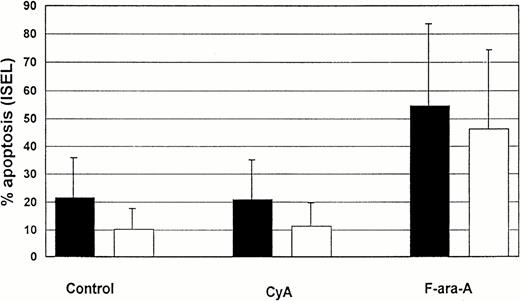
In 5 CLL patients (3 patients group 1 and 2 patients group 2), lymphocytes were cultured in the presence of CyA (100 ng/mL). The percentage of apoptotic cells was assessed in T and B-CLL lymphocytes at 72 (Fig 4) and 120 hours (not shown). No significative differences in the number of apoptotic cells were observed in either the T- or B-lymphocyte compartments in the presence of CyA as compared with controls. The same results were found in the CD4+ and CD8+ T-cell compartments at 72 hours (example shown in Fig 1).
Comparison of spontaneous, CyA, and F-ara-A–induced apoptosis (% ± SD) in CD19+ and CD3+lymphocytes from 5 CLL patients after 72 hours incubation in vitro. Solid bars, T cells; open bars, B cells.
Comparison of spontaneous, CyA, and F-ara-A–induced apoptosis (% ± SD) in CD19+ and CD3+lymphocytes from 5 CLL patients after 72 hours incubation in vitro. Solid bars, T cells; open bars, B cells.
Bcl-2 measurements.
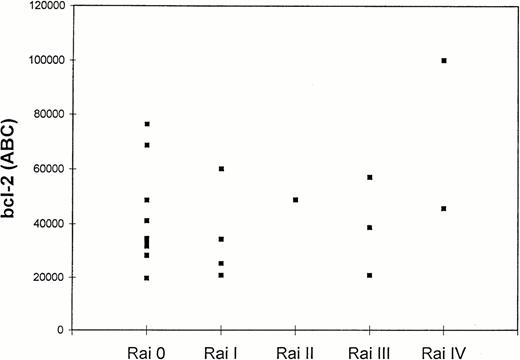
Twenty patients with CLL were tested for bcl-2 expression, and the results are shown in Table 1. The quantitation of bcl-2 antibody-binding sites was achieved by direct immunofluorescence of Quantum Simply Cellular microbeads as described in Material and Methods. Results were expressed as ABC (bcl-2 molecules/cell).25 In all 20 cases, leukemic cells showed detectable levels of bcl-2. Mean bcl-2 antigen density in all tested CLL cases was 43,150 ± 20,850 ABC, levels higher than those found in normal CD3+ and CD19+ lymphocytes (29,000 and 37,000 ABC, respectively).26 Although higher levels of bcl-2 were observed in group 2 (51,915 ± 26,627 ABC) than in group 1 patients (39,394 ± 17,669 ABC), the difference was not statistically significant (P = .3). Figure5 shows bcl-2 ABC in CLL patients divided by Rai stage. No further correlations were found between bcl-2 levels and the extent of F-ara-A–induced (r2 = .002;P = ns), spontaneous apoptosis (r2 = .03;P = ns), and B2 microglobulin levels (r2 = .28; P = ns).
Percentage of Spontaneous and F-ara-A–Induced Apoptosis in Antigen-Defined Peripheral Lymphocytes in CLL Patients and Bcl-2 Protein Expression
| Patient No. . | Rai Stage . | Spontaneous Apoptosis (%) . | F-ara-A–Induced Apoptosis (%) . | Bcl-2 (ABC) . | ||
|---|---|---|---|---|---|---|
| CD19+ . | CD3+ . | CD19+ . | CD3+ . | |||
| 1 | 0 | 6.9 | 9.0 | 85.8 | 61.49 | 48.756 |
| 2 | 0 | 13.2 | 3.8 | 52.2 | 35.1 | 31.726 |
| 3 | 0 | 30.6 | 5.8 | 54.5 | 34.3 | 33.150 |
| 4 | 0 | 43.8 | 1.8 | 81.6 | 35.3 | 28.258 |
| 5 | 0 | 1.2 | 5.5 | 74.7 | 29.4 | 34.728 |
| 6 | 0 | 7.5 | 8.6 | 82.8 | 58.9 | 76.320 |
| 7 | 0 | 1.1 | 0.9 | 41.2 | 53.8 | 41.109 |
| 8 | 0 | 20.3 | 8.3 | 21.8 | 30.2 | 19.644 |
| 9 | 0 | 4.7 | 10.1 | 13.1 | 43.0 | ND |
| 10 | 0 | 25.4 | 8.3 | 60.3 | 17.7 | 28.380 |
| 11 | 0 | 6.2 | 4.4 | 66.4 | 63.8 | 68.688 |
| 12 | I | 38.2 | 6.3 | 81.2 | 56.6 | 60.054 |
| 13 | I | 39.1 | 3.2 | 97.9 | 39.1 | 34.464 |
| 14 | I | 14.1 | 16.1 | 33.2 | 52.5 | ND |
| 15 | I | 7.6 | 4.6 | 40.0 | 20.0 | ND |
| 16 | I | 12.8 | 7.5 | 58.9 | 16.1 | 20.814 |
| 17 | I | 7.2 | 11.2 | 36.1 | 46.4 | 25.426 |
| 18 | I | 17.5 | 16.6 | 68.0 | 58.2 | ND |
| 19 | II | 5.17 | 2.2 | 28.8 | 22.2 | 48.858 |
| 20 | III | 9.8 | 9.9 | 28.9 | 86.5 | 57.084 |
| 21 | III | 3.3 | 17.7 | 3.9 | 82.4 | 20.808 |
| 22 | III | 6.2 | 18.8 | 19.5 | 90.2 | 38.814 |
| 23 | IV | 10.6 | 7.0 | 16.7 | 67.4 | 100.200 |
| 24 | IV | 6.5 | 16.2 | 11.9 | 62.2 | ND |
| 25 | IV | 14.9 | 12.1 | 75.6 | 57.8 | 45.726 |
Peripheral lymphocytes from 25 CLL patients were incubated alone or with F-ara-A, 3 μmol/L for 72 hours. Apoptosis was assessed as the percentage of ISEL-positive cells within the CD3+ and the CD19+ antigen-defined population. Bcl-2 protein expression was quantified in CD5/CD19+ lymphocytes as described in Materials and Methods.
Abbreviation: ND, not determined.
Bcl-2 levels in CD5+/CD19+lymphocytes of 20 CLL patients according to Rai stage. Quantitation of bcl-2 was expressed as ABC (bcl-2 molecules/cell) as described in Materials and Methods.
Bcl-2 levels in CD5+/CD19+lymphocytes of 20 CLL patients according to Rai stage. Quantitation of bcl-2 was expressed as ABC (bcl-2 molecules/cell) as described in Materials and Methods.
Apoptosis and cell cycle.
Peripheral lymphocytes from two CLL patients were simultaneously analyzed for apoptosis, surface markers, and DNA content. Figure6 shows correlated DNA histogram and ISEL measurements in CD19+ cells. Cells with a low degree of DNA fragmentation (region 1) had G0/1 DNA content, whereas increased intensity for ISEL was accompanied by a shift into the hypodiploid area (region 2). The few cells with S/G2M DNA content were predominantly ISEL+.
Simultaneous determination of apoptosis (ISEL) and DNA content (Hoechst 33324) in B-CLL CD19+ lymphocytes after 24-hour treatment in vitro with 3 μmol/L fludarabine (patient No. 5, group 1). B-CLL cells are mainly in the G0/1 cell cycle phases when they become positive for ISEL. Among the CD19+/ISEL+ lymphocytes, cells with diploid DNA content (early apoptotic cells, region [reg] 1) can be distinguished from cells with subdiploid DNA content (late apoptotic cells, reg 2).
Simultaneous determination of apoptosis (ISEL) and DNA content (Hoechst 33324) in B-CLL CD19+ lymphocytes after 24-hour treatment in vitro with 3 μmol/L fludarabine (patient No. 5, group 1). B-CLL cells are mainly in the G0/1 cell cycle phases when they become positive for ISEL. Among the CD19+/ISEL+ lymphocytes, cells with diploid DNA content (early apoptotic cells, region [reg] 1) can be distinguished from cells with subdiploid DNA content (late apoptotic cells, reg 2).
DISCUSSION
The primary aim of this study was to determine the induction of apoptosis in different subpopulations during F-ara-A treatment. We observed that induction of apoptosis appeared at the same time in both populations of B and T lymphocytes, being more likely a direct effect of F-ara-A than a consequence of interactions between these two cell populations. When a high rate of spontaneous apoptosis was observed, it involved predominantly B-CLL cells rather than T lymphocytes. In several patients, an effective induction of apoptosis by F-ara-A of the T lymphocytes did not affect B-CLL lymphocytes. Finally, incubation of T lymphocytes in the presence of CyA did not enhance the rate of spontaneous apoptosis of B-CLL cells.
Taken together, our data strongly suggest a direct effect of F-ara-A on B-CLL lymphocytes. Although lymphocyte subset analysis in vivo revealed that T lymphocytes are more sensitive to the cytotoxic effect of F-ara-A than B lymphocytes,6 T lymphocytes from four normal subjects proved to be more resistant than B lymphocytes in vitro in both F-ara-A–induced and spontaneous apoptosis. In vivo data indicate that F-ara-A–related lymphophenia is related to the decreased number of CD4+ cells.27 Our in vitro results showed no difference, however, in susceptibility to F-ara-A treatment and spontaneous apoptosis between CD4+ and CD8+cells, suggesting that prolonged in vivo CD4 lymphophenia is related to slow recovery rather than to selective F-ara-A cytotoxicity. In our study, although spontaneous apoptosis was significantly higher in B lymphocytes obtained from patients with low-risk disease, pronounced interpatient variation was evident. As mentioned in the results, no significant differences were observed for spontaneous apoptosis of T lymphocytes in the two groups of patients.
The role of CyA in CLL is still controversial. Originally, CyA was used to treat autoimmune disorders associated with B-CLL,28 and occasional antileukemic effects were described thereafter.12,29 CyA was also used successfully in two patients with angioimmunoblastic lymphadenopathy with dysproteinemia (AILD), a disease in which abnormal T cells induce B-cell hyperreactivity.30 Whether CyA acts directly on malignant B cells14,31 or indirectly through different pathways is not clear. In our in vitro model, we did not observe any direct or indirect induction of apoptosis by CyA on CD19+, CD3+, CD4+, and CD8+ lymphocyte compartments over a 120-hour period. A recent clinical report concerning five CLL patients treated with CyA showed no encouraging results.13
Despite the low incidence of bcl-2 rearrangements in CLL, estimated at 4%,32 bcl-2 protein levels in B-CLL cells are equivalent to or higher than those found in cell lines containing t(14:18). Hypomethylation in the 5′ end of the bcl-2 gene has been associated with transcriptional activation of this proto-oncogene. Hanada et al31 showed in three cases that CLL cells with increased levels of bcl-2 protein survived longer in culture and underwent delayed spontaneous apoptosis. Bcl-2 overexpression was also shown to increase relative resistance to γ-irradiation and chemotherapy33,34 and to prolong in vitro survival of normal35 and acute lymphoblastic leukemia B lymphocytes.36 In our study, however, we found no correlation when bcl-2 levels were related to the percentage of F-ara-A–induced or spontaneous apoptosis, which suggested that F-ara-A–mediated cytotoxicity may be bcl-2 independent. Similar data recently presented by Kitada et al37 and Robertson et al38 suggested that other factors such as p53, CD40L, or Mcl-1 could be key regulators of apoptotic or antiapoptotic pathways for B-CLL lymphocytes.39-41
DNA strand breaks are characteristic of apoptosis and may be exploited in the ISEL assay, which seems to be more effective than conventional assays in being more sensitive.42 Unlike extracted DNA analysis, ISEL is capable of identifying individual cells, thus allowing apoptotic cells to be quantified. The combination of this technique with simultaneous multicolor staining of membrane antigens and DNA content provides the opportunity to study induction of apoptosis in subpopulations of cells in heterogeneous samples and to establish correlations with other biological parameters.43 44 The technique may be useful in selection of cytotoxic drugs that target a specific population. As in the representative patient shown in Fig 1, we observed that in 6 of 7 patients with stage III-IV CLL (patient Nos. 19, 20, 21, 22, 23, 24; Table 1), F-ara-A was relatively ineffective on CD19+lymphocytes but showed higher cytotoxicity in CD3+ cells. The overall use of F-ara-A in those refractory patients may, therefore, not be beneficial.
The mechanism of action of F-ara-A in proliferating cells is mainly cell cycle-specific, and incorporation of F-ara-A into DNA during S phase is required for the induction of apoptosis in a T lymphoblastoid cell line.45 The clinical efficacy of F-ara-A is higher, however, in indolent lymphoid malignancies than in intermediate- and high-grade lymphoid neoplasms. In direct measurements of apoptosis and cell cycle, as already shown in normal lymphocytes,46 we showed an S phase–independent F-ara-A induction of apoptosis in B-CLL lymphocytes.
F-ara-A had a direct effect on malignant and normal B and T lymphocytes. Its cytotoxicity was lower at Rai stages II to IV than at stages 0 to I, and normal T cells of CLL patients at stage II, III, and IV were more sensitive to F-ara-A than at lower stages. The F-ara-A–induced apoptosis effect was not S phase–dependent and was observed in G0/1 cells.
Supported in part by National Institutes of Health Grant Nos. CA 55164 and CA 16672. U.C. is supported in part by a scholarship from the Fondazione Catanese per lo Studio e la Cura delle Malattie Neoplastiche del Sangue, Catania, Italy.
Address reprint requests to Ugo Consoli, MD, Institute of Hematology, University of Catania. Ospedale Ferrarotto Alessi, via Citelli 6, 95124 Catania, Italy.
The publication costs of this article were defrayed in part by page charge payment. This article must therefore be hereby marked “advertisement” in accordance with 18 U.S.C. section 1734 solely to indicate this fact.

![Fig. 6. Simultaneous determination of apoptosis (ISEL) and DNA content (Hoechst 33324) in B-CLL CD19+ lymphocytes after 24-hour treatment in vitro with 3 μmol/L fludarabine (patient No. 5, group 1). B-CLL cells are mainly in the G0/1 cell cycle phases when they become positive for ISEL. Among the CD19+/ISEL+ lymphocytes, cells with diploid DNA content (early apoptotic cells, region [reg] 1) can be distinguished from cells with subdiploid DNA content (late apoptotic cells, reg 2).](https://ash.silverchair-cdn.com/ash/content_public/journal/blood/91/5/10.1182_blood.v91.5.1742/3/m_blod4052306.jpeg?Expires=1769219895&Signature=aH7hQCSZAt8ftjYbVtHZSoNFoIHdyVKJ3LyBxabSKVPEYqw9~~k-xNhiWA~bHMkTfpZvvEDcWgaHqMCy3PHw7DWHthTlgkJ2CWDokZJNEm25eNdHa0ZLratQ2ZwJwsjK6D2rjXK0WRQVHnfFQJUtxntCsZtnjG2jApI-HMEvFCYeYQQ14SrABx4feG5qdPjXVuVcVhhJowmExE5BUL06LwND6ynfDklNgSEU1~1tlNtnPaG5t5qLXXF~PiLwHJzcyV4SLsLoVRn8QfCzqmYx~HvdPpvb0K4lhKPTzD5eHrMHkwgKI6TC~n~lxheiFMjAXD6X7znLrp3BrVIlwnGWoA__&Key-Pair-Id=APKAIE5G5CRDK6RD3PGA)
This feature is available to Subscribers Only
Sign In or Create an Account Close Modal