Abstract
By using RNase protection analysis, residues 2677 and 2995 ofMDR-1 were identified as sites of genetic polymorphism. Through use of oligonucleotide hybridization, the genomic content and expression of individual MDR-1 alleles were examined in normal tissues, unselected and drug selected cell lines, and malignant lymphomas. In normal tissues, unselected cell lines, and untreated malignant lymphoma samples, expression of MDR-1 from both alleles was similar. In contrast, in drug selected cell lines, and in relapsed malignant lymphoma samples, expression of one allele was found in a large percentage of samples. To understand how expression of one allele occurs, two multidrug resistant sublines were isolated by exposing a Burkitt lymphoma cell line to increasing concentrations of vincristine. The resistant sublines expressed only one allele and had a hybrid MDR-1 gene composed of non–MDR-1 sequences proximal to MDR-1. Previous studies showing hybridMDR-1 genes after rearrangements provided a potential explanation for activation and expression of one MDR-1 allele. We conclude that oligonucleotide hybridization can be used as a sensitive tool to examine relative allelic expression of MDR-1,and can identify abnormal expression from a single allele. Acquired drug resistance in vitro and in patients is often associated with expression of a single MDR-1 allele, and this can be a marker of a hybrid MDR-1 gene.
ALTHOUGH MULTIDRUG resistance mediated byMDR-1/P-glycoprotein was initially identified in vitro in models of acquired resistance, subsequent studies have shown expression of this protein in both unselected cell lines and in normal tissues.1,2 In vitro, models of acquired resistance express increasing levels of MDR-1 with advancing drug pressure, and this has been shown to occur without or with gene amplification.3 Although extensively characterized as a mechanism of drug resistance, very little is known about the regulation of MDR-1 expression.
Coexpression of alleles forms the basis of Mendelian genetics, but with the exception of selected genes which have been shown to be imprinted, surprisingly little has been done to examine the regulation of expression of individual alleles in normal tissues or human cancers.4,5 Although the advent of polymerase chain reaction (PCR) technology has offered this possibility, most studies have been confined to analysis of genetic polymorphism at the DNA level, with rare attempts to determine allele-specific expression.6-9
The expression of genetic polymorphism in the MDR-1 gene afforded an opportunity to examine allelic expression in normal tissues and unselected cell lines, providing a basis for comparison with expression after drug treatment in vitro or in the clinic. The present report describes the results of these studies.
MATERIALS AND METHODS
Tissue culture, cell lines, and normal tissues.
Cells obtained from American Type Culture Collection were grown in RPMI supplemented with 10% fetal bovine serum, 2 mmol/L glutamine, and 100 U/mL Pen/Strep. Individual clones were obtained by limiting dilution at 1 cell/10 wells in 96-well plates.
Both unselected and drug selected cell lines were used. Unselected cell lines, maintained as described above, included (1) breast: MCF-710; (2) epidermoid: KB 3-111; (3) neuroblastoma: SH-SY5Y and LA-N-112; (4) hepatoma: HepG213; (5) renal cell: A498, CAKI-1, RXF 393L, and RXF 631L14; (6) colon: HCT-1116, SW620, DLD-1, LS180, and HCT-1514,15; and (7) malignant lymphoma: EW-36.16 Drug selected cell lines included (1) colon: SW620 Vb300, SW20, Ad1000, LS180 Vb20, LS180 Ad50, DLD-1 Vb300, and DLD-1 Ad100017,18; (2) epidermoid: KB 8-5, KB C-1, KB V-1, and KB A-111; (3) ovarian: 2780 Ad19; and (4) breast: MCF-7 AdrR.20 Normal tissues were obtained from surgical or autopsy specimens. Normal circulating cells were obtained by venipuncture; tumor samples were obtained surgically or by needle aspiration from patients with newly diagnosed lymphoma, or from patients with relapsed lymphoma enrolled on a salvage protocol termed EPOCH(etoposide, predisone, oncovin, cytoxan, hydroxy daunorubicin).21
RNase protection assay.
MDR-1 fragments used to synthesize probes in the RNase protection assay were isolated by restriction enzyme digests of the KB C-1 cDNA and subcloned in pGEM-3Z. The hybrid fragment consisting of non–MDR-1 sequences fused to MDR-1 was obtained by PCR amplification using primers A5′ and B3′ described in the Fig 8 legend and was subcloned in pCR II (Invitrogen, Carlsbad, CA). Total RNA was hybridized with 2 × 10⁵ cpm of antisense RNA probes synthesized using a modification of the method of Melton et al.22 RNase protection analysis was performed on these hybrids as described.23
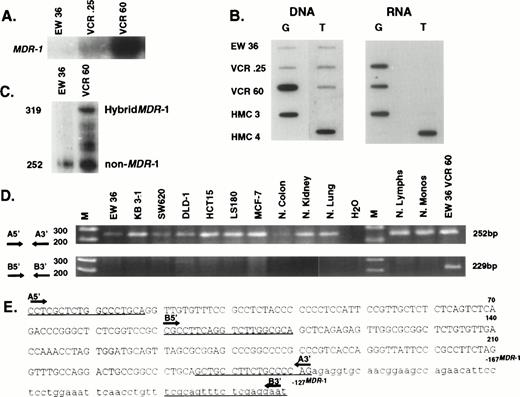
Expression of MDR-1 and novel 252 bp in cell lines and normal tissues. (A) Northern analysis analyzing expression ofMDR-1 in parental Burkitt cells (EW 36) and two mulridrug resistant sublines (VCR.25 and VCR60). (B) Oligonucleotide hybridization of EW 36 and two resistant sublines (VCR.25 and VCR60). DNA blot shows the presence of two alleles in parental EW 36 cells. Amplification of the G allele occurs with vincristine selection. EW 36 cells do not express MDR-1 but selection in vincristine induces expression of the G allele. (C) RNase protection using a 319-bp hybridMDR-1 probe described in panel E. EW 36 and VCR60 cells protect a 252-bp band representing the non–MDR-1 sequences. In addition, VCR60 cells protect the full-length hybrid probe composed of non–MDR-1 and MDR-1 sequences. (D) PCR examining the expression in normal tissues and unselected cell lines, of the novel 252-bp sequences and a hybrid composed of the 3′ 162.bp of the novel sequence and 67 bp of MDR-1. The primers used for PCR are underlined in panel E. The novel 252 bp are constitutively expressed in all cells. In contrast, a hybrid MDR-1 product is detected only in the vincristine selected EW 36 cells. (E) Sequence of hybrid probe used in panel C. The 252 bp of novel non–MDR-1 sequence are represented in upper case, whereas the MDR-1 sequences are shown in lower case.
Expression of MDR-1 and novel 252 bp in cell lines and normal tissues. (A) Northern analysis analyzing expression ofMDR-1 in parental Burkitt cells (EW 36) and two mulridrug resistant sublines (VCR.25 and VCR60). (B) Oligonucleotide hybridization of EW 36 and two resistant sublines (VCR.25 and VCR60). DNA blot shows the presence of two alleles in parental EW 36 cells. Amplification of the G allele occurs with vincristine selection. EW 36 cells do not express MDR-1 but selection in vincristine induces expression of the G allele. (C) RNase protection using a 319-bp hybridMDR-1 probe described in panel E. EW 36 and VCR60 cells protect a 252-bp band representing the non–MDR-1 sequences. In addition, VCR60 cells protect the full-length hybrid probe composed of non–MDR-1 and MDR-1 sequences. (D) PCR examining the expression in normal tissues and unselected cell lines, of the novel 252-bp sequences and a hybrid composed of the 3′ 162.bp of the novel sequence and 67 bp of MDR-1. The primers used for PCR are underlined in panel E. The novel 252 bp are constitutively expressed in all cells. In contrast, a hybrid MDR-1 product is detected only in the vincristine selected EW 36 cells. (E) Sequence of hybrid probe used in panel C. The 252 bp of novel non–MDR-1 sequence are represented in upper case, whereas the MDR-1 sequences are shown in lower case.
Oligonucleotide hybridization.
Both DNA and RNA were used as templates in the PCR. Primers used in the PCR reaction are as follows: 5′,2521GCAAATCTTGGGACAGGAAT; 3′ RNA,2796CTCCTTTCGTGTGTAGAAAC; 3′ DNA,2681CCTTC2687cactcagtttgattt. To evaluate RNA expression, reverse transcription preceded amplification; otherwise the technical aspects were identical. All amplifications included controls without DNA or RNA. After amplification of 1 μg of template, 30% of the PCR product was loaded in each of two adjacent wells of a slot-blot apparatus. The nitrocellulose filter was cut into two halves and each half was hybridized with a different oligonucleotide. Four 19-bp allele-specific oligonucleotide probes (HMO5, HMO6, HMO7, and HMO8) were 5′-phosphorylated with γ32P-ATP and T4 polynucleotide kinase. HMO5 and HMO6 cover residues 2669 to 2687 and were used for RNA hybridizations. HMO7 and HMO8 cover residues 2667 to 2685 and were used for DNA hybridizations. HMO5 and HMO7 possess a G at position 2677 and HMO6 and HMO8 contain a T at this position. Hybridizations and washes were performed as described by Mullis et al.24
For quantitation of the oligonucleotide hybridizations, internal controls were included in all experiments. This was accomplished by using synthetic oligonucleotides as controls. Two 30-bp oligonucleotides, designated HMC3 and HMC4, were used. These oligonucleotides cover residues 2656 to 2685 of the MDR-1 gene, with HMC3 possessing a G at position 2677 and HMC4 a T at this position. Equal amounts of each control were slotted on both sides of the filter, thus providing a means of quantitation and an indicator of specificity. Because the hybridizations were performed under identical conditions, with probes labeled to similar specific activities, the signals from the control oligonucleotides were usually similar. Where differences were observed, different exposures with similar intensities of the control slots were obtained to allow direct comparisons. This approach compensated for differences in hybridization conditions.
PCR.
One microgram of genomic DNA was used as template in PCR for 40 cycles to detect genetic polymorphism at the DNA level. To detect allelic expression, 1 μg of RNA was reverse transcribed and cDNA template was subjected to 35 cycles of PCR. The primers used for DNA and RNA oligonucleotide hybridizations are described above. Primers used to detect the expression of the novel non–MDR-1 sequences and the hybrid composed of non–MDR-1 sequences fused to MDR-1in Fig 8 are as follows: A5′, CCTCGCTCTGGCCCTGCA; A3′, CTGGGGCAGAAGGCAGC; B5′, CGCCTTCAGGTCTTGGCGCA; B3′, ATTCCTCGAGAAACTCGA.
5′ RACE.
The 5′ RACE system (Life Technologies, Gaithersburg, MD) was used to isolate the 5′ residues of the novel MDR-1 hybrid gene in the EW 36 VCR60 cell line. mRNA was reverse transcribed using a 3′ MDR-1 gene specific primer GSP-1:−8GGCTTCCTGTGGCAAAGAG−26. The dC-tailed cDNA was amplified by PCR using the 5′ Anchor Primer provided in the 5′ RACE kit (Life Technologies) and a second internal 3′MDR-1 gene specific primer, designated B3′ and described in PCR methods.25 Direct sequencing of the PCR product was performed using Sequenase (Amersham Life Sciences, Arlington Heights, IL).26
Northern analysis.
From the EW 36 cell line and its two vincristine resistant sublines (VCR.25 and VCR60), 10μg of total RNA were electrophoresed in a 1% agarose/6% formamide gel. The gel was transferred onto nitrocellulose and hybridized with the MDR-1 specific probe, 5A.27
RESULTS
Identification of genetic polymorphism in the MDR-1 gene.
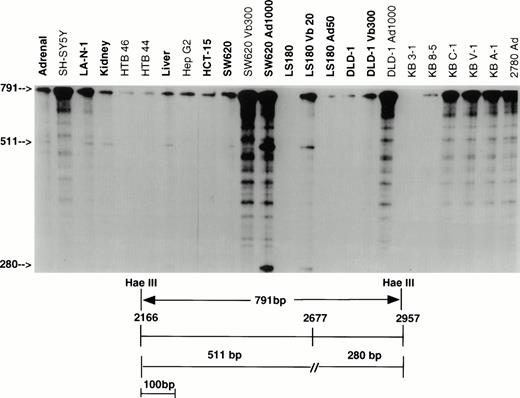
As part of a study examining the frequency and nature of point mutations, overlapping fragments representing the entire MDR-1coding sequence were isolated from a full-length KB C-1 cDNA, and subcloned in pGEM-3Z vectors. These fragments were used to generate probes which allowed examination of the complete coding sequence. Two fragments identified mismatches representing transcripts from different alleles. Figure 1 presents the results using the 791-bp Hae III fragment which covers residues 2166 to 2957 to screen a panel of 24 samples including normal tissues, unselected cell lines, and drug selected cell lines. Protection of only full-length probe was found in 11 of 24 samples, indicating that in these samples the sequence of all transcripts was complementary to the probe and hence identical to that of the KB C-1 cDNA from which the probe was derived (SH-SY5Y, HTB46, HTB44, HepG2, SW620 Vb300, DLD-1 Ad1000, KB 8-5, KB C-1, KB V-1, KB A-1, 2780 Ad). In 12 samples (shown in bold), protection of full-length probe as well as two additional fragments was observed, representing transcripts from two different alleles (Adrenal, LA-N-1, Kidney, Liver, HCT-15, SW620, SW620 Ad1000, LS180, LS180 Vb20, LS180 Ad50, DLD-1, and DLD-1 Vb300; smaller size fragments poorly visualized in this figure for HCT-15, LS 180, LS 180 Ad50, and DLD-1). The additional two fragments resulted from a single base pair mismatch at position 2677, a difference previously reported as a G to T change which results in an amino acid change from Ala to Ser.28 29 Samples expressing both messages have three bands which represent either full protection of the probe (791 bp) or the fragments arising as a result of the single base pair mismatch (511 bp and 280 bp). No signal was detected in KB 3-1.
RNase protection analysis with the 791-bp Hae III probe (residues 2166 to 2957). RNA from 11 of 24 samples protects a full-length fragment, indicating that 791 bp of sequence identify with KB C-1 from which the probe was derived. RNA from 12 of 13 remaining samples (bold) protects both full-length probe and two additional fragments of 511 bp and 280 bp as a result of a mismatch at position 2677 (includes HCT-15, LS180, LS180 Ad50, DLD-1, and DLD-1 Vb300 not well visualized here). Vb, vinblastine; Ad, adriamycin.
RNase protection analysis with the 791-bp Hae III probe (residues 2166 to 2957). RNA from 11 of 24 samples protects a full-length fragment, indicating that 791 bp of sequence identify with KB C-1 from which the probe was derived. RNA from 12 of 13 remaining samples (bold) protects both full-length probe and two additional fragments of 511 bp and 280 bp as a result of a mismatch at position 2677 (includes HCT-15, LS180, LS180 Ad50, DLD-1, and DLD-1 Vb300 not well visualized here). Vb, vinblastine; Ad, adriamycin.
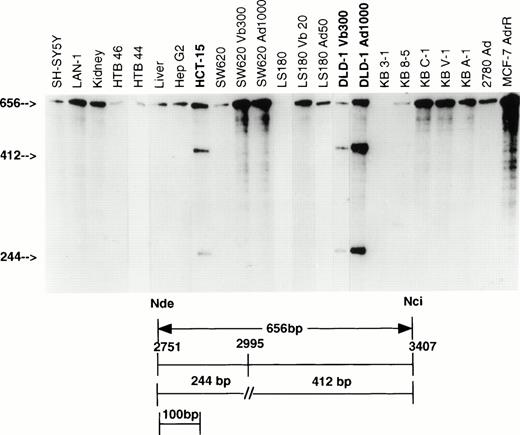
Similar observations were made with the 656-bp Nde/Nci probe which covers residues 2751 to 3407, as shown in Fig2. With this probe, 19 of the 23 samples showed only full-length protection of the probe representing identity of sequence to the KB C-1 cDNA from which the probe was obtained. No signal was detected in KB 3-1. Four other samples (designated in bold type) showed two additional bands representing fragments protected by transcripts arising from a different allele. These samples were HCT-15, DLD-1 Vb300, DLD-1 Ad1000, and DLD-1; results not shown for parental DLD-1 cells. These samples protect fragments of 412 and 244 bp in length which result from a single base pair mismatch at position 2995. Sequence analysis of a PCR-amplified fragment showed a G to A substitution at this site. (GCC to ACC; Ala to Thr). In the screen, only these two sites of genetic polymorphism were identified, indicating that the coding sequence of the MDR-1gene exhibits a high degree of conservation. Most unselected cell lines and normal tissues had no mismatches, or one mismatch, and only two (DLD-1 and HCT-15) had two.
RNase protection analysis with the 656-bp Nde/Nci probe (residues 2751 to 3407). RNA from 19 of 23 samples protects a full-length fragment, indicating 656 bp of sequence homology with the KB C-1 cDNA from which this probe was derived. RNA from three samples (bold) protects two additional fragments of 412 bp and 244 bp in length as a result of a mismatch at 2995 (similar results in DLD-1, RNA not shown). Vb, vinblastine; Ad, adriamycin.
RNase protection analysis with the 656-bp Nde/Nci probe (residues 2751 to 3407). RNA from 19 of 23 samples protects a full-length fragment, indicating 656 bp of sequence homology with the KB C-1 cDNA from which this probe was derived. RNA from three samples (bold) protects two additional fragments of 412 bp and 244 bp in length as a result of a mismatch at 2995 (similar results in DLD-1, RNA not shown). Vb, vinblastine; Ad, adriamycin.
Frequency of genetic polymorphism and relative expression in normal tissues and in unselected cell lines.
Having identified the sites of genetic polymorphism, and for residue 2995, having deduced the nucleotide sequence, we sought to answer two additional questions: (1) the frequency of genetic polymorphism, and (2) the relative expression of alleles, with emphasis on whether the relative expression from individual alleles in normal tissues, unselected and drug selected lines, and patient samples differed.
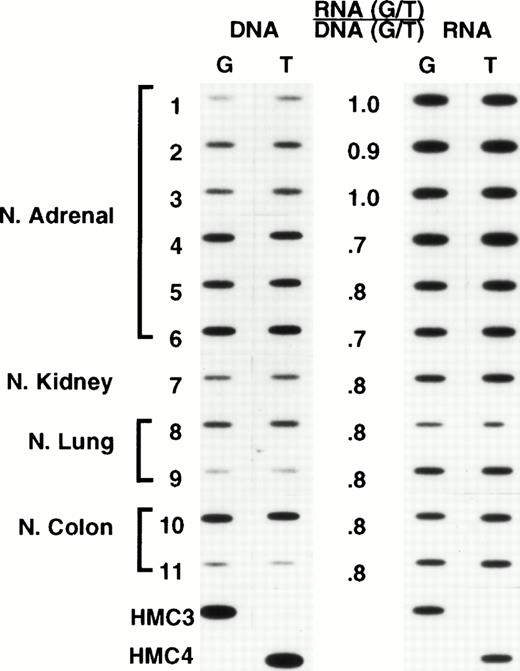
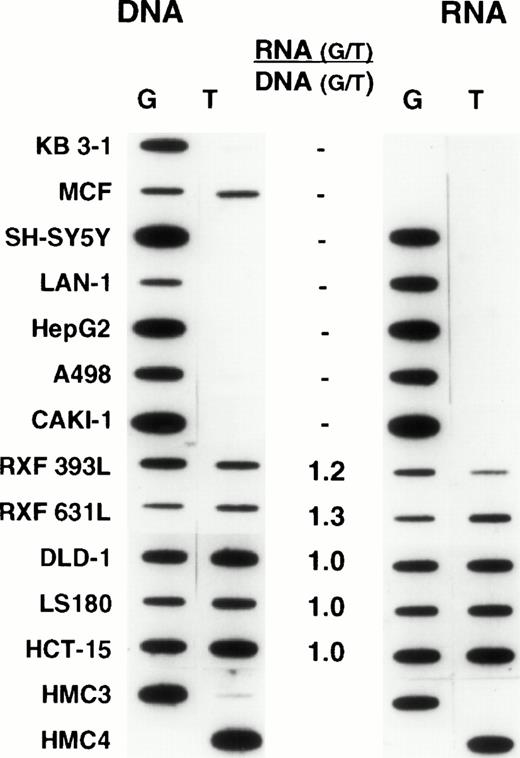
We recognized that expression from individual alleles could differ, and that a genetically heterozygous cell could appear at the RNA level to be homozygous. Thus, we chose oligonucleotide hybridization, as our method of screening, having previously established that this method could be accurately used to quantitate relative levels of expression, provided that appropriate controls were used (L.A.M., unpublished observations). The analyses were performed by carrying out PCR for 30 cycles. For many samples this meant that plateau had been reached, and thus the results do not provide an accurate representation of the absolute levels of MDR-1 expression, precluding a comparison of absolute levels among samples. This was not the intent of this analysis. However, the analysis does provide a reliable measure of the relative levels of expression (or for DNA, the relative number of copies) of each allele in a given sample. Representative results are shown in Figs 3 and4. For each sample, the relative amounts of genomic copies and the relative levels of RNA expression are depicted on the left and right, respectively. It was expected that heterozygous normal tissues would have equal amounts of each allele in genomic DNA and equal allelic expression. However, the frequent occurrence of aneuploidy in human tumor cell lines raised the possibility that differences in the number of copies of each allele could result in differences in the relative levels of expression. Thus, relative levels of expression were determined by dividing the relative values obtained in analyzing RNA expression by the relative levels of each allele in genomic DNA. These are presented numerically in the middle column of both figures. In the normal tissues shown in Fig 3, comparable levels of genomic copies and allelic expression were observed. Likewise, in the unselected cell lines shown in Fig 4, the relative levels of expression also approached unity (similar results were observed in a larger set of samples described below, data not shown). These results thus established equal expression from individual alleles as the norm and allowed us to expand our sample size for determining the frequency of polymorphism by using a large number of previously isolated RNAs from unselected cell lines and normal tissues. Thus, when polymorphism at residue 2677 was examined in an additional 26 unselected cell lines previously identified as expressing Pgp, 15 were found to be heterozygous, with the rest homozygous for either allele (8 for G and 3 for T at position 2677). A similar analysis performed with RNA from 42 normal tissues expressingMDR-1/P-glycoprotein found 13 heterozygous samples and 29 homozygous (21 for G and 8 for T at position 2677). Combining the normal tissues and unselected cell lines in the initial screen (Fig 1) with the findings in the additional 26 cell lines and 42 normal tissues, the following results were obtained in 83 samples: 36 (43%) heterozygous; 35 (42%) homozygous for G, and 12 (15%) homozygous for T at position 2677.
Normal tissues: Oligonucleotide hybridization of PCR-amplified DNA and RNA is shown on the left and right of the figure, respectively. The results were quantified by dividing the ratio of RNA expression by the ratio of genomic copies in DNA. A ratio of 1 indicates that both alleles are expressed at comparable levels. HMC-3 and HMC-4 are control oligonucleotides having a G and a T at position 2677. Samples 1 through 6, normal adrenal gland; 7, normal kidney; 8 and 9, normal lung; 10 and 11, normal colon.
Normal tissues: Oligonucleotide hybridization of PCR-amplified DNA and RNA is shown on the left and right of the figure, respectively. The results were quantified by dividing the ratio of RNA expression by the ratio of genomic copies in DNA. A ratio of 1 indicates that both alleles are expressed at comparable levels. HMC-3 and HMC-4 are control oligonucleotides having a G and a T at position 2677. Samples 1 through 6, normal adrenal gland; 7, normal kidney; 8 and 9, normal lung; 10 and 11, normal colon.
Unselected human cancer cell lines: Oligonucleotide hybridization of PCR-amplified DNA and RNA from unselected human cancer cell lines is shown on the left and right of the figure, respectively. The results are quantified as in Fig 3. Cell lines homozygous for one allele show expression of this allele exclusively. Most heterozygous cell lines have relative levels of expression approaching unity. KB 3-1 and MCF-7 express no MDR-1. HMC-3 and HMC-4 are control oligonucleotides slotted as internal controls as described in Fig 3.
Unselected human cancer cell lines: Oligonucleotide hybridization of PCR-amplified DNA and RNA from unselected human cancer cell lines is shown on the left and right of the figure, respectively. The results are quantified as in Fig 3. Cell lines homozygous for one allele show expression of this allele exclusively. Most heterozygous cell lines have relative levels of expression approaching unity. KB 3-1 and MCF-7 express no MDR-1. HMC-3 and HMC-4 are control oligonucleotides slotted as internal controls as described in Fig 3.
When similar studies were performed to evaluate the frequency of genetic polymorphism at position 2995, different results were obtained. At this site, 4 (11%) samples were heterozygous, whereas the remaining 32 (89%) were homozygous for G. Because of the low frequency of heterozygous samples at this site, subsequent studies examining genetic polymorphism principally examined heterozygosity at position 2677.
Allelic expression in drug selected cell lines and in circulating cells and tumor samples from patients with relapsed lymphoma.
Having established equal expression from individual alleles as the norm, we examined relative allelic expression in drug selected cell lines. In a number of cell lines isolated after exposure to increasing concentrations of adriamycin, vinblastine, or vincristine, preferential overexpression of a single allele was observed (Fig 8 and data not shown). Although in many cases gene amplification had occurred and preferential expression of a single allele (the amplified allele) would be expected, similar results were observed in cell lines without gene amplification (Fig 8 and data not shown). Because expression of both alleles had been established as the norm for normal tissues and unselected cell lines, overexpression of a single allele was identified as an acquired phenotype.
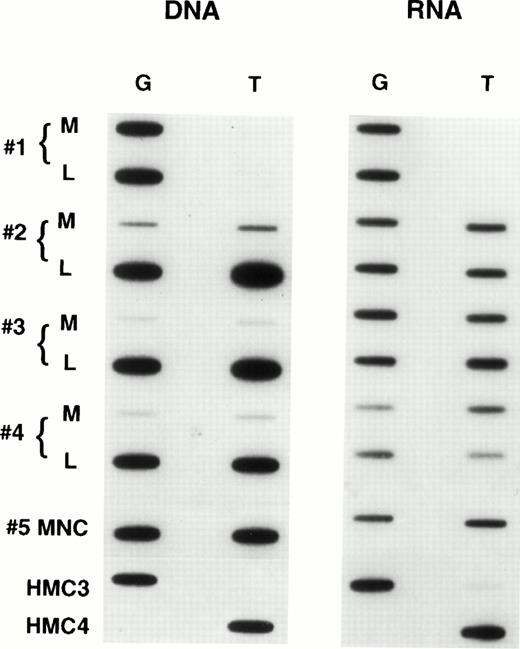
When we examined samples obtained from patients with refractory lymphoma, observations similar to those in the selected cell lines were made. Figure 5 shows the results in tumor samples obtained from patients with refractory lymphoma before enrollment on a salvage therapy regimen termed EPOCH.21 The figure contains predominant samples whose genomic analysis showed a heterozygous pattern. As can be seen, a large percentage of such patient samples express only one allele, in the same way that the drug selected cell lines expressed one allele. In all, we examined 60 specimens, and found 34 to be homozygous at position 2677 and consequently not helpful in determining allelic expression. However, 26 patients were genetically heterozygous, and 8 (30%) of these were shown to express one allele exclusively or predominantly. That this pattern of expression is not a consequence of prior drug exposure of any cell is supported by the results in Fig6, which shows allelic expression in the circulating mononuclear cells of four patients who were genetically heterozygous. These normal cells express both alleles at comparable levels, as had been previously shown for normal tissues (similar results were observed in two other patient samples). In addition, in five tumor samples obtained from patients at the time of presentation (before any therapy), disproportionate expression of alleles was not observed (not shown). Further evidence that the expression of a single allele is an acquired phenotype during the course of drug therapy and the development of drug resistance is shown in Fig 7. This composite shows the relative expression of individual alleles in serial samples obtained from a patient treated over several years with six different chemotherapy regimens, all of which contained “MDR-1 drugs.” Initial samples show a normal pattern of expression of both alleles, but over time, this pattern evolves to that seen in drug resistant cell lines, predominant expression of a single allele, coincident with the increases in the levels of MDR-1.Note that the MDR-1 expression increased nearly 24-fold during this period (0.5 to 11.7) and that the relative expression which was close to unity at the outset increased to 17.7 in the last sample, even as the relative genomic levels remained unchanged.
Expression of individual alleles in tumor samples obtained from patients with refractory lymphoma.
Expression of individual alleles in tumor samples obtained from patients with refractory lymphoma.
Expression of individual alleles in circulating mononuclear cells obtained from patients with refractory lymphoma.
Expression of individual alleles in circulating mononuclear cells obtained from patients with refractory lymphoma.
Expression of individual alleles in a patient with refractory lymphoma over time. The MDR-1 level determined by quantitative PCR as well the percent of normal and malignant cells in the biopsies are tabulated. Over time, the patient was treated with multiple regimens, all of which contained “MDR-1 drugs.”
Expression of individual alleles in a patient with refractory lymphoma over time. The MDR-1 level determined by quantitative PCR as well the percent of normal and malignant cells in the biopsies are tabulated. Over time, the patient was treated with multiple regimens, all of which contained “MDR-1 drugs.”
We have previously identified gene rearrangement as a mechanism of activation of MDR-1 expression.26 We considered this a possible mechanism for expression of a single allele, because rearrangements are rare events and would not be expected to occur twice in one cell activating both alleles. Because we had only minimal amounts of sample from the patients, precluding in-depth molecular studies, we isolated two multidrug resistant sublines from a Burkitt lymphoma cell line (EW 36)16 by exposing cells to increasing concentrations of vincristine. As shown in Fig8A, compared with parental cells, the resistant sublines have elevated levels of MDR-1 as detected by Northern analysis using an MDR-1 probe. Furthermore, when expression was examined by oligonucleotide hybridization as shown in Fig 8B, the parental cell line was shown to be heterozygous, without detectable RNA expression. However, with drug selection, overexpression of a single allele (G allele) was observed, with evidence in the VCR60 subline of gene amplification as evidenced by the greater intensity of the G signal compared with the T in the DNA blot. Using the 5′ RACE methodology, 252 bp of novel sequence not found in GenBank were identified proximal to the MDR-1 gene, in agreement with previous observations showing that gene rearrangements lead to the generation of hybrid genes composed of non–MDR-1 sequences fused to MDR-1proximal to residue −194 (Fig 8E).16 Somatic Cell Hybrid analysis localized these sequences to chromosome 7 (data not shown). A hybrid product composed of the novel 252 bp and the first 67 bp ofMDR-1 was isolated, cloned, and used in an RNase protection assay. As shown in Fig 8C, in RNA from the parental cell line, expression of the hybrid product cannot be detected, although the 252 bp of novel sequence are protected, suggesting these are constitutively expressed in the parental cells. In contrast, in RNA from the resistant subline, full-length protection of the 319-bp hybrid product was observed consistent with expression of this hybrid MDR-1 gene in the resistant cell line. Protection of the 252 bp corresponding to the novel sequences continues to be observed in RNA from the resistant subline, an observation that would be consistent with continued expression of these sequences from another allele that was not involved in the rearrangement with MDR-1. These observations are extended in Fig 8D, which shows expression of the 252 bp of novel sequence using the PCR in all cell lines and normal tissues examined. In contrast, a hybrid product of 229 bp composed of a portion of the 252 bp of novel sequence and MDR-1 was only detected in the resistant subline, and not in the other samples, which include numerous cell lines and normal tissues which express MDR-1endogenously.
DISCUSSION
With the exception of the X chromosome, which in men is present in single copy and in women is rendered single copy by the random inactivation of one of the two X chromosomes in each cell, all other chromosomes and the genes therein are present in duplicate in most normal cells. Classical Mendelian genetics is predicated on the expression of each of these two alleles, be they dominant or recessive. Hybrid physical features have long been recognized as evidence of this coexpression, and studies of hemoglobinopathies have documented expression of both normal and mutant proteins. However, with the exception of a select group of genes which are imprinted during development, surprisingly little has been reported about allele expression at a molecular level.4-9 The expression of genetic polymorphism in the MDR-1 gene provided a tool to examine the expression of individual alleles. With the goal of examining differential expression during the course of drug selection both in vitro and in patients, we proceeded to characterize expression in normal tissues, unselected and drug selected cell lines, and human tumors to determine the degree of coregulation and under what conditions deviations from this may occur. Our results show that normal tissues and unselected cell lines express both alleles. However, disproportionate expression of one allele can occur during the course of drug selection in vitro or in the clinic. Also, expression of a single allele can be a manifestation of a hybrid gene product, which previous studies have shown occur after gene rearrangements leading to activation of MDR-1.26
The first step in this analysis involved the screening of a large number of samples by RNase protection. These samples, including normal tissues, unselected, and drug selected cell lines, were screened for mutations using overlapping fragments encoding the entire MDR-1sequence. Using this approach, the sequence of MDR-1 was shown to be highly conserved, with mismatches representing allelic polymorphism identified at only two sites—nucleotide residues 2677 and 2995. The majority of unselected cell lines and normal tissues had no or one mismatch, and only two (DLD-1 and HCT-15) had two.
To determine expression from individual alleles in a large number of samples, we used the technique of oligonucleotide hybridization. Recognizing the frequency with which aneuploidy occurs in tumors, we corrected all ratios of RNA expression by dividing by the ratio of alleles in genomic DNA. We sought first to examine normal tissues expressing MDR-1. Tissues which were heterozygous were found to have similar genomic levels of each allele, and these were similarly expressed. Although this observation was in part anticipated, it established coexpression at similar levels as the norm, and any significant deviation from this as an acquired change. Similar analyses in unselected cell lines found comparable levels of expression in all cell lines with only a single exception, suggesting that in malignant cells, expression continues to be under normal regulatory controls. The identification of genetic polymorphism also allowed the investigation of the control of expression after the addition of agents known to induce MDR-1 expression, including sodium butyrate, cycloheximide, and calcium channel blockers.23 30 Treatment of parental LS 180, DLD-1, and HCT-15 cells with these agents resulted in a comparable increase in expression of both alleles, suggesting that both alleles are under similar regulatory controls (data not shown).
In contrast, in drug selected cell lines and in patient samples obtained from previously treated patients, overexpression of a single allele occurs frequently. Because this was observed in vitro in cell lines with acquired resistance, it suggests that a large percentage of our samples obtained from patients with refractory lymphoma have acquired overexpression of MDR-1 during the course of therapy. How this might occur is shown by the results in the resistant sublines derived from the malignant Burkitt lymphoma cell line. A hybrid message composed of non–MDR-1 sequences fused proximal toMDR-1 at residue −194 was identified. Similar observations have been previously shown to occur after gene rearrangement (unpublished results and Mickley et al26). Increased expression of MDR-1 after a chromosomal rearrangement should lead to activation of a single allele, an observation we have previously made in a number of drug selected cell lines and in a few leukemia samples (Mickley et al26 and unpublished observations). Alternately, mutations in a regulatory element or changes in methylation patterns could lead to overexpression of a single allele.
The results observed in the patient samples obtained from previously treated refractory patients suggest that clonal selections occur during the course of therapy. The most likely explanation for expression of one allele is that all cells are the offspring of a single cell which acquired a “one allele phenotype.” It would be highly unlikely that this occurred for the same allele in millions of individual cells. We have made similar observations in cell culture. Furthermore, because expression of a single allele is an acquired phenotype, the results in these patient samples support the idea that MDR-1 played a role in drug resistance in these tumors during the course of therapy. Finally, although the patient samples shown in Fig 5 which express a single allele are composed of samples which preferentially express the WT allele, our results indicate that this is a random process. Tabulation of results in numerous drug selected cell lines found an equal likelihood of overexpression of either allele, suggesting that neither has distinct advantage (data not shown).
In summary, the work described herein has documented a high degree of conservation of the primary sequence of the MDR-1 gene. Identification of genetic polymorphism allowed us to examine expression from individual alleles. At a molecular level, expression of individual alleles has been shown to be similar in normal tissues and in unselected cell lines. Deviations from this pattern are likely to represent an acquired change, as shown in drug resistant cell lines and samples from patients with refractory lymphoma. A possible explanation for this phenomenon is gene rearrangement with activation ofMDR-1 after juxtaposition of MDR-1 to a constitutively transcribed gene. The sensitivity of the methodology described will hopefully aid in understanding the mechanisms whereby gene activation occurs during transformation, drug selection, and other disease states, both in vitro and in the clinic.
Address reprint requests to Tito Fojo, MD, PhD, Medicine Branch, DCS, NCI, Bldg 10 Room 12N226, 9000 Rockville Pike, Bethesda, MD 20892.
The publication costs of this article were defrayed in part by page charge payment. This article must therefore be hereby marked “advertisement” in accordance with 18 U.S.C. section 1784 solely to indicate this fact.



This feature is available to Subscribers Only
Sign In or Create an Account Close Modal