Abstract
A new human leukemia cell line, KT-1, was established from a patient in the blastic crisis phase of chronic myelogenous leukemia (CML). This cell line had a positive reaction for intracytoplasmic myeloperoxidase and two Philadelphia chromosomes (Ph1) [t(9;22)(q34;q11)] and lacked normal copies of chromosomes 9 and 22. Molecular characterization of the breakpoint in the t(9;22)(q34;q11) showed that KT-1 had a bcr-2/abl-2 splice junction. When the KT-1 cells were cultured with interferon (IFN)-α or IFN-γ, the growth of the cells were dose-dependently suppressed. IFN-α and IFN-γ exerted synergistic suppressive effects on the growth of KT-1 cells. Furthermore, IFN-α suppressed the expression of the bcr-ablfusion gene in KT-1 cells, and induced G1 cell-cycle arrest and apoptotic cell death. The KT-1 cell line should be a valuable tool for studying the molecular mechanism of the suppression of Ph1clone cells from CML by IFN.
CHRONIC MYELOGENOUS leukemia (CML) is a clonal myeloproliferative disorder resulting from oncogenic transformation of a hematopoietic stem cells. The hallmarks of CML include Philadelphia chromosome (Ph1) translocation [t(9;22)(q34;q11)]1 and consistent molecular genetic aberrations. The c-abl proto-oncogene, normally located on chromosome 9q34, is moved to chromosome 22q11 and juxtaposed with a breakpoint cluster region (bcr).2 The abnormal configuration results in the creation of a hybrid bcr-ablfusion gene, which transcribes a novel 8.5-kb mRNA.3 Thebcr-abl fusion transcript forms an abnormal 210-kD protein with augmented tyrosine kinase enzymic activity.4,5 These molecular changes are thought to play a significant role in the pathogenetics of this malignancy and confer a growth advantage on Ph1-positive CML cells over normal hematopoietic precursors. On the other hand, bcr-abl fusion protein induces the suppression of apoptotic cell death that results in the accumulation of myeloid cells to a greater extent.6-8Indeed, the bcr-abl fusion protein has shown its oncogenic potential by transforming hematopoietic progenitor cells in vitro and in vivo.9,10 Interferon (IFN) is the most efficient treatment for CML patients who cannot undergo allogeneic bone marrow transplantation.11-14 In approximately 10% to 20% of patients under IFN-α therapy, the bone marrow is rendered negative for the Ph1 chromosome, indicating cytogenetical remission.12,14,15 Moreover, reverse-transcriptase polymerase chain reaction (RT-PCR) amplification does not detectbcr-abl mRNA transcripts in bone marrow cells from some CML patients who maintain cytogenetic remission,16,17 although, even in these cases, bcr-abl transcripts persist in single progenitor colonies. However, the exact mechanism of the inhibitory action of IFN has been unknown. Here, we describe the establishment and characterization of a new human leukemia cell line derived from a CML patient in the blastic crisis phase, which we designated KT-1. KT-1 carried two copies of the Ph1 chromosome and lacked normal copies of chromosomes 9 and 22. Either IFN-α or IFN-γ suppressed the growth of KT-1 cells. Furthermore, we have demonstrated that IFN-α suppressed the expression level of bcr-abl mRNA in KT-1 cells, and induced G1 cell-cycle arrest and apoptotic cell death. We suggest that the KT-1 cell line will be valuable for investigating the mechanism of the suppressive effects of IFN on Ph1 clones from CML.
MATERIALS AND METHODS
Case report.
The cell line described here was derived from peripheral blood from a 32-year-old man with CML in blastic crisis. In December 1991, he was diagnosed with CML. Karyotypes of his bone marrow cells showed that they were 46, XY, t(9;22)(q34;q11). The patient was treated with busulfan and 6-mercaptopurine. On February 24, 1994, he was admitted because of fever and back pain. His peripheral blood count results were as follows: red blood cells (RBCs), 312 × 104/μL; hemoglobin, 7.9 g/dL; hematocrit, 23.7%; platelets, 2.8 × 10⁴/μL; and white blood cells (WBCs), 1.8 × 10⁴/μL, with 49% blasts. The bone marrow had an 8.8 × 10⁴/μL nucleated cell count (NCC), with 67% blasts. Cytogenetic analysis of bone marrow cells showed 50, XY, +8, +8, t(9;22)(q34;q11), t(9;22)(q34;q11), +19, +19. The patient's blasts were negative for myeloperoxidase (MPO), terminal deoxynucleotidyl transferase (TdT), and lymphoid antigens, except for CD4 and CD7, and were positive for CD33 antigen. He was diagnosed as having CML in blastic crisis. Chemotherapy, initially with vincristine and prednisolone and subsequently with cytarabine and aclarubicin, showed no effects. The patient died of cerebral bleeding on March 18, 1994.
Cell culture.
Mononuclear cells (MNCs) were isolated from the patient's peripheral blood in the blastic crisis phase, using a Ficoll-conray gradient. The MNCs were suspended in RPMI 1640 medium supplemented with 10% fetal calf serum (FCS; GIBCO, Grand Island, NY) in 24-well tissue culture plates (Corning Glass Works, Corning, NY) and incubated at 37°C in a humidified atmosphere of 5% CO2. Half of the medium was replaced twice weekly. When the cell line had been established, cells were maintained in tissue culture flasks (no. 3013; Falcon, Oxnard, CA).
Cell morphology and cytochemical stainings.
A cytocentrifuge preparation of cells was made by using a Shanden Cytospin (Shandon Southern Product, Cheshire, UK) and stained with May-Grünwald-Giemsa solution. The cells were also cytochemically stained for MPO, naphtol ASD chloroacetate esterase (CAE), alpha-naphthyl butyrate esterase (NBE), periodic acid–Schiff (PAS), and TdT.
Intracytoplasmic staining.
Immunocytochemical staining for intracytoplasmic MPO was determined by means of the alkaline phosphatase/anti–alkaline phosphatase (APAAP) technique using the monoclonal antibody, MPO7 (Dakopatts A/S, Santa Barbara, CA).18
Surface-marker analysis.
Surface markers of cells were analyzed by fluorescence-activated cell sorting (FACS). The monoclonal antibodies used recognized the following antigens: CD2, CD3, CD4, CD8, and CD11b, which were purchased from Ortho (Ortho Diagnostic Systems, Raritan, NJ); CD5, CD10, CD19, CD20, HLA-DR, CD34, and CD41a, which were purchased from Becton Dickinson (Mountain View, CA); and CD13, CD14, and CD33, which were purchased from Coulter Immunology (Hialeah, FL). These antibodies were used in a direct staining technique.
Cytogenetic analysis.
Cytogenetic analysis was performed on KT-1 cells in the logarithmic growth phase. Cells were treated with 0.075 mol/L potassium chloride hypotonic solution for 30 minutes at 37°C and fixed in methanol acetate. Chromosomes were banded by the trypsin-Giemsa method.19
Analysis for bcr rearrangement.
Fifteen micrograms of DNA of KT-1 cells was digested with the restriction enzymes, BglII and BamHI, electrophoresed on 0.8% agarose gel, blotted, and hybridized. After hybridization, the filters were washed, dried, and autoradiographed.
Analysis of the bcr-abl splice junction.
Northern blot analysis of bcr-abl mRNA expression.
KT-1 cells or K562 cells (5 × 10⁷ cells) were incubated with IFN-α (1,000 U/mL) or IFN-γ (1,000 U/mL) for various times. IFN-α and IFN-γ were kindly provided by Sumitomo Pharmaceutical (Tokyo, Japan) and Shionogi Pharmaceutical (Tokyo, Japan). Total cellular RNA was isolated from the cells by the hot-phenol method. The cellular RNA was run on a 1.1% agarose gel, transferred to nitrocellulose filters, and hybridized to 32P-labeled DNA probes. The 1.2-kb bcr probe (Oncogene Science, Uniondale, NY) was isolated from the 5′ portion of bcr. Human glyceraldehyde-3-phosphate dehydrogenase (G3PDH) cDNA was used as a control to assess differences in the amount of RNA loaded on the gel. The filters were then washed, air-dried, and autoradiographed.
Cell-cycle analysis.
KT-1 cells were incubated with IFN-α (1,000 U/mL) or IFN-γ (1,000 U/mL) for various times. The percentage of KT-1 cells in each phase of the cell cycle was determined by flow cytometry using a FACScan (Becton Dickinson). The cellular DNA content was measured after propidium iodide staining, and the percentage of cells in each phase was calculated by the sum of broadened rectangles method.
Detection of apoptotic cells.
To identify apoptotic cell death, the method of TdT-mediated dUTP-biotin nick end labeling (TUNEL) was tested.22 KT-1 cells were incubated with IFN-α (1,000 U/mL) or IFN-γ (1,000 U/mL) for various times. At the end of the incubation, cells were fixed in 4% buffered formaldehyde and spread on polylysine-coated slides. Subsequently, TUNEL staining was tested on cells. TUNEL-positive cells were determined by stained nuclei.
Effects of IFN-α and/or IFN-γ in liquid culture.
To examine the effects of IFN-α and/or IFN-γ, the patient's leukemic cells, KT-1, K562, KU812, KCL-22, or YOS-M, were seeded at 2 × 10⁵ cells/mL in 2 mL RPMI 1640 containing 10% FCS with or without IFN-α and/or IFN-γ. After culture for 7 days, viable cells were counted by the trypan blue dye exclusion test. In some experiments, viable cells were counted every day after IFN-α or IFN-γ treatment. For morphologic analysis, cytospin slides were prepared in a Shanden Cytospin and stained with May-Grünwald-Giemsa solution. In some experiments, granulocyte colony-stimulating factor (G-CSF), granulocyte-macrophage colony-stimulating factor (GM-CSF), or interleukin-3 (IL-3) was added to the cultures. G-CSF, GM-CSF, and IL-3 were kindly provided by Kirin Brewery (Gunma, Japan).
Effects of IFN-α and/or IFN-γ in semisolid culture.
KT-1 cells and K562 cells were cultured in semisolid medium with or without IFN-α and/or IFN-γ. Cells (1 × 10³) were mixed with 1 mL Iscove's modified Dulbecco medium (IMDM) containing 0.8% methylcellulose and 20% FCS with or without IFN-α and/or IFN-γ. Cells were then plated onto a plastic culture dish (no. 1008; Falcon). After incubation for 14 days, colonies that had more than 40 cells were counted under an inverted microscope. Smears of cells from each colony were prepared by cytospin and stained with May-Grünwald-Giemsa solution.
RESULTS
Establishment of the KT-1 cell line.
Two months after culture of the patient's peripheral blood was initiated, expansive proliferation of the cells was observed. Cells were subsequently maintained in continuous culture for 18 months. They grew in suspension with a little aggregation. The established cell line was designated KT-1. The KT-1 cells have since been maintained in RPMI 1640 supplemented 10% FCS with a doubling time of 18 to 24 hours.
Morphological and cytochemical characteristics of KT-1 cells.
In May-Grünwald-Giemsa–stained preparations, KT-1 cells were of blastic appearance. The cells had fine chromatin and round nuclei, and lacked granules in the slightly basophilic cytoplasm. Cytoplasmic protrusions were observed. KT-1 cells were negative for MPO, CAE, NBE, and TdT, and weakly positive for PAS (14.4%). Intracytoplasmic MPO was positive in both KT-1 cells (98.6%) and original leukemic cells (99.2%).
Cell-surface markers.
The original leukemic cells were positive for CD4 (52.7%), CD7 (65.4%), and CD33 (89.4%), and negative for the other lymphoid or myeloid markers. KT-1 cells were also positive for CD4 (58.9%) and CD33 (69.2%), but were negative for CD7 (0.8%). No Epstein-Barr virus nuclear antigen (EBNA) was detected in KT-1 cells (data not shown).
Cytogenetic analysis.
Cytogenetic analysis was performed on more than 100 metaphases of KT-1 cells. All of them showed the same chromosomal abnormality: 51, XXYY, +X, +Y, −5, − 6, +8, +8, t(9;22)(q34;q11), t(9;22)(q34;q11), +19, +19, + unidentified chromosome. The chromosomal abnormality was similar to that of the patient's bone marrow cells: 50, XY, +8, +8, t(9;22)(q34;q11), t(9;22)(q34;q11), +19, +19.
Bcr rearrangement.
The 3′ bcr probe detected a single rearranged band without a germ line band in KT-1 cells, digested by BglII orBamHI. This result was consistent with the cytogenetic analysis, which showed no normal chromosome 22. The T-cell receptor (TCR) and immunoglobulin H (IgH) genes were in germ-line configuration in KT-1 cells (data not shown).
Detection of the bcr/abl splice junction.
RT-PCR showed that the bcr-2/abl-2 junction probe detected a 182-bp product in RNA extracted from KT-1 cells and that KT-1 cells carried a bcr-2/abl-2 splice junction.
Suppression of cell growth by IFN-α and/or IFN-γ.
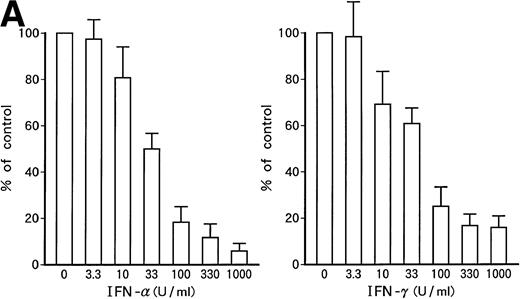
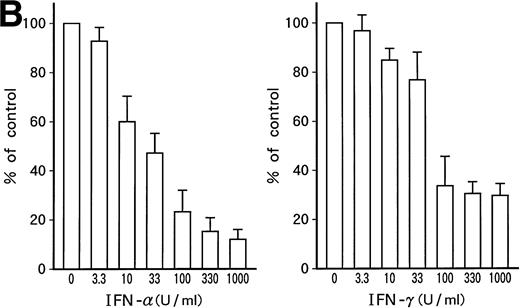
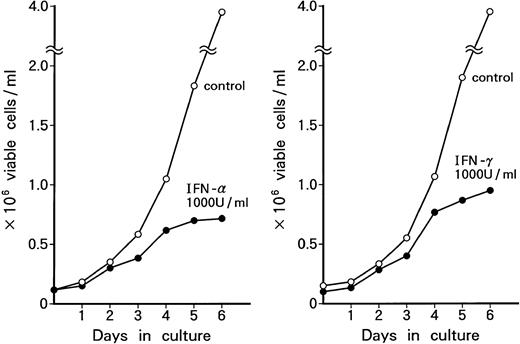
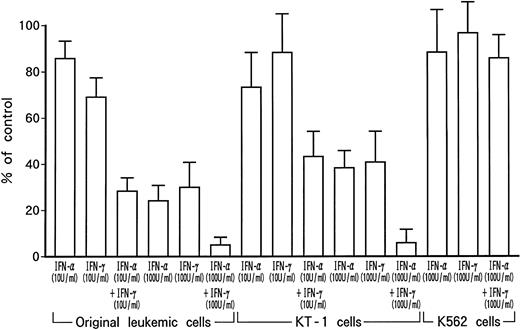
Dose-dependent growth suppression of the patient's original leukemic cells and KT-1 cells by IFN-α or IFN-γ was shown in liquid 7-day culture (Fig 1A and B). The time course of growth suppression demonstrated that the suppressive effects were noted during the first 2 days of IFN-α or IFN-γ induction and continued for 6 days (Fig 2). Furthermore, IFN-α and IFN-γ exerted synergistic growth-suppressive effects on the original leukemic cells and on KT-1 cells (Fig3). IFN-α and/or IFN-γ did not induce cell differentiation of KT-1 cells (data not shown). In semisolid culture, KT-1 cells formed colonies that consisted of undifferentiated blasts without exogenous cytokines. The plating efficiency was 10% to 20%. In semisolid cultures, IFN-α and/or IFN-γ had similar inhibitory and synergistic effects on colony formation by KT-1 cells (Table1). In contrast, IFN-α and/or IFN-γ did not inhibit cell growth of K562 cells in either liquid (Fig3) or semisolid culture (Table 1). IFN-α and/or IFN-γ also did not affect cell growth of KU812, KCL-22, and YOS-M cells (data not shown). The cell growth and differentiation of KT-1 cells in liquid or semisolid culture was not affected by G-CSF, GM-CSF, or IL-3. In addition, these cytokines could not reverse the growth suppression of KT-1 cells by IFN-α (data not shown).
Growth-suppressive effects of IFN-α or IFN-γ on patient's original leukemic cells (A) or KT-1 cells (B). Results are percentages relative to control cultures. Values are means ± SD of 3 experiments.
Growth-suppressive effects of IFN-α or IFN-γ on patient's original leukemic cells (A) or KT-1 cells (B). Results are percentages relative to control cultures. Values are means ± SD of 3 experiments.
Time course of growth-suppressive effects of IFN-α or IFN-γ on KT-1 cells. Cultures were initiated at 0.1 × 10⁶ cells/mL. Cultures were exposed to either IFN-α or IFN-γ for time indicated. Results are comparable with those in 3 experiments.
Time course of growth-suppressive effects of IFN-α or IFN-γ on KT-1 cells. Cultures were initiated at 0.1 × 10⁶ cells/mL. Cultures were exposed to either IFN-α or IFN-γ for time indicated. Results are comparable with those in 3 experiments.
Growth-suppressive effects of IFN-α and/or IFN-γ on KT-1 cells or K562 cells. Results are percentages relative to each control culture. Values are means ± SD of 3 experiments.
Growth-suppressive effects of IFN-α and/or IFN-γ on KT-1 cells or K562 cells. Results are percentages relative to each control culture. Values are means ± SD of 3 experiments.
Colony Formation
| Cytokine . | No. of Colonies (per 1 × 10³ cells) . |
|---|---|
| KT-1 (−) | 176 ± 31 |
| IFN-α (U/mL) | |
| 1 | 152 ± 41 |
| 10 | 65 ± 19 |
| 100 | 28 ± 6 |
| 1,000 | 11 ± 3 |
| IFN-γ (U/mL) | |
| 1 | 162 ± 37 |
| 10 | 102 ± 26 |
| 100 | 49 ± 11 |
| 1,000 | 37 ± 14 |
| IFN-α + IFN-γ (U/mL) | |
| 10 + 10 | 31 ± 8 |
| 100 + 100 | 12 ± 3 |
| K562 (−) | 96 ± 12 |
| IFN-α (U/mL) | |
| 100 | 91 ± 17 |
| 1,000 | 85 ± 24 |
| IFN-γ (U/mL) | |
| 100 | 103 ± 17 |
| 1,000 | 92 ± 29 |
| IFN-α + IFN-γ (U/mL) | |
| 1,000 + 1,000 | 80 ± 13 |
Values are means ± SD in triplicate cultures.
Effects on bcr-abl gene expression by IFN-α or IFN-γ.
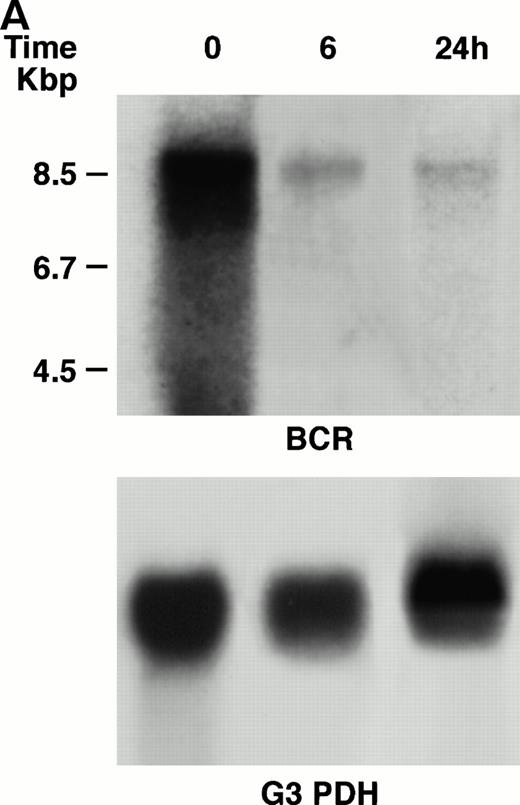
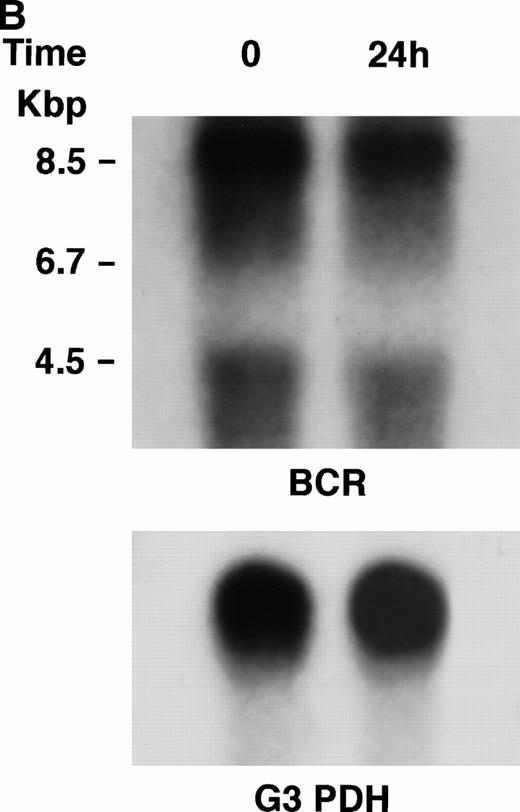
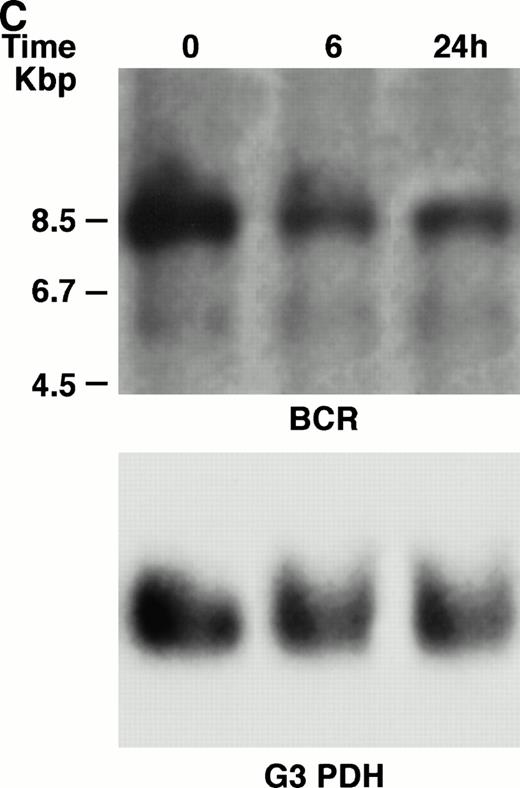
KT-1 cells and K562 cells expressed 8.5-kb aberrant bcr-ablfusion transcripts. K562 cells also expressed a normal 4.5-kbbcr transcript, which KT-1 cells did not express (Fig 4A and B). IFN-α (1,000 U/mL) significantly suppressed bcr-abl gene expression in KT-1 cells from 6 hours on, and its suppressive effects had increased 24 hours after exposure (Fig 4A). IFN-γ (1,000 U/mL) also suppressed bcr-abl gene expression in KT-1 cells. However, its suppressive effect was weak compared with that of IFN-α (Fig 4C). IFN-α (1,000 U/mL) did not affect bcr-abl gene expression in K562 cells (Fig 4B).
(A) Northern blot analysis of IFN-α–treated KT-1 cells. The blot was transferred to nitrocellulose and successfully hybridized to the indicated probes. KT-1 cells were exposed to IFN-α (1,000 U/mL) for indicated times. Time points were 6 and 24 hours' exposure to IFN-α. (B) Northern blot analysis of IFN-α–treated K562 cells. K562 cells were exposed to IFN-α (1,000 U/mL) for 24 hours. (C) Northern blot analysis of IFN-γ–treated KT-1 cells. KT-1 cells were exposed to IFN-γ (1,000 U/mL) for indicated times. Time points were 6 and 24 hours' exposure to IFN-γ.
(A) Northern blot analysis of IFN-α–treated KT-1 cells. The blot was transferred to nitrocellulose and successfully hybridized to the indicated probes. KT-1 cells were exposed to IFN-α (1,000 U/mL) for indicated times. Time points were 6 and 24 hours' exposure to IFN-α. (B) Northern blot analysis of IFN-α–treated K562 cells. K562 cells were exposed to IFN-α (1,000 U/mL) for 24 hours. (C) Northern blot analysis of IFN-γ–treated KT-1 cells. KT-1 cells were exposed to IFN-γ (1,000 U/mL) for indicated times. Time points were 6 and 24 hours' exposure to IFN-γ.
Effects of IFN-α or IFN-γ on the cell cycle of KT-1 cells.
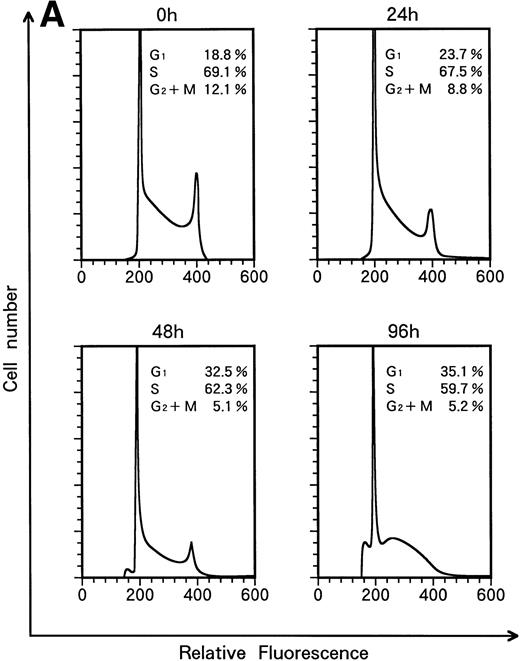
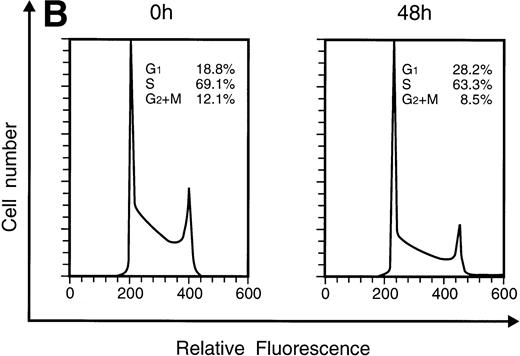
When KT-1 cells were treated with IFN-α (1,000 U/mL), a gradual accumulation of cells in the G1 phase of the cell cycle was observed (Fig 5A). Greater than 35% of the treated cells were in G1 at 96 hours after treatment, whereas 18.8% of untreated cells were in G1. In addition, a decrease in the number of cells in the S and G2/M phases was observed in treated cells. IFN-γ also induced G1 cell-cycle accumulation in KT-1 cells (Fig 5B).
Flow-cytometric analysis of KT-1 cells for analysis of cell-cycle distribution. KT-1 cells were cultured with (A) IFN-α (1,000 U/mL) or (B) IFN-γ (1,000 U/mL) for indicated times. Results are comparable in 3 experiments.
Flow-cytometric analysis of KT-1 cells for analysis of cell-cycle distribution. KT-1 cells were cultured with (A) IFN-α (1,000 U/mL) or (B) IFN-γ (1,000 U/mL) for indicated times. Results are comparable in 3 experiments.
Effects of IFN-α or IFN-γ on apoptotic cell death of KT-1 cells.
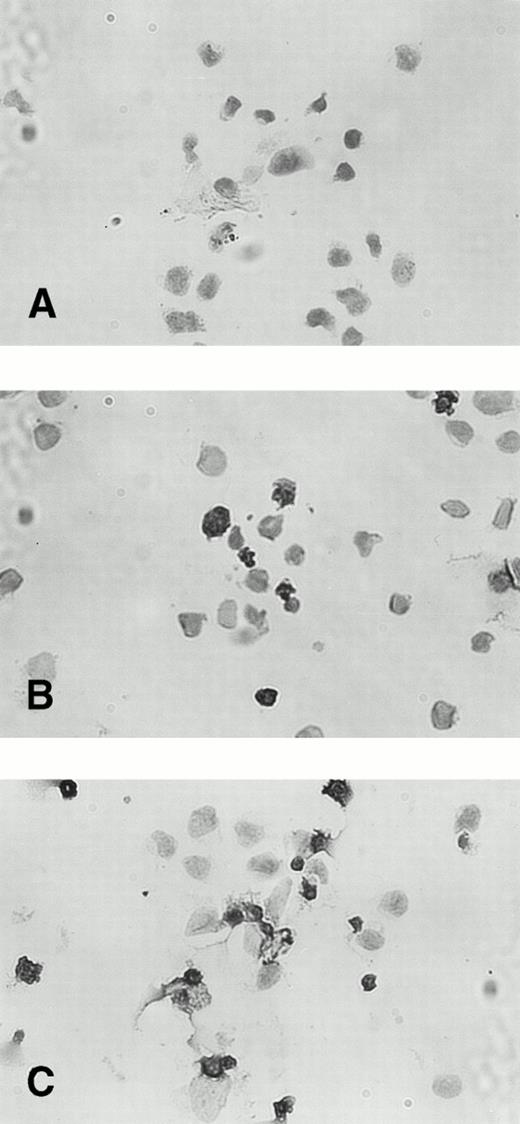
The percentage of TUNEL-positive cells was less than 3% in untreated KT-1 cells. Incubation with IFN-α for 48 hours increased the fraction of TUNEL-stained nuclei to 20%. A longer incubation (96 hours) with IFN-α increased the percentage of TUNEL-positive KT-1 cells to greater than 60% (Fig 6). IFN-γ also induced similar apoptotic cell death of KT-1 cells (data not shown).
TUNEL staining of IFN-α–induced apoptosis in KT-1 cells. KT-1 were cultured with IFN-α (1,000 U/mL) for (A) 0 hours, (B) 48 hours, and (C) 96 hours.
TUNEL staining of IFN-α–induced apoptosis in KT-1 cells. KT-1 were cultured with IFN-α (1,000 U/mL) for (A) 0 hours, (B) 48 hours, and (C) 96 hours.
DISCUSSION
IFNs exert antiviral and antiproliferative activities against a variety of malignant cells.23,24 In particular, IFN-α suppresses the proliferation of Ph1-positive CML cells, induces both hematologic remission and cytogenetic remission with disappearance of Ph1 clones, and provides an improved prognosis.12,14,15 IFN-γ is also clinically useful25,26 and is occasionally administered to CML patients in combination with IFN-α.27 Despite intensive efforts, the mechanism responsible for the specific antiproliferative activity of IFNs in CML remains unknown. Immortalized, continuously growing cell lines facilitate studies of the biology of malignant cells. However, cell lines from CML patients, K562 and KCL-22, are not appropriate for studying the mechanism of growth suppression by IFN, because IFN-α dose not significantly affect the growth of these cell lines.28,29 Furthermore, IFN-α and/or IFN-γ did not inhibit the growth of K562, KCL-22, KU812, and YOS-M cells in our laboratory. These cell lines were derived from leukemic cells in the blastic crisis phase of CML, on which IFNs generally exert no effects in vivo or in vitro, and seem to have lost their growth-suppressive sensitivity to IFNs. Fortunately, leukemic cells from our patient with CML were sensitive to IFN-α or IFN-γ in vitro, even though they were in the blastic crisis phase. Therefore, we tried to obtain an immortalized cell line from the patient and succeeded in establishing a novel cell line, designated KT-1. KT-1 had undifferentiated morphology that exhibited a high nuclear/cytoplasm ratio without cytoplasmic granules. Positive reactions for intracellular MPO and the myeloid marker CD33 indicated that KT-1 cells possessed the features of myeloid-lineage cells. Cytogenetic analysis of KT-1 cells showed that the chromosome abnormalities of KT-1 cells were similar to those of the original leukemic cells. KT-1 cells showed two Ph1chromosomes and an absence of normal copies of chromosomes 9 and 22. These results demonstrate that KT-1 cells acquired two Ph1chromosomes from the patient's leukemic cells. The 3′ bcrprobe detected a single rearrangement band without a germ-line band in KT-1 cells. This finding is consistent with the cytogenetic analysis that showed no normal chromosome 22.
IFN-α suppressed the growth of KT-1 cells dose-dependently both in suspension and in semisolid culture. The bcr-abl fusion transcript, p210bcr/abl protein,4,5 confers a growth advantage to CML cells over normal precursors and also suppresses the apoptotic machinery of CML cells.6-8Therefore, we have studied the effects of IFN-α on the expression of the bcr-abl fusion gene in KT-1 cells. IFN-α suppressed the expression of the bcr-abl fusion gene significantly in KT-1 cells within 6 hours and its suppressive effects had increased after 24 hours, whereas IFN-α did not affect bcr-abl fusion gene in K562 cells in our laboratory, as previously reported.28IFN-α did not affect the proliferation of KT-1 cells within 24 hours, so the suppressive effects of IFN-α on the expression of thebcr-abl gene preceded the proliferation-inhibition of KT-1 cells. Decreased bcr-abl expression of fresh cells from CML patients accompanied by cell differentiation has been reported.30 However, IFN-α did not induce differentiation of KT-1 cells. Therefore, it seems that the decrease in bcr-ablfusion gene expression induced by IFN-α resulted in the proliferation suppression, but not differentiation, of KT-1 cells. IFN-α induced G1 cell-cycle arrest in KT-1 cells. Furthermore, the rate of apoptotic cells by the TUNEL method was less than 3% without IFN-α treatment, but greater than 60% with IFN-α treatment for 96 hours. The effect of bcr-abl on apoptosis in cells that contain this fusion gene has studied by inhibiting its expression using antisence oligonucleotides. Using murine and human cell lines, bcr-ablantisense oligonucleotides induced a decline in cell number in culture associated with apoptosis.6,8 Therefore, our results suggested that part of the proliferation-suppression mechanism of KT-1 cells by IFN-α depended on the apoptosis associated with the suppression of bcr-abl expression. It has been recently demonstrated that IFN-α increased Fas receptor expression on CML progenitors and Fas-mediated apoptosis was involved in the inhibitory effects of IFN-α in CML.31 Further studies containing Fas-mediated apoptosis are recommended to elucidate the proliferation-suppression mechanism of KT-1 cells by IFN-α.
Synergistic growth-suppressive effects were observed when IFN-α and IFN-γ were combined in vitro.32 In vivo, IFN-α or IFN-γ induced hematologic remission of patients with CML who had failed to improve after therapy with either IFN.25Therefore, treatment with IFN-α in combination with IFN-γ has been tried in CML patients.27 In culture, IFN-γ suppressed KT-1 cell proliferation dose-dependently, as did IFN-α. Moreover, a synergistic effect on proliferation suppression of KT-1 cells was observed between IFN-α and IFN-γ. IFN-α and IFN-γ use different signal-transduction pathways. Binding of IFN-α or IFN-γ to their specific receptors activates different sets of kinases within the JAK family (Jak 1 and Tyk 2 for IFN-α,33,34 or Jak 1 and Jak 2 for IFN-γ34,35), which then leads to the activation of different combinations of Stat proteins.36-38 The synergistic effects between IFN-α and IFN-γ on growth suppression of KT-1 cells might depend on these different signal-transduction pathways. Indeed, IFN-γ, which suppressed the growth of KT-1 cells and induced G1 arrest and apoptosis, as did IFN-α, did not affect thebcr-abl fusion gene mRNA expression in KT-1 cells significantly, whereas IFN-α suppressed it markedly. These results suggest that the growth suppression of KT-1 cells does not always result in the suppression of bcr-abl gene expression and that the antipoliferative effect of IFN-γ in KT-1 cells relies on a genetic mechanism other than modulation of bcr-abl expression, differing from that of IFN-α. More detailed studies of the signal-transduction mechanisms of IFN-α and IFN-γ in KT-1 cells are recommended.
We have reported the establishment and characterization of a new human leukemia cell line, KT-1, derived from a patient with CML in blastic crisis. IFN-α suppressed the proliferation of KT-1 cells and their expression of the bcr-abl fusion gene, and induced their apoptotic cell death. We anticipate that this cell line will be valuable to investigations of the molecular mechanism of suppression of CML cells by IFN-α.
Address reprint requests to Kohsuke Yanagisawa, MD, First Department of Internal Medicine, Ehime University, Shigenobu, Ehime, Japan, 791-02.
The publication costs of this article were defrayed in part by page charge payment. This article must therefore be hereby marked “advertisement” in accordance with 18 U.S.C. section 1734 solely to indicate this fact.

This feature is available to Subscribers Only
Sign In or Create an Account Close Modal