Abstract
Vascular leak syndrome (VLS) is the dose-limiting toxicity observed in clinical trials of immunotoxins containing ricin toxin A chain (RTA). RTA itself is thought to cause VLS by damaging vascular endothelial cells, but the exact mechanism remains unclear. This is partially due to the paucity of appropriate models. To study VLS, we developed an in vitro model in which human umbilical vein-derived endothelial cells were first grown to confluence on microporous supports and then cultured under low pressure in the presence or absence of RTA. Endothelial cell barrier function was assessed by measuring the volume of fluid that passed through each monolayer per unit time. We found that RTA significantly increased monolayer permeability at times and concentrations consistent with the onset of VLS in patients treated with RTA-based immunotoxins. Scanning electron microscopy showed that intercellular gaps formed in endothelial monolayers exposed to RTA. Intercellular gap formation followed endothelial cell death caused by the enzymatic activity of RTA. We conclude that RTA is directly toxic to endothelial cells in vitro and speculate that this contributes to VLS in vivo.
A MAJOR LIMITATION in cancer therapy is nonspecific toxicity. Conventional chemoradiotherapy kills dividing cells, whether they are malignant or not. Immunotoxins kill more selectively because they contain a toxin linked to a targeting moiety that has some specificity for tumor cells.1,2 Specificity can be further enhanced by modifying the toxin itself to reduce or eliminate its ability to bind cells directly.3,4 For the heterodimeric toxin ricin, this is achieved by blocking the galactose-binding sites on the B chain or by removing the B chain entirely and linking the cytotoxic A chain alone to the targeting moiety.1,5 Ricin toxin A (RTA) chain kills cells by inhibiting protein synthesis through the catalytic inactivation of ribosomes.6 RTA specifically cleaves the N-glycosidic bond between the ribose and adenine base at position 4324 in 28S ribosomal RNA.7 The potency of this toxin has been combined with the specificity of various targeting moieties to yield immunotoxins with clinical efficacy, as evidenced by the partial and complete remissions achieved in relapse patients.1 8-12 However, these clinical trials showed that, despite their inherent specificity, essentially all of the RTA-immunotoxins caused a common dose-limiting toxicity called vascular leak syndrome (VLS).
VLS is characterized by hypoalbuminemia, peripheral edema with resultant weight gain, and pulmonary edema in the most severe cases.13 The immunotoxin's cell-targeting moiety is probably not responsible for inducing VLS because this toxicity occurs in patients treated with RTA-immunotoxins of various specificities and with whole antibodies or Fab fragments linked to RTA.1,8-12 RTA itself is therefore thought to cause VLS by damaging vascular endothelial cells. However, the exact mechanism of endothelial cell damage is unclear due, in part, to the paucity of appropriate models for VLS induced by RTA-immunotoxins. There currently are no suitable animal models, because mice, rats, guinea pigs, cynomolgus, and rhesus monkeys do not exhibit VLS when treated with RTA-containing immunotoxins, and there is only one published in vitro model.14-17 Therefore, to study VLS, we developed a model that allows us to measure a relevant consequence of endothelial cell damage over the 2- to 4-day time course in which RTA-immunotoxin–induced VLS occurs clinically.1 8-12
We describe here an in vitro system in which we assess the permeability of human endothelial cell monolayers by measuring the volume of fluid that passes through each monolayer per unit time and area. This system is sensitive and allows us to assess the barrier function of a given monolayer repeatedly for at least 4 days. We find that RTA alone induces significant increases in endothelial cell permeability in a time- and dose-dependent manner. We discuss the implications of these results in terms of VLS.
MATERIALS AND METHODS
Cells.A human umbilical vein-derived endothelial cell culture (HUV-EC-C) frozen at passage 12 was purchased from the American Type Culture Collection (Rockville, MD; catalog no. CRL-1730). This is a nontransformed, near-diploid cell line with a life expectancy of 50 to 60 population doublings.18 Cells at passage 16 through 19 were used in our studies. Pooled primary human umbilical vein-derived endothelial (HUVE) cells were purchased from Clonetics Corp (Walkersville, MD) and were used at passage 4. Unless otherwise indicated, the HUV-EC-C and HUVE cells were maintained in M199 medium supplemented with 15% fetal bovine serum, 1 mmol/L sodium pyruvate, 4.8 mmol/L L-glutamine, 5 U/mL heparin (Sigma, St Louis, MO), 100 U/mL penicillin/streptomycin (Cellox, Hopkins, MN), and 100 μg/mL Endo-Gro (VEC TEC, Inc, Schenectady, NY). The M199 medium and first three supplements were purchased from Life Technologies (Grand Island, NY). The cobblestone morphology of the HUV-EC-C and HUVE monolayers was indistinguishable as visualized by light microscopy.
Toxins and DA7.Whole ricin and deglycosylated RTA chain (dgRTA) were purchased from Inland Laboratories (Austin, TX). An expression vector encoding wild-type recombinant RTA (rRTA) was a kind gift from Dr S. Ramakrishnan (University of Minnesota, Minneapolis, MN).19 The pDS5/3 E177D vector encoding a mutant rRTA protein was generously provided by Drs J.A. Chaddock and L.M. Roberts (University of Warwick, UK).20 This mutant has an aspartic acid at position 177 instead of glutamic acid, as well as an additional 22 N-terminal amino acid relative to wild-type RTA. To facilitate a comparison between the wild-type and mutant proteins, an E177D mutant that lacked the 22 amino acid N-terminal extension was created by removing a Nsi/BamHI fragment (that contains codon 177) from the wild-type RTA gene and replacing it with the corresponding Nsi/BamHI fragment from the mutant gene. In both cases the BamHI site was vector encoded and was downstream of the RTA gene. Wild-type and mutant rRTA proteins were expressed and purified as previously described.19 The enzymatic activities of wild-type rRTA and dgRTA were equivalent, as measured by their ability to inhibit translation in vitro (data not shown). The E177D mutant was about 100-fold less active (data not shown), consistent with previous reports.20 21
DA7 is an immunoconjugate consisting of dgRTA linked to 3A1e, a mouse monoclonal antibody (MoAb) specific for human CD7. DA7 was produced as described elsewhere22 and was the kind gift of Dr Daniel Vallera (University of Minnesota, Minneapolis, MN).
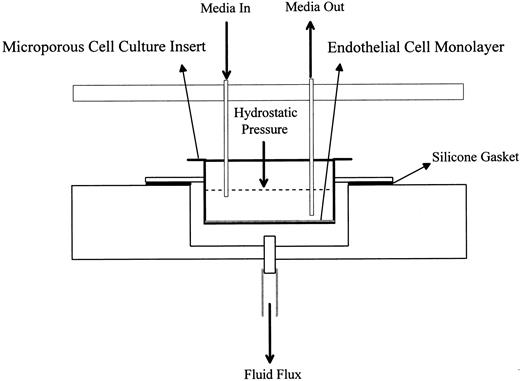
Trans-endothelial fluid flux (TEFF ) assay.For the TEFF assay, HUV-EC-C or HUVE cells were plated at a density of 3.5 to 4.5 × 10⁴ cells/cm2 on 4.2-cm2 collagen IV-coated microporous cell culture inserts (Collaborative Biomedical Products, Bedford, MA). The cells were cultured on the inserts in a humidified atmosphere of 5% CO2 at 37°C for 7 to 9 days to yield confluent monolayers with maximal barrier function. The inserts were then transferred to the TEFF apparatus. The TEFF apparatus, which we designed and built, is an acrylic chamber that contains 12 filtration units, each of which holds one insert. One filtration unit is diagrammed in Fig 1. To maintain the appropriate cell culture conditions, the apparatus containing the inserts was placed in a 37°C temperature-controlled room and connected to a 0.22-μm filtered, compressed, mixed gas supply (95% air, 5% CO2 ). A constant pressure of 9 to 9.5 cm H2O was maintained within the chamber, as measured by an open-ended manometer. The level of media within each insert contributed an additional 1.0 cm H2O for a total hydrostatic pressure differential of 10.0 to 10.5 cm H2O across the monolayers. This pressure is consistent with levels previously used for monitoring the permeability of endothelial cell monolayers.23,24 Baseline fluid flux measurements were recorded for each monolayer after equilibration for 1 to 2 hours at 37°C in the TEFF apparatus. Fluid flux measurements were expressed in terms of volume, time, and area of the insert (eg, [μL/min]/cm2 ). The lower and upper limits of detection were 0.24 (μL/min)/cm2 and 10 (mL/min)/cm2, respectively. Confluent monolayers with low basal TEFF levels (<15 [μL/min]/cm2 ) were either treated with the toxins as indicated or left untreated as negative controls.
Schematic representation of a filtration unit. This is one of 12 units arranged in a 2 by 6 array in the TEFF apparatus.
Schematic representation of a filtration unit. This is one of 12 units arranged in a 2 by 6 array in the TEFF apparatus.
To assess the effects of thrombin on permeability, HUV-EC-C monolayers were first grown to confluence in the supplemented M199 medium described above. The monolayers were extensively rinsed in M199 medium containing 1 mmol/L sodium pyruvate, 4.8 mmol/L L-glutamine, 5 U/mL heparin, 100 U/mL penicillin/streptomycin, 100 μg/mL Endo-Gro, and 1% bovine serum albumin (instead of 15% fetal bovine serum). Bovine serum albumin was substituted for fetal bovine serum to avoid thrombin inactivation by serum components. Basal TEFF values were measured 2 hours after the addition of the supplemented M199 medium. Thrombin (at 5 U/mL) was added to the cultures and the TEFF values were recorded 15 minutes later.
In the pharmacokinetic simulation experiment, confluent HUV-EC-C monolayers were exposed sequentially to a graded series of dgRTA concentrations (1.8, 1.35, 1.05, 0.80, 0.425, 0.15, and 0.05 μg/mL). Media containing dgRTA were changed every 3 hours for the first 12 hours, then at 12-hour intervals for the next 36 hours, using the decreasing dgRTA concentrations in the order given above. This was performed to approximate a theoretical pharmacokinetic profile based on a peak serum dgRTA concentration of 2.0 μg/mL and a serum half-life (t1/2 ) of 7.8 hours. This 48-hour time course was repeated to simulate two bolus injections of a dgRTA-immunotoxin administered 2 days apart.
To determine if soluble fibronectin (Fn) affected permeability induced by dgRTA, confluent HUV-EC-C monolayers were exposed to 100 μg/mL of human fibronectin (Life Technologies) and 5 × 10⁻⁸ mol/L dgRTA. For these experiments, 5% (instead of 15%) fetal bovine serum was used in the supplemented M199 medium described above. TEFF measurements were taken daily for 4 days.
Cytotoxicity assays.Toxin-induced cytotoxicity was evaluated in terms of protein synthesis inhibition, metabolic activity, and cell density. For the metabolic activity and protein synthesis inhibition studies, about 5 × 10³ HUV-EC-C cells in 150 μL of media was added to each well in gelatin-coated 96-well flat-bottomed plates or Stripwell plates, respectively (Costar, Cambridge, MA). Approximately 1 × 10⁵ HUV-EC-C cells in 2 mL of media were added to gelatin-coated wells in 6-well plates (Costar) for cell density determinations. The HUV-EC-C monolayers were treated with either dgRTA or whole ricin (as a positive control) after they reached confluence. Metabolic activity, cell density, and protein synthesis were measured as follows.
The metabolic activity of toxin-treated HUV-EC-C cells was assessed in an alamarBlue assay (AccuMed International, Inc, Westlake, OH). Metabolic activity of viable cells leads to a chemical reduction in the growth medium that causes a redox indicator in the alamarBlue reagent to change from an oxidized, nonfluorescent form to a reduced, fluorescent form. Increases in fluorescence intensity are therefore directly related to metabolic activity. The assay was performed by adding 150 μL of medium containing 10% vol/vol alamarBlue to each well posttreatment. After 1 hour of incubation at 37°C, fluorometric analyses were performed in a Cytofluor II plate reader (Biosearch, Bedford, MA) using wavelengths of 530 nm for excitation and 590 nm for emission. Values obtained from wells containing just media with 10% alamarBlue were subtracted from values obtained for all controls and treatments. The data are expressed as the percentage of negative control (cells without toxin).
To determine the density of viable cells per square centimeter, HUV-EC-C monolayers in 6-well plates were treated with toxins as indicated. The monolayers were then washed once with phosphate-buffered saline and removed from the plate by 2 to 3 minutes of incubation with a solution of 0.05% trypsin and 0.53 mmol/L EDTA diluted in Hank's Balanced Salt Solution (Life Technologies). The remaining cells were washed out of a well with 1 mL of medium, added to the other cells from that well, centrifuged, and resuspended in 0.5 mL of medium. The number of viable cells was determined by trypan blue exclusion and expressed as the percentage of untreated controls.
The protein synthesis inhibition assay involved incubating toxin-treated cells for 1 hour at 37°C in 150 μL of leucine-deficient endothelial basal labeling medium (Clonetics Corp, San Diego, CA) per Stripwell (Costar). The cells were then pulsed with 1 μCi [3H]-leucine (Amersham, Arlington Heights, IL) for 2 hours at 37°C, washed once with Hank's Balanced Salt Solution, and washed twice for 10 minutes each with 300 μL of 5% trichloroacetic acid. The individual Stripwells were separated and placed into scintillation vials for counting. Values obtained from wells with media alone were subtracted from values obtained for all control and experimental treatments. The data are expressed as the percentage of untreated controls.
Scanning electron microscopy (SEM).HUV-EC-C monolayers were cultured on collagen IV-coated microporous cell culture inserts as described for the TEFF assays. After the indicated treatments were administered, the monolayers were washed two times with a solution of one part phosphate-buffered saline and three parts Earle's Balanced Salt Solution containing 25 mmol/L HEPES and 1 mg/mL glucose. The washed monolayers were fixed for 45 minutes with the above-mentioned buffer containing 1% glutaraldehyde and then washed twice with 0.1 mol/L sodium cacodylate at pH 7.4 containing 0.1 mol/L sucrose before secondary fixation with the same cacodylate sucrose buffer containing 1% osmium tetroxide. The monolayers were rinsed for 5 minutes in distilled water before dehydration with a graded series of ethanol solutions (35%, 70%, 85%, 95%, and twice with 100%). Each solution was added for 5 minutes. The monolayers were transferred to 100% hexamethyldisilazane (Electron Microscopy Sciences, Fort Washington, PA) for 5 minutes and then air-dried for 30 minutes. Fixed, dried monolayers and naked microporous membranes were adhered to 12.7-mm specimen stubs using conductive carbon adhesive discs (Electron Microscopy Sciences), followed by sputter coating with gold/palladium. The specimens were examined with a Hitachi S450 scanning electron microscope using an accelerating voltage of 15 kV. Monolayers were photographed at 500× magnification using a tilt angle of 45°. To estimate the number of exposed pores per square centimeter, photographs of widely separated areas on the specimen stub were taken at a 0° tilt angle. The total area examined per photograph equaled or exceeded 600 μm2. Pores in the membrane insert not covered by endothelial cells were readily apparent and were counted and expressed in terms of exposed pores per square centimeter to quantify the RTA-induced changes in intercellular gaps. To assure the accuracy of this measure, the number of pores per unit area in a naked membrane was determined and the density was calculated and then compared with the value reported by the manufacturer (Collaborative Biomedical Products). The calculated and reported values (8 × 10⁵/cm2 ) were identical.
Statistical analyses.Differences between the means of treated samples and their corresponding untreated controls were analyzed by analysis of variance and Fischer's test using StatView SE + Graphics v1.03 statistical software (Abacus Concepts, Inc, Berkeley, CA). Exponential regression analysis was performed using Freelance Graphics v2.1 (Lotus Development Corp, North Reading, MA).
RESULTS
TEFF permeability assay.Because there currently are no suitable animal models for VLS induced by RTA-containing immunotoxins, an in vitro model was developed to determine the extent to which RTA increases human endothelial cell permeability. RTA was used more frequently than an RTA immunoconjugate in the model because the toxin alone appears to be responsible for inducing VLS in vivo. This is suggested by the occurrence of VLS in patients treated with RTA-immunotoxins of various specificities and with whole antibodies or Fab fragments linked to RTA,1 8-12 as well as by the data presented below.
In our system, HUV-EC-C cells are grown to confluence on collagen IV-coated microporous cell culture inserts. Each insert is then placed in a filtration unit housed in a sealed acrylic chamber that we designed (Fig 1). The chamber is pressurized with compressed air plus 5% CO2 to generate a hydrostatic pressure differential across the monolayers. Permeability is defined as the volume of culture medium that passes through a monolayer per unit time and area. This measurement is called TEFF for transendothelial fluid flux.25 The lower and upper limits of detection in the TEFF assay are 0.24 (μL/min)/cm2 and 10 (mL/min)/cm2, respectively. The latter value is the fluid flux through an insert alone. The fluid flux through a confluent HUV-EC-C monolayer averages 3.3 (μL/min)/cm2. Permeability measurements are obtained before treatment to assess the baseline barrier function of each monolayer. Collagen IV-coated inserts were chosen because growth on this extracellular matrix component yielded monolayers with the most consistently low and measurable baseline fluid flux values, as compared with monolayers grown on inserts coated with collagen I, fibronectin, or laminin (data not shown). Toxin-treated and untreated control monolayers were generally incubated for 15 to 20 minutes with media containing cytochalasin D (1 μg/mL) at the end of an experiment to show the responsiveness of all monolayers to a permeability-inducing agent. Cytochalsin D disrupts the cytoskeleton, leading to alterations in cell morphology and increases in endothelial cell monolayer permeability.26 The control monolayers averaged a 500-fold increase in permeability in response to cytochalasin D treatment (data not shown).
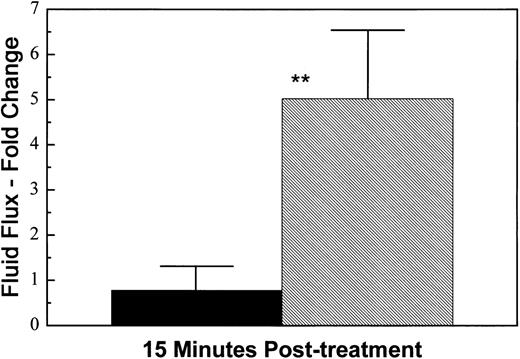
The HUV-EC-C monolayers were also sensitive to thrombin, a more physiologically relevant permeability-inducing agent. Proteolytically active thrombin is thought to induce intercellular gap formation in endothelial cell monolayers by activating contractile processes driven by the actomyosin molecular motor.27 Thrombin receptor occupancy leads to an increase in intracellular Ca2+ and activation of the Ca2+/calmodulin-dependent myosin light chain kinase. The subsequent phosphorylation of myosin light chains is thought to promote actin-myosin interaction, leading to endothelial cell contraction. Treatment of the HUV-EC-C monolayers with thrombin (at 5 U/mL) resulted in a fivefold increase in permeability 15 minutes posttreatment (Fig 2).
Thrombin-induced permeability. HUV-EC-C monolayers cultured on collagen IV-coated microporous cell culture inserts were either left untreated (n = 3; ▪) or exposed to 5 U/mL thrombin (n = 3; ▨) for 15 minutes. Monolayer permeability was measured by TEFF and was expressed as the mean fold change in fluid flux ± standard deviation. The mean pretreatment fluid flux values for untreated and thrombin-treated monolayers were 84 and 141 (μL/min)/cm2, respectively. Statistically significant differences between the mean responses of treated and time-matched control monolayers are depicted as follows: **P < .01.
Thrombin-induced permeability. HUV-EC-C monolayers cultured on collagen IV-coated microporous cell culture inserts were either left untreated (n = 3; ▪) or exposed to 5 U/mL thrombin (n = 3; ▨) for 15 minutes. Monolayer permeability was measured by TEFF and was expressed as the mean fold change in fluid flux ± standard deviation. The mean pretreatment fluid flux values for untreated and thrombin-treated monolayers were 84 and 141 (μL/min)/cm2, respectively. Statistically significant differences between the mean responses of treated and time-matched control monolayers are depicted as follows: **P < .01.
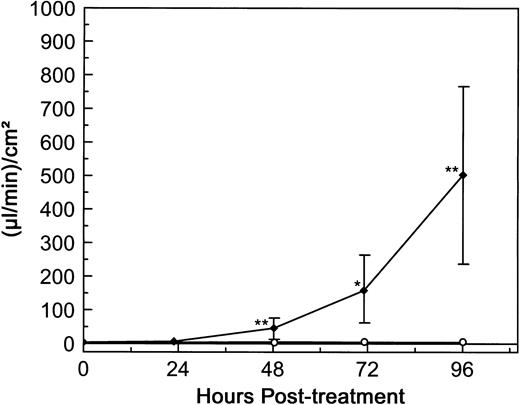
dgRTA-induced permeability.To determine the effect of RTA on the permeability of human endothelial cells, HUV-EC-C monolayers were initially exposed to 10−7 mol/L dgRTA for 4 days. dgRTA was evaluated in the majority of our experiments, because this derivative of RTA is the one used most frequently in clinically tested immunotoxins (deglycosylation reduces the toxicity inherent to native RTA for cells with carbohydrate-specific receptors).28 The concentration of 10−7 mol/L was chosen because immunotoxin-RTA serum levels of 10−8 to 10−7 mol/L were achieved in patients suffering from immunotoxin-induced VLS.8,9 No significant changes in HUV-EC-C permeability relative to the pretreatment levels were detected after 1 day of dgRTA treatment (Fig 3). However, a significant increase (P < .01) in permeability could be detected after 2 days of treatment, and permeability continued to increase to 500 μL/min/cm2 at day 4 posttreatment. This represents a 120-fold increase relative to the untreated controls. The permeability of untreated controls varied very little over the 4 days (ranging from 3.3 to 5.3 [μL/min]/cm2 ), demonstrating that the monolayers had achieved maximum barrier function and were confluent from the outset of the experiment (Fig 3). Together, these data indicate that the TEFF system is sensitive and can detect dgRTA-induced permeability changes in HUV-EC-C monolayers over the 2- to 4-day period in which RTA-immunotoxin–induced VLS occurs clinically.1 8-12
dgRTA-induced permeability. HUV-EC-C monolayers cultured on collagen IV-coated microporous cell culture inserts were either left untreated (n = 5; ○) or were exposed to 10−7 mol/L (3.0 μg/mL) dgRTA (n = 4; ♦). Monolayer permeability was measured by TEFF and is expressed as the mean ± standard deviation. Data from two separate experiments are presented here. Statistically significant differences between the mean responses of treated and time-matched control monolayers are depicted as follows: *P < .05; **P < .01.
dgRTA-induced permeability. HUV-EC-C monolayers cultured on collagen IV-coated microporous cell culture inserts were either left untreated (n = 5; ○) or were exposed to 10−7 mol/L (3.0 μg/mL) dgRTA (n = 4; ♦). Monolayer permeability was measured by TEFF and is expressed as the mean ± standard deviation. Data from two separate experiments are presented here. Statistically significant differences between the mean responses of treated and time-matched control monolayers are depicted as follows: *P < .05; **P < .01.
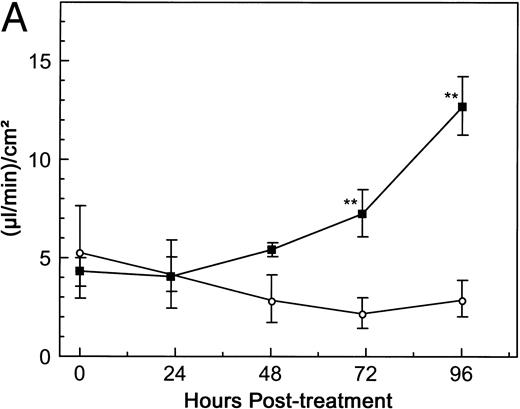
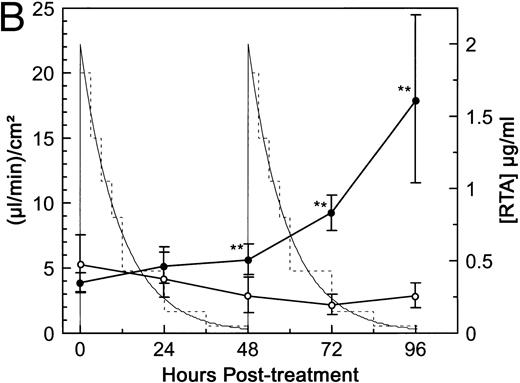
Although peak serum immunotoxin levels approaching 10−7 mol/L were achieved in patients receiving bolus injections, the total toxin exposure in these patients was below that attained in our initial in vitro assay. Bolus injections do not result in a constant level of immunotoxin exposure in vivo due to clearance from the blood. To simulate the patients' total exposure to dgRTA more closely, HUV-EC-C monolayers were treated in one of two ways. First, the monolayers were continuously exposed to 10−8 mol/L dgRTA for 4 days. This concentration was chosen because, in a clinical trial of dgRTA-immunotoxins, constant serum levels exceeding 2 μg/mL (approximately 10−8 mol/L dgRTA) were achieved by continuous infusion.29 In this study, levels exceeding 1 μg/mL were predictive of severe VLS. Exposure of HUV-EC-C monolayers to 10−8 mol/L dgRTA in vitro led to significant changes (P < .01) in permeability by day 3 of treatment (Fig 4A). The second experiment was modeled on a trial in which patients developed VLS after receiving bolus injections of a dgRTA-immunotoxin at 48-hour intervals.8 The peak serum concentration of immunotoxin in these patients was 11 μg/mL, which corresponds to approximately 2 μg/mL of dgRTA. The average t1/2 of the immunotoxin was 7.8 hours. These pharmacokinetic parameters were simulated in vitro by initially exposing confluent HUV-EC-C monolayers to dgRTA at 2 μg/mL and then by decreasing the concentration stepwise over 48 hours in a manner consistent with a t1/2 of 7.8 hours. This cycle was repeated to simulate two bolus injections administered 2 days apart. Figure 4B shows the relationship between the areas under the curve (total exposure) and permeability. A significant change (P < .01) in permeability occurred at day 2 of treatment, and permeability continued to increase through days 3 and 4 to 17.9 (μL/min)/cm2, a level that was 6.3-fold greater than that of the controls. Results from this variable exposure experiment and from the continuous exposure at 10−8 mol/L lead us to conclude that dgRTA can directly affect HUV-EC-C permeability in vitro at levels consistent with those found in patients with RTA-immunotoxin–induced VLS.
Pharmacokinetic simulation of dgRTA-induced permeability. HUV-EC-C monolayer cultures and permeability measurements were performed as in Fig 3. (A) HUV-EC-C monolayers were either left untreated (n = 4; ○) or were treated with 10−8 mol/L (0.3 μg/mL) dgRTA (n = 2; ▪). (B) HUV-EC-C monolayers were either left untreated (n = 4; ○) or were exposed to varying concentrations of RTA (n = 6; •). The thick-lined curves represent monolayer permeability in terms of the units displayed on the left-hand vertical axis. The actual RTA exposure (broken line) was used to approximate a theoretical exposure (solid, thin line) based on a t1/2 of 7.8 hours and a peak RTA concentration of 2 μg/mL. Statistically significant differences between the mean responses of treated and time-matched control monolayers are depicted as follows: **P < .01.
Pharmacokinetic simulation of dgRTA-induced permeability. HUV-EC-C monolayer cultures and permeability measurements were performed as in Fig 3. (A) HUV-EC-C monolayers were either left untreated (n = 4; ○) or were treated with 10−8 mol/L (0.3 μg/mL) dgRTA (n = 2; ▪). (B) HUV-EC-C monolayers were either left untreated (n = 4; ○) or were exposed to varying concentrations of RTA (n = 6; •). The thick-lined curves represent monolayer permeability in terms of the units displayed on the left-hand vertical axis. The actual RTA exposure (broken line) was used to approximate a theoretical exposure (solid, thin line) based on a t1/2 of 7.8 hours and a peak RTA concentration of 2 μg/mL. Statistically significant differences between the mean responses of treated and time-matched control monolayers are depicted as follows: **P < .01.
To determine if dgRTA-induced permeability was correlated with toxin concentration, confluent HUV-EC-C monolayers were continuously exposed to 10−8, 3 × 10⁻⁸, or 10−7 mol/L dgRTA for 4 days. Regression analysis of the day 4 TEFF values showed that the RTA-induced permeability of HUV-EC-C monolayers increased exponentially with concentration (correlation coefficient = .89; data not shown). Therefore, permeability induction in vitro was dose-dependent.
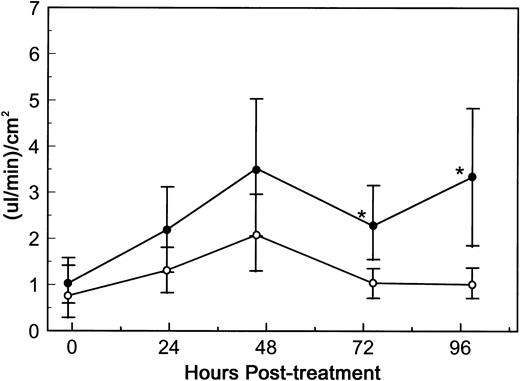
To assess whether an immunoconjugate containing dgRTA could also alter endothelial cell permeability, HUV-EC-C monolayers were exposed to 10−8 mol/L DA7. DA7 consists of dgRTA chemically linked to 3A1e, a mouse MoAb specific for human CD7.22 CD7 is a differentiation antigen expressed on the majority of T cells and mature NK cells, but not on endothelial cells.30 31 Exposure of HUV-EC-C monolayers to DA7 resulted in a statistically significant increase (P < 0.05) in permeability by 72 hours (Fig 5). Similar results were obtained in two additional experiments (data not shown). Thus, dgRTA significantly increases endothelial cell monolayer permeability either alone or as an immunoconjugate.
DA7-induced permeability. HUV-EC-C monolayer cultures and permeability measurements were performed as in Fig 3. HUV-EC-C monolayers were either left untreated (n = 4; ○) or were exposed to 10−8 mol/L DA7 (n = 6; •). Monolayer permeability was measured by TEFF and is expressed as the mean ± standard deviation. Statistically significant differences between the mean responses of treated and time-matched control monolayers are depicted as follows: *P < .05.
DA7-induced permeability. HUV-EC-C monolayer cultures and permeability measurements were performed as in Fig 3. HUV-EC-C monolayers were either left untreated (n = 4; ○) or were exposed to 10−8 mol/L DA7 (n = 6; •). Monolayer permeability was measured by TEFF and is expressed as the mean ± standard deviation. Statistically significant differences between the mean responses of treated and time-matched control monolayers are depicted as follows: *P < .05.
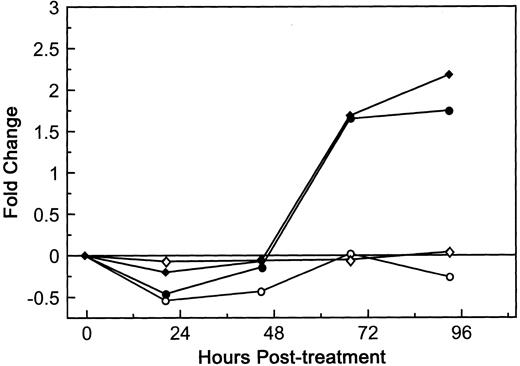
The next question addressed was whether the response of HUV-EC-C monolayers to dgRTA was similar to that of primary HUVE cell monolayers in terms of permeability. Although the baseline level of fluid flux in the untreated HUVE cell monolayers was greater than that of untreated HUV-EC-C monolayers (10.5 and 4.2 [μL/min]/cm2, respectively), the kinetics and magnitude of the permeability induced by 10−8 mol/L dgRTA were indistinguishable in the two endothelial cell cultures relative to their baseline levels (Fig 6). This was also true when the monolayers were treated with 10−7 mol/L dgRTA (data not shown). We therefore conclude that the HUV-EC-C monolayers are comparable to primary endothelial cell monolayers with respect to dgRTA-induced permeability.
Effect of dgRTA on the permeability of HUVE and HUV-EC-C monolayers. HUV-EC-C and HUVE monolayers were cultured and permeability was assessed as in Fig 3. Passage 19 HUV-EC-C (circles) or pooled passage 4 HUVE monolayers (diamonds) were either left untreated (open symbols) or treated with dgRTA (10−8 mol/L; 0.3 μg/mL; solid symbols). To facilitate comparing results derived from the different cell types, the data are expressed as the mean fold change in fluid flux relative to pretreatment fluid flux. The mean pretreatment fluid flux values for HUV-EC-C and HUVE cells in this experiment were 4.2 and 10.5 (μL/min)/cm2, respectively.
Effect of dgRTA on the permeability of HUVE and HUV-EC-C monolayers. HUV-EC-C and HUVE monolayers were cultured and permeability was assessed as in Fig 3. Passage 19 HUV-EC-C (circles) or pooled passage 4 HUVE monolayers (diamonds) were either left untreated (open symbols) or treated with dgRTA (10−8 mol/L; 0.3 μg/mL; solid symbols). To facilitate comparing results derived from the different cell types, the data are expressed as the mean fold change in fluid flux relative to pretreatment fluid flux. The mean pretreatment fluid flux values for HUV-EC-C and HUVE cells in this experiment were 4.2 and 10.5 (μL/min)/cm2, respectively.
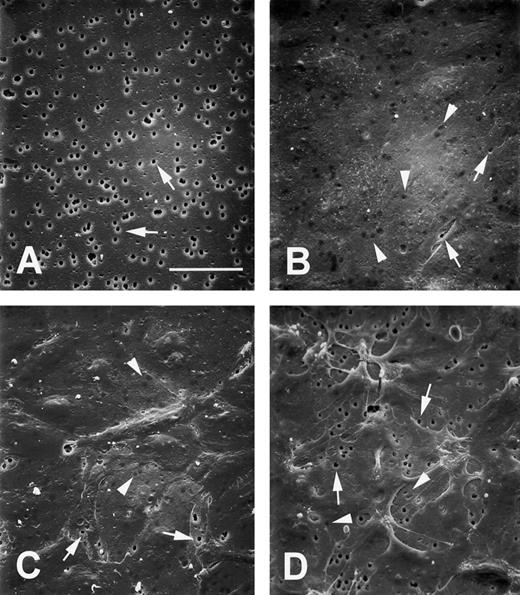
dgRTA induces intercellular gaps.The increased permeability of dgRTA-treated HUV-EC-C cells indicated that the integrity of the monolayer was compromised. We used SEM to visualize how the endothelial cell monolayers were altered by dgRTA. To do this, the monolayers were cultured on the same collagen IV-coated microporous inserts used for the permeability studies. A naked membrane was photographed to show the 3 μm pores in the insert (Fig 7A). The vast majority (99.5%) of the pores in the underlying support membrane were covered by the untreated monolayer (Fig 7B) and were easily distinguished from the exposed pores in the naked insert (Fig 7A). Treatment of the monolayers with 10−7 mol/L dgRTA for 2 or 24 hours did not cause detectable changes in morphology (data not shown). However, treatment for 96 hours resulted in the appearance of intercellular gaps in the endothelial cell monolayer (Fig 7C), consistent with the large increase in TEFF values (Fig 3). Monolayers treated with cytochalasin D as a positive control underwent dramatic morphologic changes. Margins of cells retracted from one another, exposing numerous pores in the support membrane (Fig 7D). This change in pore exposure also was consistent with a marked increase in permeability (data not shown).
dgRTA-induced morphologic changes. HUV-EC-C monolayers were cultured on the collagen IV-coated microporous cell culture inserts and treated as they were in the TEFF assays. SEM images represent (A) naked microporous membranes, (B) untreated control monolayers, (C) monolayers treated with 10−7 mol/L dgRTA for 96 hours, or (D) monolayers treated with 1 μg/mL cytochalasin D for 15 minutes. All photomicrographs were taken at 500× magnification using a tilt angle of 45°. The bar in (A) represents 50 μm; the original magnifications for (B) through (D) are the same as (A). Arrows indicate exposed pores and arrowheads indicate pores covered by endothelial cells.
dgRTA-induced morphologic changes. HUV-EC-C monolayers were cultured on the collagen IV-coated microporous cell culture inserts and treated as they were in the TEFF assays. SEM images represent (A) naked microporous membranes, (B) untreated control monolayers, (C) monolayers treated with 10−7 mol/L dgRTA for 96 hours, or (D) monolayers treated with 1 μg/mL cytochalasin D for 15 minutes. All photomicrographs were taken at 500× magnification using a tilt angle of 45°. The bar in (A) represents 50 μm; the original magnifications for (B) through (D) are the same as (A). Arrows indicate exposed pores and arrowheads indicate pores covered by endothelial cells.
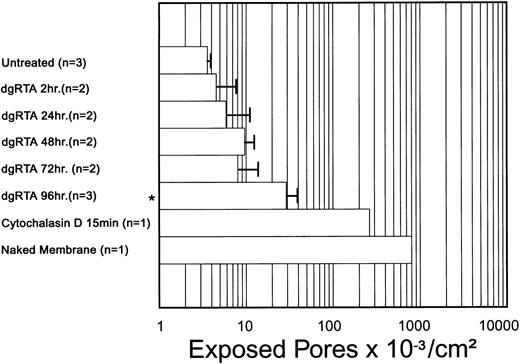
The dgRTA-induced changes in endothelial cell monolayer integrity were quantified in terms of exposed porosity (ie, the number of exposed pores per square centimeter). Relative to untreated control monolayers, a significant increase (P < .05) in exposed porosity was detected in monolayers treated with dgRTA for 96 hours, but not in those treated for 2, 24, 48, or 72 hours (Fig 8). However, a trend towards increased porosity was apparent earlier than 96 hours, suggesting that the SEM data support the TEFF results in terms of the temporal change in endothelial cell monolayer permeability. Larger sample sizes are required to determine if these early changes in exposed porosity are statistically significant.
Temporal effect of dgRTA on exposed porosity. Treatment with 10−7 mol/L dgRTA induced intercellular gaps in the HUV-EC-C monolayer that exposed pores in the support membrane. An area of ≥600 μm2 per sample was examined and the number of exposed pores were determined. Data are expressed as the mean ± standard deviation. A significance level of P < .05 is indicated by an asterisk.
Temporal effect of dgRTA on exposed porosity. Treatment with 10−7 mol/L dgRTA induced intercellular gaps in the HUV-EC-C monolayer that exposed pores in the support membrane. An area of ≥600 μm2 per sample was examined and the number of exposed pores were determined. Data are expressed as the mean ± standard deviation. A significance level of P < .05 is indicated by an asterisk.
dgRTA-induced cytotoxicity.Exposure to dgRTA may increase HUV-EC-C permeability and gap formation by inducing cell death. To test this hypothesis, cytotoxicity induced by dgRTA was measured in terms of protein synthesis, metabolic activity, and cell density (Table 1). Significant inhibition of protein synthesis was detected 24 hours after exposure of HUV-EC-C cells to 3.16 × 10⁻⁸ or 10−7 mol/L dgRTA (P < .05) and at 48 hours after exposure to 10−8 mol/L dgRTA (P < .01). A significant loss (P < .01) in metabolic activity occurred in cells treated for 2 days with 3.16 × 10⁻⁸ and 10−7 mol/L dgRTA. This was followed by a significant decrease in cell density on day 3 for the 10−7 mol/L treatment group (P < .05) and on day 4 for endothelial cells treated with 3.16 × 10⁻⁸ mol/L dgRTA (P < .05). However, the metabolic activity of cells in the latter group increased on days 3 and 4 to levels indistinguishable from those of the untreated controls. The reason for this apparent rebound in viability is not clear, and it is not apparent why there are significantly higher levels of metabolic activity in other treatment groups. However, one possibility is enhanced metabolic activity in the subconfluent surviving cells. Treatment with 10−8 mol/L dgRTA did not detectably decrease metabolic activity or cell density over the 4 days of treatment.
RTA-Induced Cytotoxicity
| Assay . | Treatment . | nmol/L . | Hours Posttreatment . | ||||
|---|---|---|---|---|---|---|---|
| . | . | . | 5 h . | 24 h . | 48 h . | 72 h . | 96 h . |
| Protein synthesis* | dgRTA | 10 | 99.7 ± 9.8 | 95.6 ± 7.3 | 94.1 ± 6.6† | ND | ND |
| [3H] leucine incorporation (n = 16) | dgRTA | 31.6 | 96.5 ± 7.8 | 93.1 ± 8.5‡ | 93.1 ± 8.5‡ | ND | ND |
| dgRTA | 100 | 100.4 ± 11.6 | 92.6 ± 12.7‡ | 85.0 ± 12.1‡ | ND | ND | |
| rRTA | 100 | 98.7 ± 12.9 | 89.9 ± 11.5‡ | 87.1 ± 14.5‡ | ND | ND | |
| rRTA-E177D | 100 | 96.8 ± 11.0 | 96.1 ± 7.4 | 97.3 ± 5.8 | ND | ND | |
| Ricin | 10 | 1.5 ± 0.3‡ | ND | ND | ND | ND | |
| Metabolic activity | dgRTA | 10 | ND | 105.6 ± 4.4† | 95.8 ± 4.8 | 102.0 ± 4.8 | 107.8 ± 6.3† |
| Alamar Blue (n = 9) | dgRTA | 31.6 | ND | 113.2 ± 1.8‡ | 88.7 ± 4.5‡ | 101.5 ± 4.1 | 104.3 ± 8.2 |
| dgRTA | 100 | ND | 108.7 ± 6.2‡ | 80.8 ± 7.7‡ | 82.3 ± 4.6‡ | 83.9 ± 7.8‡ | |
| rRTA | 100 | ND | 106.4 ± 4.7† | 72.8 ± 5.6‡ | 74.4 ± 5.5‡ | 72.7 ± 5.3‡ | |
| rRTA-E177D | 100 | ND | 107.6 ± 6.0‡ | 105.2 ± 4.2 | 107.4 ± 6.8‡ | 109.4 ± 10.2 | |
| Ricin | 10 | ND | 18.6 ± 2.5‡ | 3.2 ± 0.4‡ | 0.5 ± 0.2‡ | 0.0 ± 0.0‡ | |
| Cell density | dgRTA | 10 | ND | 100.0 ± 19.1 | 93.0 ± 12.8 | 101.5 ± 15.1 | 92.7 ± 3.7 |
| Trypan blue dye exclusion (n = 3) | dgRTA | 31.6 | ND | 100.0 ± 11.8 | 97.7 ± 23.5 | 87.7 ± 9.9 | 90.0 ± 6.1† |
| dgRTA | 100 | ND | 95.8 ± 0.8 | 86.9 ± 8.4 | 79.5 ± 9.4† | 77.6 ± 2.9‡ | |
| rRTA | 100 | ND | 103.0 ± 14.7 | 98.8 ± 8.9 | 82.4 ± 7.6† | 78.4 ± 2.2‡ | |
| rRTA-E177D | 100 | ND | 102.1 ± 8.8 | 117.5 ± 9.7 | 104.9 ± 4.8 | 109.9 ± 8.2† | |
| Ricin | 10 | ND | ND | ND | ND | ND | |
Data are presented as the mean percentage of time-matched untreated controls ± SD. Abbreviation: ND, not determined.
Data are combined from two separate experiments.
P < .05 compared with time-matched untreated controls.
P < .01 compared with time-matched untreated controls.
N-glycosidase activity is required for permeability and cytotoxicity.Treatment of HUV-EC-C cells with 10−7 mol/L dgRTA leads to protein synthesis inhibition, cell death, and a perturbation in the monolayer barrier function. RTA inhibits protein synthesis by depurinating a specific adenine in 28S ribosomal RNA.6 Depurination occurs when the N-glycosidic bond between the adenine base and ribose is hydrolyzed.7 To test the hypothesis that the N-glycosidase activity of RTA is required for this cascade of endothelial cell damage, we treated HUV-EC-C monolayers with an enzymatically attenuated mutant of RTA called rRTA-E177D.20 This protein has a single conservative amino acid substitution (glutamic for aspartic acid) at position 177 in the catalytic domain of RTA. The mutation does not affect substrate binding but it does reduce the enzymatic activity 50- to 80-fold relative to the wild-type protein.20,21 The wild-type rRTA and rRTA-E177D were expressed and purified in an identical manner and their enzymatic activities were compared with dgRTA.19 The activity of rRTA-E177D was about 100-fold less than that of the wild-type rRTA and dgRTA proteins, which were themselves equivalent (data not shown).
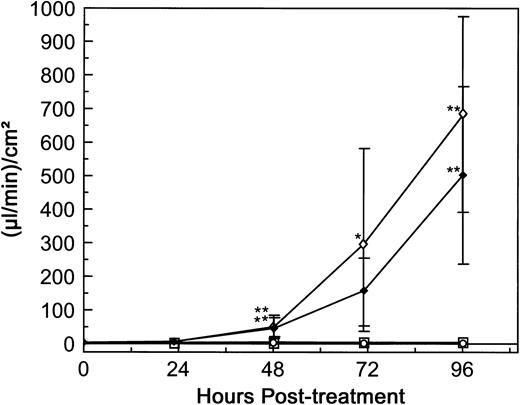
The response of HUV-EC-C monolayers to rRTA-E177D was measured in terms of permeability and cytotoxicity. The monolayers were continuously exposed for 4 days to rRTA-E177D, rRTA, or dgRTA at 10−7 mol/L each. Treatment with either rRTA and dgRTA resulted in significant permeability increases beginning on day 2 (from 3.3 to 683 [μL/min]/cm2 and from 4.0 to 503 [μL/min]/cm2, respectively; P < .01; Fig 9). In contrast, treatment with rRTA-E177D had no detectable effect on permeability throughout the 4-day experiment. Similarly, rRTA-E177D had no demonstrable cytotoxic effect as measured by metabolic activity and viable cell density (Table 1). In contrast, significant cytotoxicity was observed at days 2 and 3 in monolayers treated with dgRTA and rRTA, respectively (Table 1). These data suggest that the N-glycosidase activity of RTA is required for the induction of HUV-EC-C cell loss and permeability. To determine if rRTA-E177D could block the permeability induced by wild-type rRTA, we treated confluent HUV-EC-C monolayers simultaneously with 10−6 mol/L rRTA-E177D and 5 × 10⁻⁸ mol/L wild-type rRTA. The 20-fold molar excess of rRTA-E177D had no detectable effect on permeability induced by rRTA (data not shown).
Comparison of dgRTA-, rRTA-, and rRTA-E177D–induced permeability. HUV-EC-C monolayer cultures and permeability measurements were performed as in Fig 3. Monolayers were either left untreated (n = 5; ○) or exposed to 10−7 mol/L dgRTA (n = 4; ♦), rRTA (n = 5; ⋄), or rRTA-E177D (n = 4; □). Permeability is expressed as the mean fluid flux ± standard deviation. Data are combined from two separate experiments. Statistically significant differences between the mean responses of treated and time-matched control monolayers are depicted as follows: *P < .05; **P < .01.
Comparison of dgRTA-, rRTA-, and rRTA-E177D–induced permeability. HUV-EC-C monolayer cultures and permeability measurements were performed as in Fig 3. Monolayers were either left untreated (n = 5; ○) or exposed to 10−7 mol/L dgRTA (n = 4; ♦), rRTA (n = 5; ⋄), or rRTA-E177D (n = 4; □). Permeability is expressed as the mean fluid flux ± standard deviation. Data are combined from two separate experiments. Statistically significant differences between the mean responses of treated and time-matched control monolayers are depicted as follows: *P < .05; **P < .01.
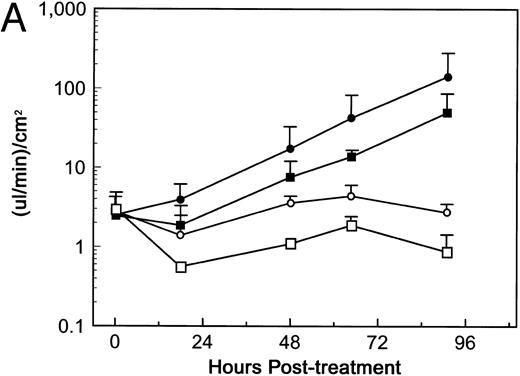
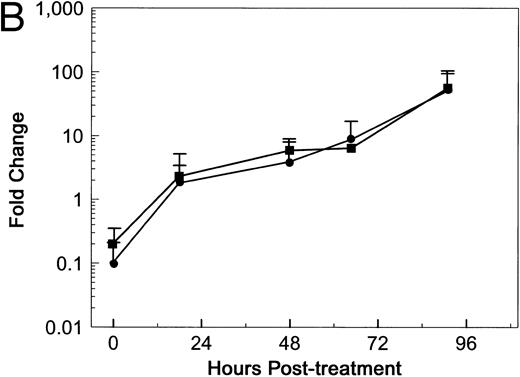
Soluble Fn does not inhibit RTA-induced permeability in the TEFF assay.Soler-Rodrı́guez et al16 initially reported that RTA induced morphologic changes in primary HUVE monolayers 1 hour after exposure. A recent study from Baluna et al17 suggested that RTA mediated this rapid effect by interfering with Fn-endothelial cell interactions. RTA reportedly bound Fn specifically, and the addition of soluble Fn inhibited the RTA-induced morphologic changes in HUVE monolayers.17 To determine if soluble Fn altered RTA-induced permeability in our system, HUV-EC-C monolayers were treated with 5 × 10⁻⁸ mol/L dgRTA in the presence or absence of 100 μg/mL soluble Fn. This concentration of Fn should completely inhibit the dgRTA-induced morphologic changes in HUV-EC-C monolayers, based on the data of Baluna et al.17 Treatment of HUV-EC-C monolayers with dgRTA plus Fn reduced the mean fluid flux by twofold to threefold, as compared with monolayers treated with just dgRTA (Fig 10A). However, a similar reduction in fluid flux occurred when monolayers were treated with Fn alone, as compared with untreated monolayers (Fig 10A). If the data from the dgRTA/Fn- and dgRTA-treated monolayers are expressed as the fold change in fluid flux relative to controls (Fn-treated and untreated monolayers, respectively), then Fn does not appear to affect either the kinetics or magnitude of HUV-EC-C monolayer permeability induced by dgRTA (Fig 10B). Potential reasons for this difference between our results and those of Baluna et al17 are discussed below.
Soluble Fn does not inhibit dgRTA-induced permeability. HUV-EC-C monolayer cultures and permeability measurements were performed as in Fig 3, except that medium containing 5% fetal bovine serum was used. Monolayers were untreated (n = 2; ○), treated with 100 μg/mL soluble Fn (n = 2; □), or exposed to 5 × 10⁻⁸ mol/L dgRTA with (n = 4; ▪) or without (n = 4; •) 100 μg/mL soluble Fn. (A) Permeability is expressed as the mean fluid flux ± standard deviation. (B) Data from (A) for Fn + dgRTA- and dgRTA-treated monolayers expressed as the fold change in fluid flux relative to Fn-treated and untreated control monolayers, respectively.
Soluble Fn does not inhibit dgRTA-induced permeability. HUV-EC-C monolayer cultures and permeability measurements were performed as in Fig 3, except that medium containing 5% fetal bovine serum was used. Monolayers were untreated (n = 2; ○), treated with 100 μg/mL soluble Fn (n = 2; □), or exposed to 5 × 10⁻⁸ mol/L dgRTA with (n = 4; ▪) or without (n = 4; •) 100 μg/mL soluble Fn. (A) Permeability is expressed as the mean fluid flux ± standard deviation. (B) Data from (A) for Fn + dgRTA- and dgRTA-treated monolayers expressed as the fold change in fluid flux relative to Fn-treated and untreated control monolayers, respectively.
DISCUSSION
Currently there are no suitable animal models for RTA-mediated vascular leak syndrome. Therefore, we developed an in vitro system in which we measure the integrity of a vascular endothelial cell monolayer in terms of its permeability. Changes in fluid flux as low as 0.24 (μL/min)/cm2 and as high as 10 (mL/min)/cm2 are detectable, demonstrating the sensitivity and range of the assay. We used the TEFF system as an in vitro model for RTA-induced VLS and found that (1) RTA directly increased the permeability of HUV-EC-C monolayers in a time- and dose-dependent manner; (2) permeability in vitro was first detected at 2 days, the same time that VLS develops in patients infused with RTA-immunotoxins1,8-12; (3) the levels of RTA that induced permeability were consistent with the total RTA exposure attained in patients suffering from VLS8,9; (4) RTA alone or in the context of an immunoconjugate increased permeability; (5) permeability was associated with cytotoxicity and intercellular gap formation in the HUV-EC-C monolayers; (6) both cytotoxicity and permeability were dependent on the N-glycosidase activity of RTA; and (7) the addition of exogenous Fn did not inhibit RTA-induced permeability.
Our data suggest that RTA directly damages HUV-EC-C monolayers through the following cascade of events: protein synthesis inhibition by ribosomal inactivation, cell death, and gap formation in the monolayer leading to an increase in permeability. Soler-Rodrı́guez et al16 reported that RTA also directly affected the morphology, permeability, and viability of primary HUVE monolayers. However, their data differ from ours with respect to the kinetics and temporal sequence of events. They found that RTA rapidly induced a morphologic change (cell rounding) after 1 hour. This change occurred before protein synthesis inhibition (detected at 4 hours) and before an increase in permeability (detected at 18 hours).16 More recently, Baluna et al17 reported that RTA specifically bound Fn and that the cell rounding and ultimate cell detachment from the monolayer mediated by RTA was inhibited by exogenous Fn. These investigators suggested that RTA binding to Fn was sufficient to perturb cell-cell or cell-extracellular matrix interactions and to change the morphology and permeability of endothelial cell monolayers. In contrast, the effects of RTA on morphology and permeability that we observed were not as acute and occurred subsequent to protein synthesis inhibition. Furthermore, the failure of the rRTA-E177D mutant to increase monolayer permeability indicates that the enzymatic activity of RTA is required for this effect. Therefore, our data suggest that the direct action of RTA on endothelial cells is primarily due to ribosome inactivation and cell death, rather than a combination of this toxicity and a more acute effect dependent on an interaction between RTA and Fn.
Potential explanations for the difference between our results and those of Vitetta's group16,17 include differential sensitivity of the HUV-EC-C and HUVE cells to RTA, variability in dgRTA preparations, and different cell culture conditions. To test the hypothesis that the sensitivity of primary cells to RTA is greater than that of the HUV-EC-C cell line, we treated primary HUVE cell monolayers with 10−8 or 10−7 mol/L dgRTA and then measured their permeability in the TEFF assay. We found that the responses of the primary endothelial cell monolayers were similar to those of the HUV-EC-C cell line; significant increases in permeability did not occur until 48 hours posttreatment. Using this measure it appears that the primary cells are not more sensitive to RTA. Another explanation may be variability in the RTA preparations. This explanation also seems unlikely because we both purchased dgRTA from the same source and because there were no significant differences in the permeability induced by equimolar concentrations of dgRTA and rRTA. A more plausible explanation may be the culture conditions under which the experiments were conducted. For example, we used 15% fetal bovine serum for the majority of our studies, whereas they used 5% serum.16,17 This may be significant if bovine Fn is similar to human Fn in terms of its ability to inhibit rapid morphologic changes induced by RTA. To address this possibility, we used 5% serum in our experiments that assessed the effect of Fn on dgRTA-induced permeability. The kinetics of dgRTA-mediated permeability were not markedly different between these experiments and ones in which 15% serum was used, suggesting that serum concentration was not a factor. An alternative is that the rapid morphological effects of RTA are inhibited by culturing endothelial cells on the collagen IV-coated microporous membranes used in our model system, as opposed to the uncoated polystyrene used by Soler-Rodrı́guez et al16 and Baluna et al.17 Various extracellular matrix proteins promote survival in a variety of cell types including endothelial cells.32-37 Lipopolysaccharide, like RTA, induces cell detachment of endothelial cells and this can be inhibited by coating culture surfaces with various extracellular matrix proteins (eg, collagen IV and Fn), peptides containing the RGD integrin recognition sequence, or antibodies directed against cell surface integrin subunits.36 37 These observations suggest that the collagen IV-coated surfaces may have a compensatory effect on endothelial cell monolayers that prevents RTA-mediated cell rounding and detachment. The basement membrane on which the endothelium rests in vivo contains a variety of extracellular matrix proteins that could interact with a given endothelial cell simultaneously. Therefore, disruption of endothelial cell-Fn interactions may have less of an effect in vivo than in an in vitro situation in which no such redundancy is provided. Further studies are required to determine if collagen IV or extracellular matrix proteins other than Fn can protect endothelial cells from RTA-mediated cell rounding and detachment.
Toxins that inhibit protein synthesis enter cells either by receptor-mediated endocytosis or through a passive process such as fluid-phase pinocytosis.38,39 RTA, saporin, and other ribosome-inactivating proteins specifically bind to the α2-macroglobulin receptor.40 The high-level expression of this receptor on hepatocytes and Küppfer cells may account for the liver-specific toxicity induced by RTA and saporin in mice.41,42 However, it is unlikely that RTA damages human endothelial cells through α2-macroglobulin receptor-mediated endocytosis, because cultured human endothelial cells and endothelial cells fixed in tissue sections do not express detectable levels of this receptor.42,43 RTA has been reported to bind HUVE cells in a Fn-specific manner.17 However, the inability of soluble Fn to inhibit RTA-mediated permeability in our model suggests that the binding of RTA to cell surface Fn, and subsequent endocytosis, is not the primary route of RTA entry. RTA-mediated damage to endothelial cells may therefore occur by passive uptake and subsequent protein synthesis inhibition. This is consistent with the inability of the rRTA-E177D mutant to block permeability induced by wild-type rRTA.
Our data suggest that a direct cytotoxic effect of the toxin on the vascular endothelium contributes to RTA-induced VLS. Direct cytotoxicity is most likely one step in a cascade of events that leads to VLS in vivo. However, the relative contribution of this toxicity to VLS in vivo cannot be addressed in our model system. This requires the identification of a suitable animal model, such as the one described by Siegall et al44 for VLS induced by Pseudomonas exotoxin-A (PE40). These investigators reported that a PE40-immunoconjugate indirectly caused VLS in rats by eliciting an inflammatory response. Prophylactic administration of the corticosteroid dexamethasone completely prevented the VLS-associated toxicities caused by the PE40-immunotoxin.44 The role of inflammation in VLS induced by RTA is less clear. Limited clinical studies involving the concomitant or subsequent administration of corticosteroids with anti-CD22-dgRTA immunotoxins failed to correlate the grade of toxicity with steroid treatment.8 9
Although the exact mechanism by which RTA mediates VLS in vivo remains to be determined, reducing the patient's total immunotoxin exposure should reduce the risk of inducing VLS. To achieve a balance between reduced nonspecific toxicity and antitumor activity, the ideal immunotoxin should have a high affinity and be rapidly cleared. These requirements may be met by single-chain Fv immunotoxins.45 Single-chain Fv fragments are about one-fifth the size of intact IgG antibodies and have short serum half-lives.46 The binding of single-chain Fv fragments can be enhanced by mutagenesis and selection for high-affinity variants with fast on-rates and slow off-rates.47 An alternative would be to use toxins that are less directly cytotoxic to endothelial cells. The TEFF system provides an excellent assay for identifying such toxins.
ACKNOWLEDGMENT
The authors thank Drs J.A. Chaddock, L.M. Roberts, and S. Ramakrishnan for providing the rRTA expression vectors; Drs Patrick Eldin, James McCarthy, Mary Pauza, and Gregory Vercellotti for their helpful comments on the manuscript; Chris Frethem for technical assistance with the SEM; and Dr Carol Wells and Andy Umen for their help with the statistical analyses.
Supported in part by grants from the National Institutes of Health (CA-59510) and the Leukemia Task Force (C.A.P.). A.L.L. was supported by US Public Health Services Training Grant No. CA-09138. J.H.K. is a recipient of an Outstanding Investigator Grant Award (CA-49721) from the National Cancer Institute.
Address reprint requests to Christopher A. Pennell, PhD, Department of Laboratory Medicine and Pathology, Box 86 UMHC, 420 Delaware St SE, Minneapolis, MN 55455.

This feature is available to Subscribers Only
Sign In or Create an Account Close Modal