Abstract
Accumulation of adenosine and of deoxyadenosine in the absence of adenosine deaminase activity (ADA) activity results in lymphocyte depletion and in severe combined immunodeficiency (ADA SCID), which is currently explained by direct cell death-causing effects of intracellular products of adenosine metabolism. We explored the alternative mechanisms of peripheral T-cell depletion as due to inhibition of T-cell expansion by extracellular adenosine-mediated signaling through purinergic receptors. The strong inhibition of the T-cell receptor (TCR)-triggered proliferation and of upregulation of interleukin-2 receptor α chain (CD25) molecules, but not the direct lymphotoxicity, were observed at low concentrations of extracellular adenosine. These effects of extracellular adenosine (Ado) are likely to be mediated by A2a receptor-mediated signaling rather than by intracellular toxicity of adenosine catabolites, because (1) poorly metabolized adenosine analogs cause the accumulation of cAMP and strong inhibition of TCR-triggered CD25 upregulation; (2) the A2a, but not the A1 or A3, receptors are the major expressed and functionally coupled adenosine receptors in mouse peripheral T and B lymphocytes, and the adenosine-induced cAMP accumulation in lymphocytes correlates with the expression of A2a receptors; (3) the specific agonist of A2a receptor, CGS21680, induces increases in [cAMP]i in lymphocytes, whereas the specific antagonist of A2a receptor, CSC, inhibits the effects of Ado and CGS21680; and (4) the increases in [cAMP]i mimic the adenosine-induced inhibition of TCR-triggered CD25 upregulation and splenocyte proliferation. These studies suggest the possible role of adenosine receptors in the regulation of lymphocyte expansion and point to the downregulation of A2a purinergic receptors on T cells as a potentially attractive pharmacologic target.
STUDIES OF THE EFFECTS of adenosine and adenosine analogs on lymphocytes are important due to the implication of adenosine in the pathogenesis of diseases,1,2 regulation of normal immune processes,3 and consideration of adenosine as an endogenous anti-inflammatory agent4,5 as well as the use of adenosine analogs as pharmacologic agents.6-8
Accumulation of extracellular and intracellular adenosine (Ado) in the absence of adenosine deaminase activity (ADA) is lymphotoxic and results in severe combined immunodeficiency (SCID).1,2 9 Humans with inherited ADA deficiency (undetectable ADA activity) are ill, and infantile death results from recurrent infections due to the lymphopenia and the absence of T- and B-cell immunity. ADA deficiency results in dramatically decreased number of peripheral lymphocytes in lymph nodes and spleen. Understanding the molecular and cellular mechanisms of peripheral T- and B-cell depletion is important in devising treatment strategies.
The severity of disease is dependent on remaining levels of ADA activity and, by implication, on concentrations of accumulated adenosine. Later-onset patients have 2% to 5% of normal activity and are expected to have lower levels of accumulated adenosine than early onset patients with severe ADA deficiency. Insufficient information is available about the exact levels of extracellular adenosine in patients with ADA, but it was reported that the absence of ADA results in the accumulation of up to 6 μmol/L of Ado in plasma, compared with less than 0.4 μmol/L in controls.10 Local concentrations of extracellular Ado could be higher, but have yet to be determined. Exceedingly high concentrations of extracellular adenosine in hypoxic conditions were reported in studies of large experimental tumors.11
The most discussed mechanism of ADA SCID is based on the accumulation of lymphotoxic intracellular deoxyadenosine, dATP, and/or of S-adenosyl homocysteine,9,12,13 as the cause of direct lymphotoxicity leading to the depletion of lymphocytes.14 15
The alternative mechanism of lymphocyte depletion being due to extracellular adenosine-mediated transmembrane signaling through adenosine (purinergic) receptors on thymocytes and on peripheral T cells3 has not yet been carefully explored. However, this signaling mechanism better explains the clinical observations of autoimmunity in ADA SCID patients16 by differential expression of extracellular adenosine signal-transducing receptors on different lymphocyte subsets.3 The autoimmunity was, indeed, explained16 as due to a disbalance between immune effector and immune regulatory cells. The lymphocyte subset selectivity of the effects of adenosine is implied in these considerations. It is difficult to expect that toxic intracellular effects of deoxyadenosine, dATP, and/or of S-adenosyl homocysteine could discriminate between effector and suppressor immune cells.
Clarification of the cellular and biochemical mechanisms of ADA SCID is important for the understanding of the pathogenesis of this disease and rational predictions of side effects of adenosine-based pharmacologic agents. Therefore, it was important to consider whether the inhibition of activation and expansion of lymphocytes by excessive but relatively low concentrations of adenosine rather then the direct, intracellular Ado-triggered apoptotic effects9 could contribute to immune deficiency.
In this study, we asked (1) whether Ado-induced depletion of peripheral lymphocytes may be at least partially explained by extracellular versus intracellular adenosine-mediated inhibition of the antigen/T-cell receptor (TCR)–driven proliferation of T cells and (2) whether the effects of adenosine could be explained by the extracellular adenosine receptor-mediated signaling.
We report that low concentrations of extracellular adenosine block TCR-triggered interleukin-2 (IL-2) receptor expression on T lymphocytes and that this is most readily explained by the A2a adenosine receptor-mediated signaling.
MATERIALS AND METHODS
Animals.DBA-2 mice were purchased from Charles River Laboratory (Wilmington, MA). Cytochrome c peptide-specific TCR transgenic mice17 were maintained in a pathogen-free environment at National Institutes of Health (NIH) animal care facilities and generously provided by Jane Hu Li (Laboratory of Immunology, NIAID, NIH, Bethesda, MD). Mice were 6 to 10 weeks old, and two to four animals were used in each experiment.
Cells and medium.Splenocytes, thymocytes, and lymph node cells were isolated from adult organs ex vivo and incubated in RPMI-1640 (Biofluids, Inc, Rockville, MD) supplemented with 5% dialyzed fetal calf serum (heat-inactivated) and 100 U/mL penicillin, 100 μg/mL streptomycin, 1 mmol/L sodium pyruvate, 1 mmol/L HEPES, nonessential amino acids, and 5 × 10⁻⁵ mol/L 2β-mercaptoethanol. SJL, NFS mouse lymphoma cells18 were generously provided by Dr H.C. Morse (Laboratory of Immunopathology, NIAID, NIH) and were maintained in RPMI-1640 media supplemented with 10% fetal calf serum.
Monoclonal antibodies (MoAbs).R-phycoerythrin (PE)-conjugated hamster antimouse αβTCR (H57-597) and rat antimouse CD4 (RM-4-5), fluorescein isothiocyanate (FITC), PE-conjugated rat antimouse CD8a MoAbs, FITC-labeled antimouse CD25 MoAb, and anti-CD3ε MoAb (2C11) were purchased from PharMingen (San Diego, CA). Rat antimouse CD4 (H129.19) MoAb conjugated with RED-613 fluorochrome was purchased from GIBCO BRL/Life Technologies (Gaithersburg, MD).
Reagents.EHNA, 2-chloro-adenosine,3-isobutyl-1-methylxanthine (IBMX), 5-N-ethylcarboxamide adenosine (NECA), 2-chloroadenosine (2CADO), CGS21680, S-(4-Nitrobenzyl)-6-thioinosine (NBTI), and 8-(3-chlorostyryl) caffeine (CSC) were purchased from Research Biochemicals International (RBI; Natick, MA). N6,2-O-dibutyryladenosine 3′:5′-cyclic monophosphate (dBcAMP), uridine, adenosine, and propidium iodide were purchased from Sigma Chemical Co (St Louis, MO). Coformycin was purchased from CalBiochem (La Jolla, CA). Concanavalin A (con A) was purchased from Vector Laboratories, Inc (Burlingame, CT). Cytochrome c transgenic TCR-specific peptide17 was generously donated by Jane Hu Li.
Analysis of peripheral T cells.A single-cell suspension of murine splenocytes was isolated by standard procedures. Cells were washed and incubated at 37°C in a 7% CO2 incubator. The mouse splenocytes were incubated with ACK lysing buffer (BioWhittaker, Walkersville, MD) at 100 × 106 cells/mL for 3 minutes at 37°C to remove red blood cells. The cells were then washed and resuspended in RPMI-1640 supplemented with 5% fetal calf serum (Biofluids, Inc). T lymphocyte activation assays were performed by incubating splenocytes at 5 × 10⁶ cells/mL in a 48-well plate (Costar, Cambridge, MA) in a 37°C, 5% CO2 incubator for 1 to 24 hours as indicated in the figure legends. Control incubation was performed in parallel at 4°C at the same cell concentration.
Activation of T cells was triggered by addition of antigenic cytochrome c peptide (1 μmol/L) or by placing cells in wells with immobilized (plastic-precoated) antimouse CD3ε MoAb19 (500 ng/well) or by adding mitogens, eg, con A (4 μg/mL).
The upregulation of CD25 on T lymphocytes was studied by flow cytometry. CD25 expression on the TCR+ cells was evaluated by gating propidium iodide negative (PI−; live) and PE-labeled antimouse αβTCR+ subsets of cells. Gates were selected to allow analysis only of TCR+ cells.
Flow cytometric estimation of live, apoptotic, and dead cells was performed according to a modified cytometry procedure.20 Briefly, cells from the assay wells were gently pipetted and transferred directly into polystyrene tubes (12 × 75 mm; Falcon, Becton Dickinson Labware, Lincoln Park, NJ), and 200 μL of fluorescence-activated cell sorting (FACS) buffer (phosphate-buffered saline with 2% fetal calf serum and 0.05% sodium azide) was added to each sample. Each sample had equal volume and was analyzed at the same flow rate and for the standard time (20 seconds) in duplicate or triplicate. PI solution (1 μg/mL final concentration) was added to each tube for 10 seconds before FACS analysis. Live, dead, and apoptotic cells were estimated by counting cell numbers in appropriate gates using forward/side scatter dot plot in the linear scale and PI staining in log scale.
Flow cytometry data acquisition and analysis were performed on FACScan using FACScan research software and CellQuest programs (Becton Dickinson, San Jose, CA).
Cell proliferation assay.Mouse splenocytes (400 × 103 per well) on a 96-well plate (Costar) were stimulated with antigenic peptide (1 μmol/L), con A (4 μg/mL), or 50 ng plate-bound antimouse CD3ε with the indicated reagents described in the legends to the figures. The cells were incubated at 37°C and under 5% CO2 for 24 hours and were then pulsed and incubated with 1 μCi [3H]dTTP for 24 hours. The cells were then harvested onto a glass fiber filter (Wallac, Turku, Finland) using a 96-well plate harvester (Tomtec, Orange, CT). Scintillation cocktail (Beckman, Columbia, MD) was added to the filter in a seal bag and counted on a liquid scintillation counter (1205 Betaplate; Wallac).
Measurement of adenosine-triggered accumulation of cAMP.Splenocytes were preincubated for 10 minutes with IBMX (50 μmol/L) at 5 × 10⁶ cells/mL in 200 μL of media on ice. The cells were then incubated with adenosine and its analogs at 37°C for 60 minutes in 48-well plates. The incubation was stopped by adding 20 μL 1N HCl to each well. The cell lysates were boiled for 5 minutes and centrifuged at 10,000 rpm for 5 minutes at 4°C. The supernatant was then collected and diluted 10 times with cAMP detection assay buffer (Biotrak, cAMP enzyme-immunoassay system; Amersham Life Science, Buckinghamshire, UK).
The assay was based on competition between unlabeled cAMP and a fixed quantity of peroxidase-labeled cAMP for binding sites on a cAMP-specific antibody and was performed according to the manufacturer's protocol. The amount of peroxidase-labeled ligand bound by the antibody is inversely proportional to the concentration of the added unlabeled ligand. Briefly, 100 μL of sample and 100 μL of rabbit anti-cAMP antibody were added into polystyrene microtiter wells (solid phase) that were coated with donkey antirabbit Ig and incubated at 4°C for 2 hours. After the incubation, peroxidase-conjugated cAMP was added to compete with the antiserum for 1 hour at 2°C to 5°C. All wells were then washed with 400 μL of washing buffer four times. TMB (tetramethylbensidine; 150 μL), the substrate for peroxidase, was added into all wells and incubated at room temperature for 30 minutes. Sulfuric acid (100 μL, 1.0 mol/L; Mallinckrodt Chemical, Paris, KY) was added to each well to stop the coloration. The plate was read at 450 nm on a kinetic microplate reader (Molecular Devices, Sunnyvale, CA), and the value of cAMP concentration in each sample was calculated using the standard curve.
Northern blot analysis of adenosine receptor mRNA expression.To prepare polyA-mRNA, the total RNA from murine thymocytes, splenocytes, lymph nodes, T-cell clones, and tumors was isolated by the single-step method with slight modifications (RNA Stat-60; Tel-test “B”, Inc, Friendswood, TX). Cells were resuspended in Tel-test RNA Stat-60 (Tel-Test, Inc) at 5 to 10 × 106 cells/mL for total RNA isolation according to the manufacturer's protocol. Oligotex mRNA Mini Kit (Qiagen, Chatsworth, CA) was used to isolate polyA RNA from the total RNA. Total RNA (250 μL; 1 μg/μL), 250 μL 2× binding buffer, and 15 μL oligotex suspension were mixed and the mRNA was eluted and precipitated with 10 μg mussel glycogen (5 prime 3 prime, Boulder, CO). cDNAs of mouse A1, A2a, and A2b receptors were obtained from Dr Diana L. Marquardt (University of California, San Diego, CA). cDNA of mouse A3 was from David Grandy (Vollum Institute for Advanced Biomedical Studies, Portland, OR). cDNA for mouse β-actin was obtained from Clontech (Palo Alto, CA).
cDNA polymerase chain reaction (PCR) probes for Northern blot analysis were synthesized using the following oligomers: 5′-ATTGGC ATC GAG GTG CTC ATT GCC-3′ and 5′-GCTC ACA CTT GAT CAC GGG CTC-3′ (for A1 receptor); 5′-AGG GCG AAG GGC ATC ATT G-3′ and 5′-TGG CCA TTG AGG CGG AGG CT-3′ (for A2a receptor); 5′-AAC AGT AAA GAC AGT GCC ACC-3′ and 5′-GAT ACA GTT GAT GGC ATG CAC-3′ (for A2b receptor); 5′-ACC CCC ATG TTT GGC TG-3′ and 5′-TCT TGA ACT CCC GTC CAT AAA-3′ (for A3 receptor); and 5′-GTG GGC CGC TCT AGG CAC CAA-3′ and 5′-CTC TTT GAT GTC AGC CAC GAT TTC-3′ (for β-actin).
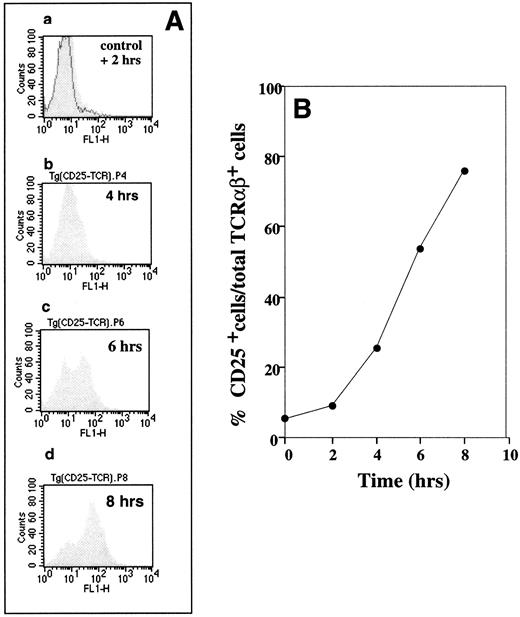
Demonstration of specific antigenic peptide TCR-triggered CD25 upregulation on cytochromec peptide TCR transgenic mouse T lymphocytes. B10A TCR-transgenic mouse splenocytes were incubated at 5 × 10⁶ cells/mL with 1 μmol/L of cytochrome c peptide for 2, 4, 6, and 8 hours. The cells were then labeled with (1) FITC antimouse CD25, (2) PE antimouse TCRαβ, and (3) PI. CD25 expression on the TCR+ cells was evaluated by flow cytometry by gating for PI− (live) and PE-antimouse TCRαβ+ cells. (A) Flow cytometry profiles of CD25-expressing TCRαβ+ cells. The shaded histograms show changes in CD25 expression after 2 (graph a), 4 (graph b), 6 (graph c), and 8 (graph d) hours of stimulation. The solid histogram (control) in graph a represents the CD25 level on T cells from a sample that was not incubated with antigenic peptide. (B) Time-dependent changes in percentages of CD25+ cells among TCRαβ+ cells was calculated from data in (A).
Demonstration of specific antigenic peptide TCR-triggered CD25 upregulation on cytochromec peptide TCR transgenic mouse T lymphocytes. B10A TCR-transgenic mouse splenocytes were incubated at 5 × 10⁶ cells/mL with 1 μmol/L of cytochrome c peptide for 2, 4, 6, and 8 hours. The cells were then labeled with (1) FITC antimouse CD25, (2) PE antimouse TCRαβ, and (3) PI. CD25 expression on the TCR+ cells was evaluated by flow cytometry by gating for PI− (live) and PE-antimouse TCRαβ+ cells. (A) Flow cytometry profiles of CD25-expressing TCRαβ+ cells. The shaded histograms show changes in CD25 expression after 2 (graph a), 4 (graph b), 6 (graph c), and 8 (graph d) hours of stimulation. The solid histogram (control) in graph a represents the CD25 level on T cells from a sample that was not incubated with antigenic peptide. (B) Time-dependent changes in percentages of CD25+ cells among TCRαβ+ cells was calculated from data in (A).
The PCR products were purified using the QIAquick-spin PCR purification kit (Qiagen). An oligo labeling kit (Pharmacia, Uppsala, Sweden) was used for probe labeling. Briefly, 50 ng of the purified PCR product in 34 μL TE was denatured by heating at 100°C for 3 minutes and chilling on ice for 2 minutes. Reagent mix (10 μL), 5 μL of [α-32P] dCTP (3,000 Ci/mmol; 50 μCi; DuPont Co, Newtown, CT), and 1 μL of Klenow were added and the solution was incubated at 37°C for 60 minutes. The Microcon 3 microconcentrator (10-bp cutoff; Amicon, Inc, Beverly, CA) was used to separate the probe from unincorporated nucleotides.
PCR amplification was performed using dNTP (Perkin Elmer, Foster City, CA), 10 pmol of each primer, and 1.25 U of Taq polymerase (Promega, Madison, WI). PCR products were analyzed using 4% NuSieve 3:1 agarose gel (FMC BioProducts, Rockland, ME) and ethidium bromide staining.
Northern blots were performed using routine procedures. Briefly, 4.5 μL mRNA was denatured by incorporating 2 μL 10× mops (Oncor, Gaithersburg, MD), 3.5 μL formaldehyde (Mallinckrodt Chemical), 10 μL formamide (Fluka Chemical Corp, Ronkonkoma, NY), and 0.2 μL ethidium bromide (GIBCO BRL) into the sample and heating at 65°C for 15 minutes. Two micrograms of mRNA per lane was run on a 1% denaturing agarose gel at 100 V. The Turboblotter System (Schleicher & Schuell, Keene, NH) was used for RNA blotting. The RNA blot was then washed with 2× SSC (Advanced Biotechnologies Inc, Columbia, MD) and cross-linked in a UV cross-linker (UV Stratlinker 1800; Stratagene, La Jolla, CA). For prehybridization, 10 mL QuikHyb solution (Stratagene) was used. The [α-32P]dCTP-labeled probe with specific activity of 108 cpm/μg was combined with 1 mg of sonicated salmon sperm DNA (Stratagene) and denatured by heating at 100°C for 2 minutes. The denatured probe was then added and incubation continued at 68°C for 60 minutes. The blot was washed first with 0.1% wt/vol sodium dodecyl sulfate (SDS; Research Genetics, Huntsville, AL) in 2× SSC at room temperature for 15 minutes twice (low-stringency wash) and then with 0.1% wt/vol SDS in 0.1× SSC at 60°C for 30 minutes (high-stringency wash). The blot was then subjected to x-ray film (Kodak, Rochester, NY). For reprobing, the blot was stripped with boiled 0.1% SDS solution (in 0.1× SSC).
RESULTS
In a series of preliminary studies, we evaluated the effects of extracellular adenosine and adenosine analogs on (1) the expression of different T- and B-lymphocyte activation markers and functionally important surface antigens (eg, CD25, CD69, CD4, CD8, and TCR/CD3), (2) T-cell proliferation, and (3) T-cell effector functions (TCR-triggered cytotoxicity and lymphokine secretion). Because the cell proliferation and the IL-2 receptor (CD25) expression on peripheral T lymphocytes were the most susceptible to inhibition by extracellular Ado (data not shown), we focused on effects of extracellularly added Ado on TCR-triggered CD25 expression.
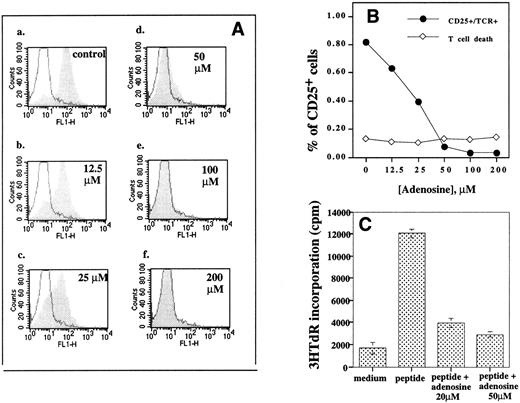
Extracellular adenosine inhibits TCR-triggered CD25 upregulation and blocks proliferation of antigenic peptide triggered TCR-transgenic T lymphocytes. Different concentrations of extracellular adenosine (0 to 200 μmol/L), 20 μmol/L of NBTI (inhibitor of nucleoside transporters), and 1 μmol/L of coformycin (ADA inhibitor) were present during 8 hours of incubation of B10A TCR-transgenic mouse splenocyte (5 × 10⁶ cells/mL) with 1 μmol/L of cytochrome c peptide. Expression of CD25 was evaluated by flow cytometry. Coformycin and NBTI were added to the assay in this experiment to prevent adenosine from entering the cell and from degradation by adenosine deaminase. These agents had no effect on their own when added alone (data not shown). (A) The effect of adenosine on CD25 upregulation. The shaded histograms represent profiles of CD25 expression in the presence of extracellular adenosine. The solid histograms represent the CD25 level in unstimulated cells. Flow cytometry analysis of CD25+ cells among TCRαβ+ cells was performed as in Fig 1. The coformycin and NBTI had no inhibitory effect on CD25 upregulation in the absence of adenosine. Graph a, control; graph b, 12.5 μmol/L adenosine; graph c, 25 μmol/L adenosine; graph d, 50 μmol/L adenosine; graph e, 100 μmol/L adenosine; and graph f, 200 μmol/L adenosine. (B) Extracellular adenosine inhibits TCR-triggered upregulation of CD25 on TCRαβ+ cells but does not have direct lymphotoxic effects. Flow cytometry data were used to calculate the effect of adenosine on percentage of CD25+ cells among live TCRαβ cells (•) and the percentage of PI+ (dead or apoptotic) cells (⋄) among TCRαβ+ cells. (C) Extracellular adenosine inhibits antigenic peptide/TCR-triggered proliferation of TCRαβ cells. Cells were incubated with medium alone (control) or with 1 μmol/L of cytochrome c peptide or with peptide in 20 μmol/L or with peptide and 50 μmol/L. Splenocytes were assayed for proliferation in parallel with the flow cytometry experiment in (B). Proliferation was tested as described in the Materials and Methods.
Extracellular adenosine inhibits TCR-triggered CD25 upregulation and blocks proliferation of antigenic peptide triggered TCR-transgenic T lymphocytes. Different concentrations of extracellular adenosine (0 to 200 μmol/L), 20 μmol/L of NBTI (inhibitor of nucleoside transporters), and 1 μmol/L of coformycin (ADA inhibitor) were present during 8 hours of incubation of B10A TCR-transgenic mouse splenocyte (5 × 10⁶ cells/mL) with 1 μmol/L of cytochrome c peptide. Expression of CD25 was evaluated by flow cytometry. Coformycin and NBTI were added to the assay in this experiment to prevent adenosine from entering the cell and from degradation by adenosine deaminase. These agents had no effect on their own when added alone (data not shown). (A) The effect of adenosine on CD25 upregulation. The shaded histograms represent profiles of CD25 expression in the presence of extracellular adenosine. The solid histograms represent the CD25 level in unstimulated cells. Flow cytometry analysis of CD25+ cells among TCRαβ+ cells was performed as in Fig 1. The coformycin and NBTI had no inhibitory effect on CD25 upregulation in the absence of adenosine. Graph a, control; graph b, 12.5 μmol/L adenosine; graph c, 25 μmol/L adenosine; graph d, 50 μmol/L adenosine; graph e, 100 μmol/L adenosine; and graph f, 200 μmol/L adenosine. (B) Extracellular adenosine inhibits TCR-triggered upregulation of CD25 on TCRαβ+ cells but does not have direct lymphotoxic effects. Flow cytometry data were used to calculate the effect of adenosine on percentage of CD25+ cells among live TCRαβ cells (•) and the percentage of PI+ (dead or apoptotic) cells (⋄) among TCRαβ+ cells. (C) Extracellular adenosine inhibits antigenic peptide/TCR-triggered proliferation of TCRαβ cells. Cells were incubated with medium alone (control) or with 1 μmol/L of cytochrome c peptide or with peptide in 20 μmol/L or with peptide and 50 μmol/L. Splenocytes were assayed for proliferation in parallel with the flow cytometry experiment in (B). Proliferation was tested as described in the Materials and Methods.
The better approximation of in vivo conditions was performed by incubating unseparated splenocytes with different concentrations of extracellular Ado and by using cytochromec peptide-specific (peptide 88-104) TCR-transgenic mice17 to accomplish activation of a large number of peripheral transgenic TCR-expressing T cells. The subsequent flow cytometry analysis allowed us to discriminate between live, apoptotic, and dead cells and to follow the fate of individual T-cell subsets.
To mimic conditions of ADA deficiency and to protect the added adenosine from degradation, the effects of extracellular Ado on lymphocytes in the model system described above were studied in the presence (or absence, in controls) of potent ADA inhibitor coformycin.21 22 Because the extracellular adenosine could be translocated into cytoplasm, thereby complicating the assignment of its effects as solely mediated by transmembrane signaling, the blocker of nucleoside plasma membrane transporter, NBTI, was included in some (but not other, control) assays.
Expression of CD25 is an important measure of lymphocyte activation, because failure of the production of either IL-2 or its receptor results in a failure of the T-cell immune response.23,24 The data presented in Fig 1 support the use of this T-cell response as a convenient short-term assay in our studies by confirming that antigenic peptide (1 μmol/L) -triggered CD25 expression is one of the earliest among those necessary for T-cell proliferation events,24 with the percentage of CD25+ cells increasing from about 10% after 2 hours to about 80% after 8 hours of incubation (Fig 1). The experiment described in Fig 1 was performed using splenocytes from cytochrome c peptide-specific TCR-expressing transgenic mice. The flow cytometry estimations of changes in levels of CD25 expression after 2, 4, 6, and 8 hours (graphs a, b, c, and d, respectively) were used to present results as the percentage of CD25-expressing cells among live (PI−) and αβTCR-expressing cells (Fig 1B).
Effects of extracellular adenosine on peripheral T cells.Figure 2 shows that, at surprisingly low concentrations, extracellular adenosine strongly inhibited the upregulation of CD25 molecules (Fig 2A and B) on the antigenic peptide-stimulated TCR transgenic mouse splenocytes.
It is of importance that no lymphotoxic effects and no changes in the number of live, nonapoptotic T cells were found in the same samples (Fig 2B) after 8 hours of activation and incubation with extracellular adenosine. This result suggests that inhibition of T-cell proliferation by adenosine may occur in the absence of a direct adenosine-mediated lymphotoxicity.
TCR-triggered CD25 upregulation (Fig 2A, graph a, control) was noticeably inhibited by as low as 12.5 μmol/L adenosine (Fig 2A, graph b, and Fig 2B). More than 50% inhibition was detected at 25 μmol/L adenosine, and almost complete inhibition was shown at 50 μmol/L adenosine (Fig 2A, graph d, and Fig 2B).
The inhibition of TCR-triggered IL-2 receptor expression by low concentrations of extracellular adenosine was accompanied by a strong inhibition of proliferation of antigenic peptide-stimulated TCR-transgenic mouse splenocytes in parallel experiments (Fig 2C), and more than 60% inhibition of peptide-induced proliferation was observed with as little as 20 μmol/L adenosine.
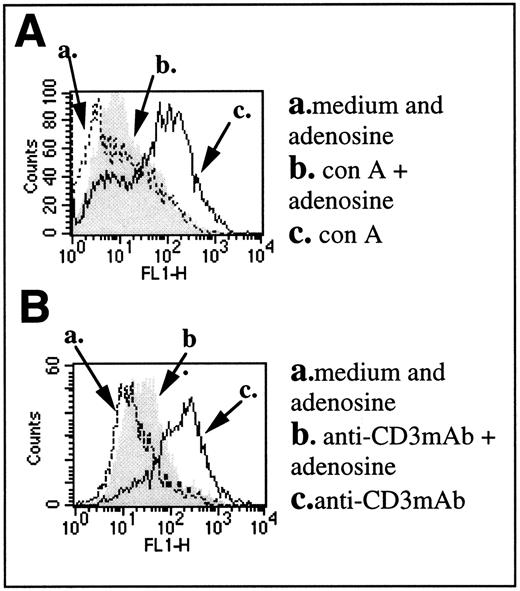
Similar results were obtained in studies of nontransgenic mice. The inhibition on TCR/CD3 complex-triggered CD25 upregulation by extracellular adenosine was also observed using anti-CD3ε MoAb-stimulated DBA-2 splenocytes (Fig 3B) or mitogen (con A)-stimulated cells (Fig 3A). Incubation with adenosine alone did not induce expression of CD25 in the absence of con A (traces a), but the presence of extracellular adenosine during incubation of splenocytes with activating stimuli resulted in strong inhibition of CD25 expression (compare traces b and c).
Extracellular adenosine inhibits TCR-triggered CD25 upregulation on mitogen or anti-TCR/CD3 complex MoAb-activated T lymphocytes from normal DBA-2 mice. (A and B) Expression of CD25 on T lymphocyte from DBA-2 mouse splenocytes stimulated with con A (A) or with plate-bound antimouse CD3ε (B) for 8 hours. Expression of CD25 in the presence of adenosine alone is indicated by an arrow (a). Expression of CD25 in the presence of con A or anti-CD3 MoAb alone is indicated by an arrow (c). Expression of con A- or anti-CD3 MoAb-induced CD25 in the presence of adenosine is indicated by an arrow (b).
Extracellular adenosine inhibits TCR-triggered CD25 upregulation on mitogen or anti-TCR/CD3 complex MoAb-activated T lymphocytes from normal DBA-2 mice. (A and B) Expression of CD25 on T lymphocyte from DBA-2 mouse splenocytes stimulated with con A (A) or with plate-bound antimouse CD3ε (B) for 8 hours. Expression of CD25 in the presence of adenosine alone is indicated by an arrow (a). Expression of CD25 in the presence of con A or anti-CD3 MoAb alone is indicated by an arrow (c). Expression of con A- or anti-CD3 MoAb-induced CD25 in the presence of adenosine is indicated by an arrow (b).
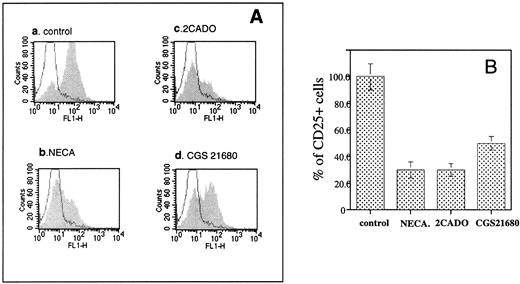
It was also found (Fig 4) that effects of adenosine on T lymphocytes were mimicked by low concentrations of extracellularly added and poorly metabolized analogs,8 2CADO (>60% inhibition at 10 μmol/L) and CGS21680 (about 50% inhibition by 20 μmol/L). NECA was also inhibitory (data not shown), but less so than 2CADO and CGS21680. The inhibition of CD25 expression by CGS21680 demonstrated in this experiment is especially important because chemical modifications make this adenosine analog resistant to enzymatic attack by both ADA and Ado kinase.8 25
The poorly hydrolyzable adenosine analogs NECA, 2CADO, and CGS21680 inhibit the TCR-triggered CD25 upregulation on mouse splenocytes. B10A TCR-transgenic mouse splenocytes were incubated at 5 × 10⁶ cells/mL with 1 μmol/L of cytochrome c peptide for 8 hours. The cells were then labeled with (1) FITC antimouse CD25, (2) PE antimouse TCRαβ, and (3) PI. CD25 expression on the TCR+ cells was evaluated by flow cytometry by gating for PI− (live) and PE-antimouse TCRαβ+ cells. The shaded histograms represent profiles of CD25 expression in the presence of extracellular adenosine. The solid histograms represent the CD25 level in unstimulated cells. Flow cytometry analysis of CD25+ cells among TCRαβ+ cells was performed as in Fig 1. (A) Graph a, control, TCR-triggered CD25 upregulation in the absence of adenosine; graph b, effect of NECA (200 μmol/L); graph c, effect of 2CADO (10 μmol/L); graph d, effect of CGS21680 (20 μmol/L). (B) Comparison of effects of adenosine analogs on TCR-triggered CD25 upregulation. The changes in percentages of the CD25+ cells among TCRαβ+ cells were calculated from data in (A).
The poorly hydrolyzable adenosine analogs NECA, 2CADO, and CGS21680 inhibit the TCR-triggered CD25 upregulation on mouse splenocytes. B10A TCR-transgenic mouse splenocytes were incubated at 5 × 10⁶ cells/mL with 1 μmol/L of cytochrome c peptide for 8 hours. The cells were then labeled with (1) FITC antimouse CD25, (2) PE antimouse TCRαβ, and (3) PI. CD25 expression on the TCR+ cells was evaluated by flow cytometry by gating for PI− (live) and PE-antimouse TCRαβ+ cells. The shaded histograms represent profiles of CD25 expression in the presence of extracellular adenosine. The solid histograms represent the CD25 level in unstimulated cells. Flow cytometry analysis of CD25+ cells among TCRαβ+ cells was performed as in Fig 1. (A) Graph a, control, TCR-triggered CD25 upregulation in the absence of adenosine; graph b, effect of NECA (200 μmol/L); graph c, effect of 2CADO (10 μmol/L); graph d, effect of CGS21680 (20 μmol/L). (B) Comparison of effects of adenosine analogs on TCR-triggered CD25 upregulation. The changes in percentages of the CD25+ cells among TCRαβ+ cells were calculated from data in (A).
The inhibitory effects of Ado analogs (Fig 4) were detected in conditions of suppressed transmembrane transport into cytoplasm and of inhibited catabolism into lymphotoxic deoxyadenosine or dATP, because inhibitors of ADA (coformycin) and of nucleoside transporter (NBTI) were added to further prevent their hydrolysis and transport into cytoplasm. The results in Figures 2-4 suggested that effects of adenosine could be mediated by transmembrane signaling rather than by intracellular lymphotoxic effects of its intracellularly metabolized catabolites.
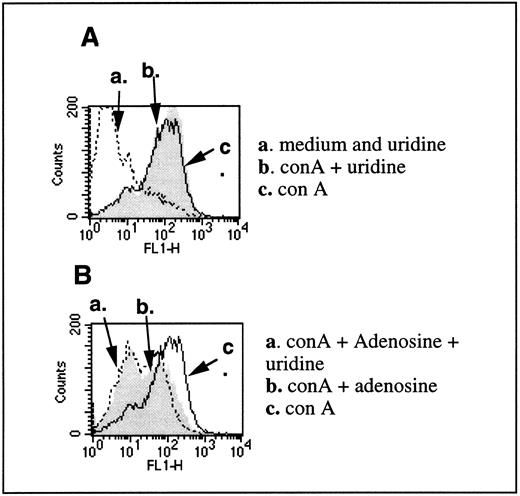
This was further supported by experiments in which the addition of uridine did not prevent inhibitory effects of extracellular adenosine on T cells (Fig 5). The addition of uridine in the assay had been used before to implicate the intracellular adenosine-induced pyrimidine nucleotide depletion in intracellular toxic effects of adenosine.26 The depletion of pyrimidine nucleotides correlated with the inhibition of cell growth, and the inhibition in cell growth by adenosine was prevented by uridine in conditions of intracellular adenosine-mediated lymphotoxicity with T-cell tumor cells.21
Uridine does not reverse inhibitory effects of adenosine on TCR-triggered CD25 upregulation. (A) CD25 levels were evaluated on T lymphocytes from DBA-2 mouse splenocytes that were stimulated with 4 μg/mL con A for 8 hours in the presence (arrow b) or absence (arrow c) of 200 μmol/L uridine. Arrow a represents the level of CD25 in the unstimulated cells with or without uridine. (B) Inhibition of con A-induced CD25 expression of 100 μmol/L adenosine is not reversed by the presence of uridine. Arrow a shows the inhibited expression of CD25 in con A-stimulated cells in the presence of both adenosine and uridine. Arrow b shows the inhibited expression of CD25 in con A-stimulated cells in the presence of adenosine. Arrow c shows the expression of CD25 in con A-stimulated cells in the absence of both adenosine and uridine. No coformycin or NBTI was used in this experiment. NBTI was omitted to allow the transport of uridine across cell membranes.
Uridine does not reverse inhibitory effects of adenosine on TCR-triggered CD25 upregulation. (A) CD25 levels were evaluated on T lymphocytes from DBA-2 mouse splenocytes that were stimulated with 4 μg/mL con A for 8 hours in the presence (arrow b) or absence (arrow c) of 200 μmol/L uridine. Arrow a represents the level of CD25 in the unstimulated cells with or without uridine. (B) Inhibition of con A-induced CD25 expression of 100 μmol/L adenosine is not reversed by the presence of uridine. Arrow a shows the inhibited expression of CD25 in con A-stimulated cells in the presence of both adenosine and uridine. Arrow b shows the inhibited expression of CD25 in con A-stimulated cells in the presence of adenosine. Arrow c shows the expression of CD25 in con A-stimulated cells in the absence of both adenosine and uridine. No coformycin or NBTI was used in this experiment. NBTI was omitted to allow the transport of uridine across cell membranes.
We found that uridine had no effect on con A-induced CD25 expression on its own (Fig 5A) and had no protective effects on adenosine-induced inhibition of con A-triggered CD25 upregulation on normal T cells (Fig 5B).
The role of extracellular adenosine-mediated signaling and intracellular cAMP accumulation in effects of adenosine on peripheral T cells.Taken together, the data described above (Figs 2-5) on effects of low concentrations of extracellular adenosine on T cells could not be explained by lymphotoxic effects of intracellularly accumulated adenosine and adenosine catabolites.
These considerations pointed to the need to consider the role of extracellular adenosine-mediated signaling in inhibition of T-cell activation and expansion. Indeed, ADA deficiency is accompanied by accumulation of extracellular adenosine,10 and it is known that extracellular Ado signals in different cell types through four subtypes of surface purinergic receptors.
The adenosine receptors (A1, A2a, A2b, and A3 subtypes) were shown to regulate levels of cAMP, [Ca++], [K+], and the phosphatidylinositol phosphate pathway.6,27 It is known that Gi-protein coupled A1 receptors cause a decrease in [cAMP]i, whereas Gs-protein coupled A2a and A2b receptors signal to increase intracellular [cAMP]i (reviewed in Olah and Stiles6 and Jacobson et al27 ).
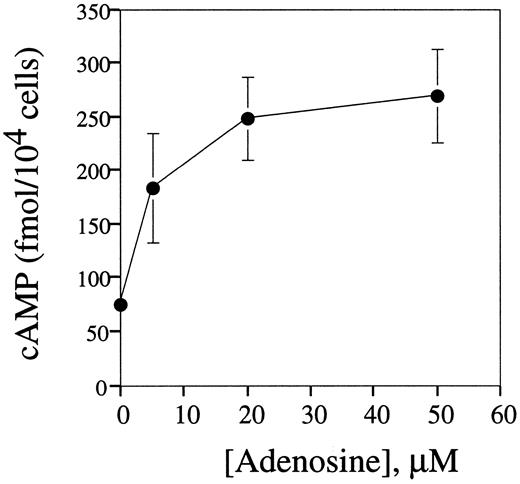
We found that as little as 10 μmol/L of extracellular adenosine increased the concentration of cAMP in splenocytes up to two to three times above basal levels, and the plateau in cAMP accumulation was reached at 20 μmol/L adenosine (Fig 6).
Extracellular adenosine triggers cAMP accumulation in mouse splenocytes. DBA-2 mouse splenocytes at 5 × 10⁶ cells/mL were preincubated on ice for 10 minutes with IBMX (50 μmol/L) and then distributed into wells of a 48-well plate and incubated (in 200 μL per well) with different concentrations of adenosine at 37°C for 60 minutes. The cAMP levels in cell extracts were estimated by enzyme-linked immunoassay as described in the Materials and Methods.
Extracellular adenosine triggers cAMP accumulation in mouse splenocytes. DBA-2 mouse splenocytes at 5 × 10⁶ cells/mL were preincubated on ice for 10 minutes with IBMX (50 μmol/L) and then distributed into wells of a 48-well plate and incubated (in 200 μL per well) with different concentrations of adenosine at 37°C for 60 minutes. The cAMP levels in cell extracts were estimated by enzyme-linked immunoassay as described in the Materials and Methods.
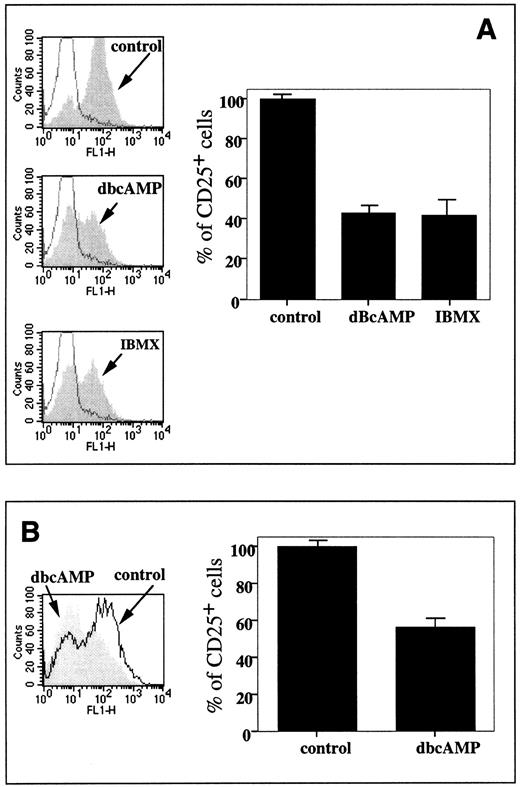
It is also shown that the increases in splenocyte cAMP levels mimicked the inhibitory effect of extracellular adenosine in reducing the CD25 expression level in both the TCR/peptide-triggered TCR-transgenic mouse splenocytes (Fig 7A) and in the normal con A-stimulated mouse splenocytes (Fig 7B). Both the addition of exogenous cAMP analog, dbcAMP, and the accumulation of endogenous cAMP due to the inhibition of cAMP phosphodiesterase (PDE) with IBMX resulted in a decrease of CD25 expression in TCR-transgenic T cells up to 40% of control levels (Fig 7A), whereas dBcAMP lowered CD25 expression in T cells from DBA-2 mice to about 55% of control levels (Fig 7B).
Increases in intracellular levels of cAMP mimic inhibitory effects of extracellular adenosine on CD25 expression. (A) Effect of 50 μmol/L dBcAMP and 50 μmol/L IBMX on CD25 level on TCR transgenic lymphocytes stimulated with 1 μmol/L cytochrome c for 8 hours. The experiment was performed as described in the legend to Fig 2. The histogram represents estimation of the effects of dBcAMP and IBMX on TCR-triggered CD25 upregulation among TCRαβ+ cells. (B) Effect of 50 μmol/L dBcAMP on CD25 level on 4 μg/mL con A-stimulated splenocytes. DBA-2 splenocytes were stimulated with con A for 8 hours and the percentage of CD25+ cells in the T subset was shown in the plots. The histogram represents estimation of effects of dBcAMP on con A-triggered CD25 upregulation among TCRαβ+ cells.
Increases in intracellular levels of cAMP mimic inhibitory effects of extracellular adenosine on CD25 expression. (A) Effect of 50 μmol/L dBcAMP and 50 μmol/L IBMX on CD25 level on TCR transgenic lymphocytes stimulated with 1 μmol/L cytochrome c for 8 hours. The experiment was performed as described in the legend to Fig 2. The histogram represents estimation of the effects of dBcAMP and IBMX on TCR-triggered CD25 upregulation among TCRαβ+ cells. (B) Effect of 50 μmol/L dBcAMP on CD25 level on 4 μg/mL con A-stimulated splenocytes. DBA-2 splenocytes were stimulated with con A for 8 hours and the percentage of CD25+ cells in the T subset was shown in the plots. The histogram represents estimation of effects of dBcAMP on con A-triggered CD25 upregulation among TCRαβ+ cells.
These results show that extracellular adenosine resembles another physiologically active molecule, prostaglandin E2, in the ability to both trigger cAMP accumulation and to inhibit CD25 expression28 and place extracellular adenosine among important and physiologically abundant immunoregulatory molecules in the lymphocyte environment.
The possibility of adenosine being toxic to lymphoid cells by virtue of its ability to increase the intracellular concentrations of cAMP in human peripheral lymphocytes29-31 and mouse thymocyte32 33 was raised many years ago, long before the description of [cAMP]i increase-inducing adenosine receptors. We asked whether adenosine-induced cAMP accumulation in lymphocytes could be assigned to signaling through known adenosine receptors.
The A2a receptor as the major [cAMP]i-inducing adenosine receptor in mouse splenocytes.Among the known adenosine receptor subtypes, only Gs protein-coupled A2a and A2b receptors27 are able to induce accumulation of cAMP. To determine the identity of receptors involved in effects of extracellular adenosine and responsible for [cAMP]i increases in splenocytes (Fig 6), we incubated lymphocytes with A2a receptor-specific agonist CGS21680 with high selectivity for the A2a versus the A2b adenosine receptor.34 The specific A2a adenosine receptor antagonist, CSC,6 25 was also used (Fig 8A).
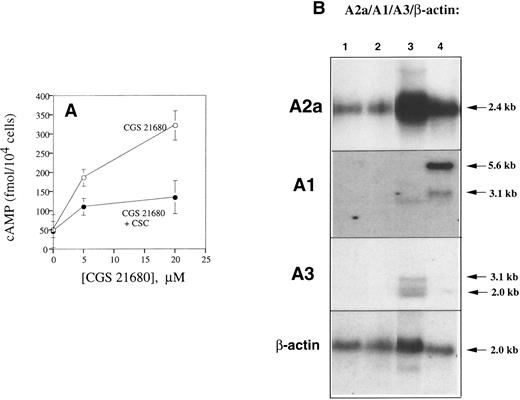
Identification of A2a receptors as the major type of adenosine receptor in mouse T lymphocytes. (A) Pharmacologic identification of A2a receptor as the major adenosine receptor in T lymphocytes. Specific A2a receptor agonist CGS21680 triggered cAMP accumulation in DBA-2 splenocytes, whereas specific A2a receptor antagonist CSC inhibited effects of CGS21680. DBA-2 mouse splenocytes (at 5 × 10⁶ cells/mL, 200 μL per well) were preincubated with or without 20 μmol/L CSC and then incubated with different concentrations of CGS21680 at 37°C for 60 minutes. cAMP PDE inhibitor (50 μmol/L), IBMX, was included to prevent catabolism of accumulated cAMP. The levels of cAMP were estimated by enzyme-linked immunoassay as described in the Materials and Methods. (B) A2a mRNA, but not the A1 or A3 mRNA, is the major expressed adenosine receptor message in DBA-2 lymphocytes. Mouse T-cell mRNA was isolated and analyzed as described in the Materials and Methods. The A2a receptor message (2.4-kb transcript) is detected in the poly A RNA samples from mouse splenocytes, lane 1; lymph node cells, lane 2; mastocytoma cell RNA, lane 3; and mouse brain RNA, lane 4. The A1 and A3 mRNA messages were detected only in positive controls, mouse brain RNA and mastocytoma cell RNA, respectively.
Identification of A2a receptors as the major type of adenosine receptor in mouse T lymphocytes. (A) Pharmacologic identification of A2a receptor as the major adenosine receptor in T lymphocytes. Specific A2a receptor agonist CGS21680 triggered cAMP accumulation in DBA-2 splenocytes, whereas specific A2a receptor antagonist CSC inhibited effects of CGS21680. DBA-2 mouse splenocytes (at 5 × 10⁶ cells/mL, 200 μL per well) were preincubated with or without 20 μmol/L CSC and then incubated with different concentrations of CGS21680 at 37°C for 60 minutes. cAMP PDE inhibitor (50 μmol/L), IBMX, was included to prevent catabolism of accumulated cAMP. The levels of cAMP were estimated by enzyme-linked immunoassay as described in the Materials and Methods. (B) A2a mRNA, but not the A1 or A3 mRNA, is the major expressed adenosine receptor message in DBA-2 lymphocytes. Mouse T-cell mRNA was isolated and analyzed as described in the Materials and Methods. The A2a receptor message (2.4-kb transcript) is detected in the poly A RNA samples from mouse splenocytes, lane 1; lymph node cells, lane 2; mastocytoma cell RNA, lane 3; and mouse brain RNA, lane 4. The A1 and A3 mRNA messages were detected only in positive controls, mouse brain RNA and mastocytoma cell RNA, respectively.
It is shown that as little as 5 μmol/L of specific A2a receptor agonist CGS2168034 strongly increased [cAMP] in splenocytes and that [cAMP] increase could be blocked by the specific A2a receptor antagonist CSC (Fig 8A). These experiments excluded a role for the A2b receptor and provided strong pharmacologic evidence that A2a receptor is the major receptor responsible for the effects of extracellular adenosine observed in this study.
Our studies of adenosine receptors mRNA expression in lymphoid tissues are in agreement with this pharmacologic evidence and also point to the A2a receptor as the major adenosine receptor subtype expressed in lymphocytes (Fig 8). Indeed, only the A2a mRNA transcript was detected in splenocytes using A1, A2a, and A3 cDNA probes (Fig 8B). Whereas no A1 and A3 receptor mRNA was detected in lymphocytes, we did detect the A1 and A3 receptor mRNA in positive controls (Fig 8B, mouse mastocytoma cells for A3 and mouse brain for A1 receptor).
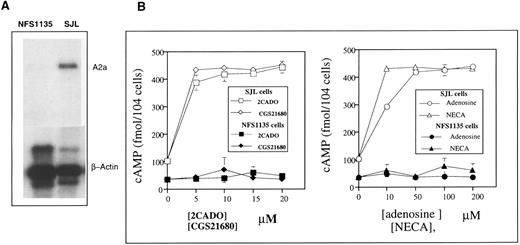
The experiment described in Fig 9 was designed to test the validity of Northern blot mRNA expression studies of normal splenocytes in correlating A2a receptor mRNA expression with its identification as the major functionally coupled receptor in lymphocytes. It is shown that the adenosine-triggered cAMP accumulation in mouse lymphoma cells correlates with expression of A2a receptors. We found that the NFS1135 lymphoid cell line has no detectable A2a mRNA, whereas the SJL lymphoid cell line did express A2a mRNA (Fig 9A). Similarly to observations with mouse lymphoid cells (Fig 8B), neither A1 nor A3 receptors mRNA could be detected in these two cell lines by Northern blot (data not shown).
The extracellular adenosine-triggered cAMP accumulation in mouse lymphoma cells correlates with expression of A2a receptors. (A) Mouse lymphoma cells SJL but not NFS1135 cells express A2a receptor mRNA. The isolation of mRNA and Northern blot studies were performed as described in the Materials and Methods. (B) The A2a receptor expressing SJL cells but not A2a receptor-negative NFS1135 cells accumulate cAMP after incubation with different concentrations of adenosine or adenosine analogs NECA, 2CADO, and CGS21680.
The extracellular adenosine-triggered cAMP accumulation in mouse lymphoma cells correlates with expression of A2a receptors. (A) Mouse lymphoma cells SJL but not NFS1135 cells express A2a receptor mRNA. The isolation of mRNA and Northern blot studies were performed as described in the Materials and Methods. (B) The A2a receptor expressing SJL cells but not A2a receptor-negative NFS1135 cells accumulate cAMP after incubation with different concentrations of adenosine or adenosine analogs NECA, 2CADO, and CGS21680.
In agreement with Northern blot data, only A2a mRNA-expressing SJL lymphoma cells — but not the A2a mRNA-negative NFS1135 lymphoid cells — respond by accumulation of cAMP after incubation with the A2a receptor-specific agonist CGS21680 or with adenosine, 2CADO, or NECA (Fig 9). These data further support the conclusion that the effects of extracellular adenosine on splenocytes are mediated by the A2a receptor, which is both the major expressed adenosine receptor and also the major functionally coupled receptor in lymphocytes.
DISCUSSION
The results reported here support the view that A2a adenosine receptor-mediated transmembrane signaling inhibits T-cell activation, proliferation, and expansion. These properties of adenosine could contribute to immunosuppressive mechanisms in, eg, hypoxic conditions11 and to those observed during ADA SCID lymphocyte depletion and immunodeficiency. ADA SCID was considered different from other primary immunodeficiencies that are related to defects in lymphocyte signaling pathways,35 because it is a systemic metabolic disorder. The results presented here open the possibility that ADA SCID could be also considered, at least in part, a signaling disease.
The lymphotoxicity observed in patients with ADA SCID is thought to be due mostly to the accumulation of deoxyadenosine and dATP, which inhibit ribonucleotide reductase needed for DNA synthesis (reviewed in Hirschhorn9 ). The excess of adenosine during ADA deficiency is believed to lead to accumulation of S-adenosyl homocysteine, which, in turn, could inhibit methylation reactions and contribute to SCID.12 In addition, the direct role of dATP in apoptosis induction was implied recently by a study in a cell-free system.13
Another not yet carefully explored and untested mechanism of damage of thymocytes and T cells by extracellular adenosine in ADA-deficient patients involves transmembrane signaling through adenosine receptors. We considered here the mechanism whereby the extracellular adenosine could affect the expansion and generation of functional T cells by blocking TCR-triggered expression of costimulatory molecules and of growth factor receptors.
Consideration of this alternative and/or complementary mechanism of thymocyte and T-cell damage is based on a description more than two decades old of increases in [cAMP] in lymphocytes29-31 and mouse thymocytes32,33 and of strong signaling (cAMP accumulation) and apoptotic effects36,37 of extracellular Ado on thymocytes in vitro. More recently, the inhibition of thymocyte differentiation in vitro by the cAMP-dependent signal transduction pathway was shown using fetal thymus organ culture.38
There were additional reasons to reinvestigate the effects of extracellular Ado on peripheral T lymphocytes. Indeed, the effects of increased concentrations of endogenous adenosine on the immune response during promising adenosine kinase inhibitor-induced antiinflammatory therapy4,5 should be fully appreciated. The effects of increased local concentrations of extracellular Ado on lymphocytes are also of interest due to the potential pharmacologic use of adenosine analogs6-8,25 and due to the possibility that extracellular adenosine interferes with antitumor immune responses.11
The effects of low concentrations of extracellular adenosine described in Figs 2-5 are best explained by adenosine receptor signaling rather than by lymphotoxic effects of intracellularly accumulated adenosine.
First, the nonhydrolyzable adenosine analogs were able to mimic inhibitory effects (Fig 4) of extracellular adenosine (Figs 2 and 3) with the effects of A2a receptor-specific agonist and hydrolysis-resistant8 25 CGS21680 providing especially strong pharmacologic evidence.
Second, complete inhibition of CD25 expression with no effect on lymphotoxicity was detected (Fig 2B) when low concentrations of extracellular adenosine were used in the experiment described in Fig 2.
Third, the inhibitory effect of extracellular adenosine on CD25 upregulation (Figs 2 and 3) was observed even when accumulation of intracellular adenosine was blocked (due to the transmembrane transport of extracellular adenosine) by the inhibitor of plasma membrane nucleoside transporter (NBTI).
One of the discussed possibilities is that effects of extAdo are due to the accumulation of increased levels of ATP and GTP in mouse lymphocytes. This is based on earlier observations during the 6 to 48 hours of incubation of a partial hypoxanthine phosphoribosyltransferase-deficient MOLT-HPRT cell line.39 The ability of NBTI to block nucleotide transporter was shown in parallel studies of adenosine transport into thymocytes and CD4+ and CD8+ mouse T cells (P. Zoetewej et al, unpublished results) by flow cytometry using the SAENTA-xf8 fluorescent probe that specifically binds to equilibrative nucleoside transporter. However, the possibility still exists that adenosine translocation is not completely blocked by NBTI.
Finally, the addition of uridine did not protect against the inhibitory effects of extracellular adenosine on T cells (Fig 5), as was shown previously in conditions of intracellular adenosine-mediated lymphotoxicity with T-cell tumors.21 26
It will be interesting to explore in future studies whether there are differences between normal and transformed T cells in their susceptibility to toxic and inhibitory effects of extracellular versus intracellular adenosine. It is possible that intracellular lymphotoxicity of adenosine is much more consequential in fast-growing cells and that this is why the addition of uridine protected them.21 On the other hand, in slowly proliferating normal T cells, the signaling effects of extracellular adenosine could be sufficient to cause strong inhibition of a particular response, eg, CD25 expression or short-term effector function (data not shown).
The working model of the mechanisms of lymphocyte depletion by extracellular adenosine in conditions of ADA SCID is based on the assumption that even moderate increases in extracellular adenosine could result in increased signaling through A2a receptors. This signaling could block antigen/TCR-triggered expression of CD25 (IL-2 receptors) and thereby prevent proliferation and expansion of lymphocytes. It remains to be determined whether the activated T cells are more vulnerable to extracellular adenosine due to the increase in A2a receptor expression in TCR-triggered cells, as we have recently shown with the expression of p2y class purinergic receptors in murine thymocytes.40
The results described here are consistent with this A2a receptor signaling-based model, but genetic evidence is needed in the future to conclusively implicate this mechanism in the effects of ADA inhibition and in the effects of extracellular adenosine in hypoxic conditions. Such evidence is expected to come with the availability of A2a receptor gene knock-out mice and development of reproducible, adenosine receptor mRNA expression-targeting techniques.
If proven to be correct, this purinergic receptor-based mechanism could provide a more clear understanding of ADA SCID and may point to novel treatment strategies and to the possible therapeutic use of pharmaceuticals that interfere with Ado-receptor signaling pathways.
ACKNOWLEDGMENT
The authors thank Jane Hu Li (Laboratory of Immunology, NIAID, NIH) for help with TG mice; Diana L. Marquardt, MD (University of California, San Diego) for A1, A2a, and A2b cDNAs; Dr David Grandy, Vollum (Institute for Advanced Biomedical Studies, Portland,OR) for A3 cDNA; Jeff Nyswaner for splenocyte isolation; and Brenda Rae Marshall and Shirley Starnes for editorial help.
Address reprint requests to Michail Sitkovsky, PhD, LI, NIAID, NIH, Bldg 10, Room 11N311, 10 Center Dr, MSC 1892, Bethesda, MD 20892-1892.

This feature is available to Subscribers Only
Sign In or Create an Account Close Modal