Abstract
In response to granulocyte-macrophage colony-stimulating factor plus tumor necrosis factor α, cord blood CD34+ hematopoietic progenitor cells differentiate along two unrelated dendritic cell (DC) pathways: (1) the Langerhans cells (LCs), which are characterized by the expression of CD1a, Birbeck granules, the Lag antigen, and E cadherin; and (2) CD14+ cell-derived DCs, characterized by the expression of CD1a, CD9, CD68, CD2, and factor XIIIa (Caux et al, J Exp Med 184:695, 1996). The present study investigates the functions of each population. Although the two populations are equally potent in stimulating naive CD45RA cord blood T cells through apparently identical mechanisms, each also displays specific activities. In particular CD14-derived DCs show a potent and long-lasting (from day 8 to day 13) antigen uptake activity (fluorescein isothiocyanate dextran or peroxidase) that is about 10-fold higher than that of CD1a+ cells, which is restricted to the immature stage (day 6). The antigen capture is exclusively mediated by receptors for mannose polymers. The high efficiency of antigen capture of CD14-derived cells is coregulated with the expression of nonspecific esterase activity, a tracer of lysosomial compartment. In contrast, the CD1a+ population never expresses nonspecific esterase activity. The most striking difference is the unique capacity of CD14-derived DCs to induce naive B cells to differentiate into IgM-secreting cells, in response to CD40 triggering and interleukin-2. Thus, although the two populations can allow T-cell priming, initiation of humoral responses might be preferentially regulated by the CD14-derived DCs. Altogether, those results show that different pathways of DC development might exist in vivo: (1) the LC type, which might be mainly involved in cellular immune responses, and (2) the CD14-derived DC related to dermal DCs or circulating blood DCs, which could be involved in humoral immune responses.
REQUIRED FOR THE initiation of immune responses, dendritic cells (DCs) are professional antigen presenting cells, present at trace level in all organs.1 It is believed that the various DCs encountered in the different organs are interconnected by defined pathways of migration and represent different stages of maturation of a unique DC lineage. In the periphery, during an injury, DCs such as the Langerhans cells (LCs) in the epidermis capture the antigen and then migrate through the afferent lymph stream to the T-cell–rich areas of the regional draining lymph nodes where they present the processed antigen to naive T cells and induce an antigen-specific primary T-cell response.2-8 This T-cell activation is then followed by cognate interactions between antigen-specific T and B cells yielding to primary antibody formation.9-11 These functions of DCs have been shown in vivo in mice using mainly splenic DCs.12-16 The recent description of different DC populations within secondary lymphoid organs such as spleen,17 Peyer Patches,18 and tonsil19 raises the possibility that the different phases of immune responses (T-cell priming and primary antibody responses) might be regulated by different DC populations. In this respect, thymic DCs in mice appear to originate from a hematopoietic progenitor with lymphoid but no myeloid potential.20 This subset might have been identified also in humans.21 In contrast, DCs related to LCs generated in vitro from hematopoietic progenitors using granulocyte-macrophage colony-stimulating factor (GM-CSF ) in mice22-24 or GM-CSF plus tumor necrosis factor (TNF ) α in humans25,26 appear to originate from a progenitor common to monocytes and granulocytes.27-29 Thus, different lineages of DCs may exist.
In a recent study,30 we showed that human myeloid progenitors can differentiate in a unique culture condition (GM-CSF plus TNFα ), along two unrelated DC pathways: the LC, which is characterized by the expression of CD1a, Lag, Birbeck granules (BGs), and E cadherin; and a CD14-derived DC, which is characterized by the expression of CD1a, CD9, CD2, and factor XIIIa. In the present study, we investigate the respective function of the two populations. We show that these two subsets display the properties expected for DCs, including priming of naive T cells and antigen capture, but in cocultures with CD40-activated naive B cells only the CD14-derived DCs can induce the production of IgM in response to interleukin-2 (IL-2). These results might suggest that initiation of humoral responses is possibly preferentially regulated by the CD14-derived DC type, whereas T-cell priming can be controlled by both populations.
MATERIALS AND METHODS
Hematopoietic factors, reagents, and cell lines.Recombinant human (rh) GM-CSF (specific activity, 2 × 10⁶ U/mg; Schering-Plough Research Institute, Kenilworth, NJ) was used at a saturation concentration of 100 ng/mL (200 U/mL). rhTNFα (specific activity, 2 × 10⁷ U/mg; Genzyme, Boston, MA) was used at an optimal concentration of 2.5 ng/mL (50 U/mL).31 rh stem cell factor (rhSCF; specific activity 4 × 10⁵ U/mg; R&D, Abington, UK) was used at an optimal concentration of 25 ng/mL. rhIL-2 (specific activity, 3 × 10⁶ U/mg; Amgen, Thousand Oaks, CA) was used at an optimal concentration of 20 U/mL. Staphylococcal enterotoxin A (SEA; Sigma, St Louis, MO) was used at 1 ng/mL. rhIL-10 (specific activity, 2 × 10⁷ U/mg, Schering-Plough Research Institute) was used at 50 ng/mL. Monoclonal antibodies (MoAbs) against CD80 (Mab 104),32 and CD86 (IT2-2; Pharmingen, San Diego, CA) were used at 10 μg/mL. Lysine-fixable fluorescein isothiocyanate (FITC) dextran (Molecular Probes Inc, Eugene, OR) was used in most experiments at 0.1 mg/mL. Horseradish peroxidase (HRP) was purchased from Sigma. Mannan from Saccharomyces cerevisiae (Sigma) was used at 1 mg/mL. Anti-mannose receptor (3.29, generated in the laboratory of Dr Lanzavecchia, Basel, Switzerland) was used as a hybridoma supernatant at 10% and 50% (vol/vol).
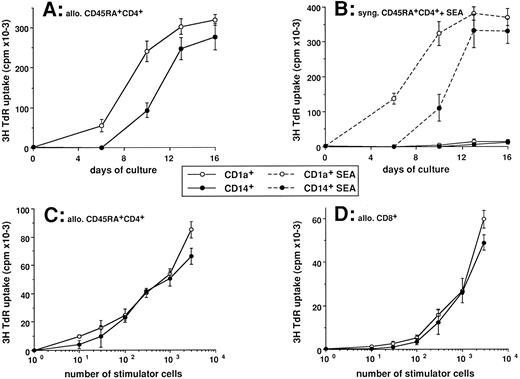
Efficient naive T-cell proliferation is induced by CD1a-or CD14-derived DCs. Cord blood CD34+ HPCs were cultured in the presence of GM-CSF plus TNFα. After 5 to 6 days cells were collected, processed for double staining using anti-CD14–PE and anti-CD1a–FITC, and FACS-sorted into CD14−CD1a+ and CD14+CD1a−. Sorted cells were seeded in the presence of GM-CSF plus TNFα (1 to 2 × 10⁵ cells/mL) for 6 to 7 additional days, with last medium changes being performed at day 10. (A and B) At the indicated time points, independent aliquots of cells were harvested and used, after irradiation (30 Gy), as stimulator cells for CD45RA+ CD4+ naive cord blood T cells (2 × 10⁴ cells/well). For day 0, uncultured CD34+ HPCs were used as stimulator cells. T cells from the same batches were used each time after thawing. Proliferation of allogeneic T cells induced by 103 stimulator cells is shown (A). Proliferation of syngeneic T cells in absence or presence of 1 ng/mL SEA induced by 102 stimulator cells is shown in (B). (C and D) Cells were recovered at day 12 and used after irradiation (30 Gy) as stimulator cells for cord blood CD45RA+ CD4+ T cells (2 × 10⁴ cells/well; C) or cord blood CD8+ T cells (2 × 10⁴ cells/well; D). Proliferation was shown by 3H-TdR uptake after 5 days of culture. Results are expressed as mean cpm ± SD of triplicate cultures. Results of each panel are representative of three experiments or more.
Efficient naive T-cell proliferation is induced by CD1a-or CD14-derived DCs. Cord blood CD34+ HPCs were cultured in the presence of GM-CSF plus TNFα. After 5 to 6 days cells were collected, processed for double staining using anti-CD14–PE and anti-CD1a–FITC, and FACS-sorted into CD14−CD1a+ and CD14+CD1a−. Sorted cells were seeded in the presence of GM-CSF plus TNFα (1 to 2 × 10⁵ cells/mL) for 6 to 7 additional days, with last medium changes being performed at day 10. (A and B) At the indicated time points, independent aliquots of cells were harvested and used, after irradiation (30 Gy), as stimulator cells for CD45RA+ CD4+ naive cord blood T cells (2 × 10⁴ cells/well). For day 0, uncultured CD34+ HPCs were used as stimulator cells. T cells from the same batches were used each time after thawing. Proliferation of allogeneic T cells induced by 103 stimulator cells is shown (A). Proliferation of syngeneic T cells in absence or presence of 1 ng/mL SEA induced by 102 stimulator cells is shown in (B). (C and D) Cells were recovered at day 12 and used after irradiation (30 Gy) as stimulator cells for cord blood CD45RA+ CD4+ T cells (2 × 10⁴ cells/well; C) or cord blood CD8+ T cells (2 × 10⁴ cells/well; D). Proliferation was shown by 3H-TdR uptake after 5 days of culture. Results are expressed as mean cpm ± SD of triplicate cultures. Results of each panel are representative of three experiments or more.
The murine CD40 ligand-transfected cell line (CD40-L L cells) was produced in the laboratory and used as stimulator of B-cell proliferation and differentiation.33
Collection and purification of cord blood CD34+ HPCs.Umbilical cord blood samples were obtained according to institutional guidelines. Cells bearing CD34 antigen were isolated from mononuclear fractions34,35 through positive selection using anti-CD34 MoAbs (Immu-133.3; Immunotech, Marseille, France) and goat antimouse IgG-coated microbeads (Miltenyi Biotec GmBH, Bergish Gladbach, Germany). Isolation of CD34+ progenitors was achieved using Minimacs separation columns (Miltenyi Biotec) as described.34 35 In all experiments the isolated cells were 80% to 99% CD34+ as judged by staining with anti-CD34 MoAb. After purification, CD34+ cells were cryopreserved in 10% dimethyl sulfoxide.
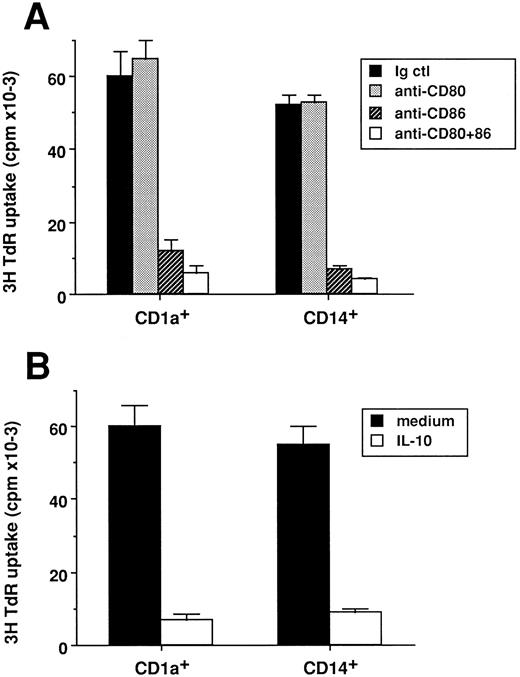
Both CD1a- or CD14-derived DC-induced T-cell priming are inhibited by anti-CD86 or IL-10. CD1a- and CD14-derived DC subsets were obtained as described in Materials and Methods and in the legend to Fig 1. At day 14, cells were used after irradiation (30 Gy) as stimulator cells (103 cells/well) for cord blood CD4+ T cells (2 × 10⁴ cells/well). (A) Experiments were performed in the presence of 10 μg/mL of anti-CD80 (Mab 104), anti-CD86 (IT2-2), anti-CD80 plus anti-CD86, or isotype match control. (B) Experiments were performed in the presence or absence of IL-10 (50 ng/mL). Proliferation was shown by 3H-TdR uptake after 5 days of culture. Results are expressed as mean cpm ± SD of triplicate cultures. Results of each panel are representative of three experiments.
Both CD1a- or CD14-derived DC-induced T-cell priming are inhibited by anti-CD86 or IL-10. CD1a- and CD14-derived DC subsets were obtained as described in Materials and Methods and in the legend to Fig 1. At day 14, cells were used after irradiation (30 Gy) as stimulator cells (103 cells/well) for cord blood CD4+ T cells (2 × 10⁴ cells/well). (A) Experiments were performed in the presence of 10 μg/mL of anti-CD80 (Mab 104), anti-CD86 (IT2-2), anti-CD80 plus anti-CD86, or isotype match control. (B) Experiments were performed in the presence or absence of IL-10 (50 ng/mL). Proliferation was shown by 3H-TdR uptake after 5 days of culture. Results are expressed as mean cpm ± SD of triplicate cultures. Results of each panel are representative of three experiments.
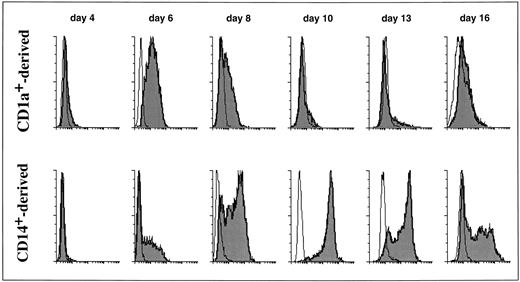
Differential uptake of FITC dextran by CD1a- and CD14-derived DCs during maturation. Cord blood CD34+ HPCs were cultured in the presence of GM-CSF plus TNFα. After 5 to 6 days, cells were collected and half were processed for double staining, using anti-CD14–PE and anti-CD1a–FITC, and FACS-sorted into CD14+CD1a−. Half of the cells were processed for double staining, using anti-CD14–FITC and anti-CD1a–PE, and FACS-sorted into CD14−CD1a+. Using this procedure, the sorted populations were labeled with PE, thus, avoiding interferences with FITC dextran. Sorted cells were seeded in the presence of GM-CSF plus TNFα (1 to 2 × 10⁵ cells/mL) for 6 to 7 additional days with last medium changes being performed at day 10. At the indicated time points, cells were processed for FITC dextran uptake. Cells were incubated in medium containing 0.1 mg/mL FITC dextran at 37°C for 15 minutes, washed with cold medium, and analyzed on a FACScan. For days 4 and 6, FITC dextran uptake was performed on total populations by double color fluorescence using anti-CD1a–PE or anti-CD14–PE. The same parameters of the FACScan were used during the kinetic. Results are representative of three independent experiments.
Differential uptake of FITC dextran by CD1a- and CD14-derived DCs during maturation. Cord blood CD34+ HPCs were cultured in the presence of GM-CSF plus TNFα. After 5 to 6 days, cells were collected and half were processed for double staining, using anti-CD14–PE and anti-CD1a–FITC, and FACS-sorted into CD14+CD1a−. Half of the cells were processed for double staining, using anti-CD14–FITC and anti-CD1a–PE, and FACS-sorted into CD14−CD1a+. Using this procedure, the sorted populations were labeled with PE, thus, avoiding interferences with FITC dextran. Sorted cells were seeded in the presence of GM-CSF plus TNFα (1 to 2 × 10⁵ cells/mL) for 6 to 7 additional days with last medium changes being performed at day 10. At the indicated time points, cells were processed for FITC dextran uptake. Cells were incubated in medium containing 0.1 mg/mL FITC dextran at 37°C for 15 minutes, washed with cold medium, and analyzed on a FACScan. For days 4 and 6, FITC dextran uptake was performed on total populations by double color fluorescence using anti-CD1a–PE or anti-CD14–PE. The same parameters of the FACScan were used during the kinetic. Results are representative of three independent experiments.
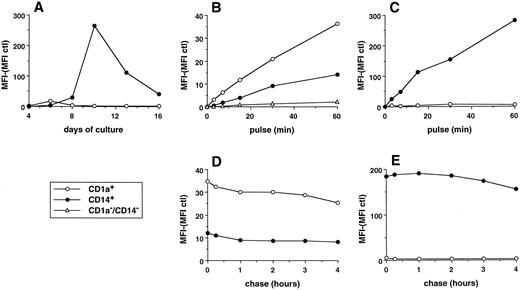
Parameters of FITC dextran accumulation in day-6 CD1a-DC precursors and day-11 CD14-derived DCs. (A) MFI of histograms shown in Fig 3. The background fluorescence (cells pulsed at 4°C) was subtracted. (B and C) Cells were pulsed with 0.1 mg/mL FITC dextran at 37°C for various times, washed with cold medium, and analyzed on a FACScan. Uptake of FITC dextran was performed at day 6 on total population by double color fluorescence using, after pulse with FITC dextran, anti-CD1a–PE (CD1a+ cells), anti-CD14–PE (CD14+ cells), and anti-CD1a–PE plus anti-CD14–PE (CD14−CD1a− cells; B). Uptake of FITC dextran was performed at day 11 by single color fluorescence on the sorted populations (C). (D and E) Cells were pulsed with 0.1 mg/mL FITC dextran for 15 minutes at 37°C, washed with cold medium, and analyzed immediately or after culture at 37°C for various times in marker-free medium. Chase was performed at day 6 on total populations by double color fluorescence (D). Chase was performed at day 11 by single color fluorescence on the sorted populations (E). Results of each panel are representative of three experiments or more.
Parameters of FITC dextran accumulation in day-6 CD1a-DC precursors and day-11 CD14-derived DCs. (A) MFI of histograms shown in Fig 3. The background fluorescence (cells pulsed at 4°C) was subtracted. (B and C) Cells were pulsed with 0.1 mg/mL FITC dextran at 37°C for various times, washed with cold medium, and analyzed on a FACScan. Uptake of FITC dextran was performed at day 6 on total population by double color fluorescence using, after pulse with FITC dextran, anti-CD1a–PE (CD1a+ cells), anti-CD14–PE (CD14+ cells), and anti-CD1a–PE plus anti-CD14–PE (CD14−CD1a− cells; B). Uptake of FITC dextran was performed at day 11 by single color fluorescence on the sorted populations (C). (D and E) Cells were pulsed with 0.1 mg/mL FITC dextran for 15 minutes at 37°C, washed with cold medium, and analyzed immediately or after culture at 37°C for various times in marker-free medium. Chase was performed at day 6 on total populations by double color fluorescence (D). Chase was performed at day 11 by single color fluorescence on the sorted populations (E). Results of each panel are representative of three experiments or more.
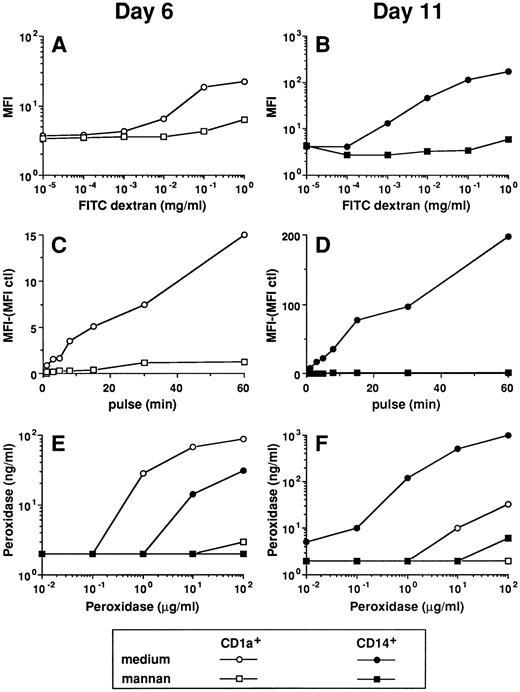
FITC dextran and HRP uptake by the two DC subpopulations is mediated through receptors for mannose polymers. The experiments of FITC dextran uptake were performed on day-6 CD1a precursors by double color fluorescence (A and C) and on day-11 CD14-derived DCs (B and D; see legend to Figs 3 and 4). The uptake of HRP was performed on day-6 and day-11 CD1a+- and CD14-derived cells (E and F ). (A and B) Cells were pulsed for 15 minutes at 37°C with various concentrations of FITC dextran in the absence or in the presence of 1 mg/mL mannan. (C and D) Cells were pulsed for various times at 37°C with 0.1 mg/mL FITC dextran in the absence or in the presence of 1 mg/mL mannan. (E and F ) Cells were pulsed for 15 minutes at 37°C with various concentrations of HRP in the absence or in the presence of 1 mg/mL mannan. Results of each panel are representative of three experiments or more.
FITC dextran and HRP uptake by the two DC subpopulations is mediated through receptors for mannose polymers. The experiments of FITC dextran uptake were performed on day-6 CD1a precursors by double color fluorescence (A and C) and on day-11 CD14-derived DCs (B and D; see legend to Figs 3 and 4). The uptake of HRP was performed on day-6 and day-11 CD1a+- and CD14-derived cells (E and F ). (A and B) Cells were pulsed for 15 minutes at 37°C with various concentrations of FITC dextran in the absence or in the presence of 1 mg/mL mannan. (C and D) Cells were pulsed for various times at 37°C with 0.1 mg/mL FITC dextran in the absence or in the presence of 1 mg/mL mannan. (E and F ) Cells were pulsed for 15 minutes at 37°C with various concentrations of HRP in the absence or in the presence of 1 mg/mL mannan. Results of each panel are representative of three experiments or more.
Purification of cord blood T cells.Mononuclear cells were isolated from cord blood and depleted of adherent cells by overnight adherence to plastic in complete medium at 1 × 10⁶ cells/mL. Total CD4 T lymphocytes were then purified by immunomagnetic depletion using a cocktail of MoAbs IOM2 (CD14), ION16 (CD16), ION2 (HLA-DR; Immunotech, Marseille, France), NKH1 (CD56), OKT8 (CD8; Ortho Diagnostic System, Raritan, NJ), 4G7 (CD19), and Mab 89 (CD40).36 For CD45RA+ CD4+ T-cell purification UCHL-1 (CD45RO) was added to the cocktail of MoAbs. For CD8+ T-cell purification, anti-CD4 (Sigma) was used instead of anti-CD8. After two rounds of bead depletion, the purity of CD4+ T cells was routinely higher than 95% and that of CD45RA+ CD4+ T cells and CD8+ T cells was higher than 90%.
Isolation of tonsillar IgD+ B cells.Mononuclear cells from tonsils were isolated by a standard Ficoll-Hypaque (density, 1,077 g/mL) gradient method. Tonsillar B cells were first enriched in the E− fraction and submitted to anti-CD2, anti-CD4, anti-CD8, anti-CD14, anti-CD16 MoAb negative selection with magnetic beads coated with antimouse IgG (Dynabeads; Dynal, Oslo, Norway). In the isolated population, greater than 99% expressed CD19 or CD20 and less than 1% expressed CD2 or CD14 Ags. Isolation of sIgD+ B-cell subpopulation was performed using a preparative magnetic cell sorter (Miltenyi Biotec). The separation based on sIgD expression has been described in details elsewhere.37 IgD was expressed on greater than 99% of the sIgD+ B-cell subpopulation as assessed by fluorescence analysis using a FACScan (Becton Dickinson, Sunnyvale, CA).
Liquid cultures for DC generation.Cultures were established in the presence of SCF, GM-CSF, and TNFα, as described,25 26 in endotoxin-free medium consisting of RPMI 1640 (GIBCO, Grand Island, NY) supplemented with 10% (vol/vol) heat-inactivated fetal bovine serum (FBS; Flow Laboratories, Irvine, UK), 10 mmol/L HEPES, 2 mmol/L L-glutamine, 5 × 10⁻⁵ mol/L 2-mercaptoethanol, penicillin (100 U/mL), and streptomycin (100 μg/mL; referred to as complete medium).
After thawing, CD34+ cells were seeded for expansion in 25- to 75-cm2 culture vessels (Linbro; Flow Laboratories, Mc Lean, VA) at 2 × 10⁴ cells/mL. Optimal conditions were maintained by splitting these cultures at day 4 with medium containing fresh GM-CSF and TNFα (cell concentration, 1 to 3 × 10⁵ cells/mL). For most experiments, cells were routinely collected after 5 to 6 days of culture for fluorescence-activated cell sorting (FACS). Culture medium was supplemented with 2.5% AB+ pooled human serum at the initiation of the cultures, and by day 5 to 6 human serum was washed away.
Isolation of CD1a and CD14 DC precursors by FACS.After 5 to 6 days of culture in the presence of SCF, GM-CSF, and TNFα , cells were collected and labeled with FITC-conjugated OKT6 (CD1a; Ortho) and phycoerythrin (PE)-conjugated Leu-M3 (CD14; Becton Dickinson, San Jose, CA), as described.30 Cells were separated according to CD1a and CD14 expression into CD14+CD1a−, CD14−CD1a+ fractions using a FACStarplus (laser setting: power, 250 mW, excitation wavelength 488 nm; Becton Dickinson, Sunnyvale, CA). For some specific experiments (see FITC-dextran capture) FACS of CD14−CD1a+ cells was performed after staining with PE-conjugated T6 (CD1a; Coulter, Hialeah, FL) and FITC-conjugated Leu-M3 (CD14; Becton Dickinson, San Jose, CA). All the procedures of staining and sorting were performed in the presence of 0.5 mmol/L EDTA to avoid cell aggregation. Reanalysis of the sorted populations showed a purity higher than 98%, the other cells were undetermined myeloid cells (T cells could never be detected even by polymerase chain reaction [PCR]).
Sorted cells were seeded in the presence of GM-CSF plus TNFα (1 to 2 × 10⁵ cells/mL) for 6 to 7 additional days with a last medium change being performed at day 10. Cells were routinely collected between day 11 and day 14; eventually adherent cells were recovered using a 0.5-mmol/L EDTA solution.
Quantitation of endocytosis using FITC dextran capture followed by FACS analysis.The procedure for measuring FITC dextran uptake was previously described.38 Briefly, at the indicated time points cells were harvested and resuspended in 10% FBS medium buffered with 25 mmol/L HEPES at 37°C in a water bath. FITC dextran was added at the final concentration of 0.1 mg/mL and for 15 minutes, if not otherwise indicated. The cells were washed four times with cold phosphate-buffered saline (PBS) containing 1% FBS and 0.01% NaN3. For experiments performed on total populations, at day 4 and 6 double staining was made using anti-CD1a–PE or anti-CD14–PE. In some experiments, the cells were pulsed at 37°C; washed four times in cold medium, and cultured at 37°C for different times in marker-free medium. After staining, cells were analyzed on a FACScan. When the results were expressed as mean fluorescence intensity, the background (cells pulsed with FITC dextran at 4°C) was subtracted, if not otherwise indicated.
Quantitation of endocytosis by HRP capture.The procedure for measuring HRP uptake was previously described.38 Briefly, at the indicated time points, cells were harvested and resuspended in 10% FBS medium buffered with 25 mmol/L HEPES at 37°C in a water bath. HRP was added at the final concentration of 0.1 μg/mL to 0.1 mg/mL for 15 minutes. The cells were washed four times with cold PBS containing 1% FBS and 0.01% NaN3 and lysed with 0.05% Triton X-100 in 10 mmol/L Tris buffer, pH 7.4, for 30 minutes. After centrifugation (10 minutes, 600g), enzyme activity of the lysate was measured using o-phenylenediamine and H2O2 as substrate with reference to a standard curve.
Nonspecific esterase staining.Cells were cytocentrifuged for 5 minutes at 500 rpm on a microscope slide. Slides were used for nonspecific esterase staining (α-naphthyl acetate esterase staining kit; Sigma).
T-cell proliferation assay.During culture in GM-CSF plus TNFα, CD34+ HPC-derived cells were collected and, after irradiation (30 Gy), were used as stimulator cells for resting allogeneic or syngeneic T cells (2 × 10⁴ per well), as described.39 40 After 5 days of incubation, cells were pulsed with 1 μCi of 3H-TdR (specific activity, 25 Ci/mmol) per well, for the last 8 hours; harvested; and counted. Tests were performed in triplicate, and results were expressed as mean counts per minute (cpm) ± standard deviation (SD). The levels of 3H-TdR uptake by stimulator cells alone were always below 100 cpm.
Coculture of B cells and DCs.A total of 2.5 × 10³ irradiated CD40-L–transfected L cells (75 Gy) were seeded together with 104 IgD+ B lymphocytes in the presence or absence of irradiated (30 Gy) DC subsets (3 × 10³ per well) in 96-well culture plates (Nunc, Roskilde, Denmark), as described.41 For measurement of proliferation, cells were pulsed after 5 days of incubation with 1 μCi of 3H-TdR (specific activity, 25 Ci/mmol) per well for the last 8 hours, harvested, and counted. Tests were performed in triplicate, and results were expressed as mean cpm ± SD. The levels of 3H-TdR uptake by stimulator cells alone were always below 100 cpm. For determination of IgM production, supernatants were recovered after 15 days and used for indirect enzyme-linked immunosorbent assay (ELISA).42 Control for emergence of contaminating T cells were routinely performed, and CD3+ cells were never detected at any time point tested.41
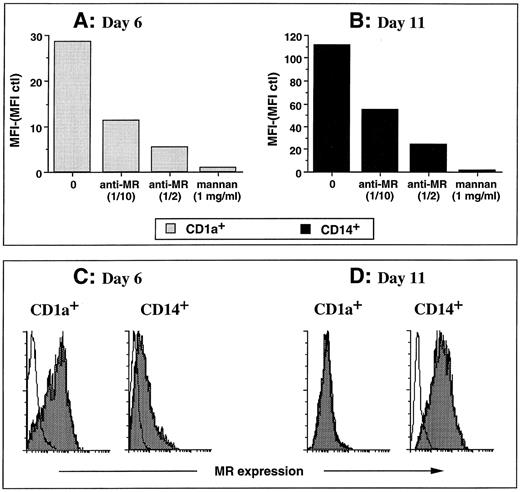
FITC dextran and HRP uptake by the two DC subpopulations are mediated through mannose receptors. (A and B) The experiments were performed on day-6 CD1a precursors by double color fluorescence (A) and on day-11 CD14-derived DCs (B). Cells were pulsed for 15 minutes at 37°C with 0.1 mg/mL FITC dextran in the presence of medium, 10% supernatant MoAb anti-mannose receptor (anti-MR), 50% supernatant MoAb anti-MR, or 1 mg/mL mannan. (C) Cells were processed at day 6 for double staining using anti-MR shown by PE-conjugated antimouse Ig. Then, after saturation in 5% mouse serum, cells were stained with anti-CD14–FITC or anti-CD1a–FITC. A total of 20,000 events were acquired. Histograms show PE staining gated on CD1a+ cells (left) or on CD14+ cells (right). (D) CD1a- and CD14-derived DC subsets, obtained as described in Materials and Methods and in the legend to Fig 1, were processed at day 11 for single staining using anti-MR shown by PE-conjugated antimouse Ig. A total of 5,000 events were acquired. White histograms represent isotype matched control. Results of each panel are representative of three experiments or more.
FITC dextran and HRP uptake by the two DC subpopulations are mediated through mannose receptors. (A and B) The experiments were performed on day-6 CD1a precursors by double color fluorescence (A) and on day-11 CD14-derived DCs (B). Cells were pulsed for 15 minutes at 37°C with 0.1 mg/mL FITC dextran in the presence of medium, 10% supernatant MoAb anti-mannose receptor (anti-MR), 50% supernatant MoAb anti-MR, or 1 mg/mL mannan. (C) Cells were processed at day 6 for double staining using anti-MR shown by PE-conjugated antimouse Ig. Then, after saturation in 5% mouse serum, cells were stained with anti-CD14–FITC or anti-CD1a–FITC. A total of 20,000 events were acquired. Histograms show PE staining gated on CD1a+ cells (left) or on CD14+ cells (right). (D) CD1a- and CD14-derived DC subsets, obtained as described in Materials and Methods and in the legend to Fig 1, were processed at day 11 for single staining using anti-MR shown by PE-conjugated antimouse Ig. A total of 5,000 events were acquired. White histograms represent isotype matched control. Results of each panel are representative of three experiments or more.
CD40 activation of DC subsets.A total of 105 CD1a- or CD14-derived DCs were cultured with 2.5 × 10⁴ irradiated CD40-L–transfected L cells (or control L cells) in a final volume of 1 mL in 24-well culture plates, as described.43 After 4 days of culture, cells were gently recovered and used for staining experiments.
Cytofluorometric cell-surface phenotyping.Cells were processed for double staining (day 6) or single staining (day 12 sorted populations), as previously described.30
Binding of immune complexes.Cells were incubated at 4°C for 15 minutes with 5 μg/mL FITC-coupled streptavidin (Sigma) and 100 μg/mL mouse MoAb anti-FITC (clone FL-D6, IgG1; Sigma). Controls were performed with FITC streptavidin alone or with FITC MoAb isotype control. In some experiments cells were first incubated for 15 minutes with 50 μg/mL of a blocking MoAb against CD32 (clone IV.3; Medarex, Annandale, NJ) followed by 15 minutes with 5 μg/mL FITC-coupled streptavidin and 100 μg/mL mouse MoAb anti-FITC.
RESULTS
The two DC subpopulations display comparable T-cell activation properties.First, we have investigated the effects of the two in vitro-generated DC populations on the induction of proliferation of allogeneic naive CD45RA+ cord blood T cells. The stimulatory potential of the two DC populations (103 stimulatory cells for 2 × 10⁴ T cells) was determined at day 6 (day of FACS), day 10, day 13, and day 16. As shown in Fig 1A, the stimulatory potential of the CD1a-derived population is detectable at day 6, peaks around day 10, and is maintained until day 16 (latest time tested). The CD14-derived population lacks stimulatory activity at day 6 but displays such a potential from day 9 to 16. Comparable stimulatory properties of the two populations are observed when syngeneic CD45RA+ cord blood T cells are cocultured in the presence of superantigens (SEA is shown in Fig 1B). At day 14, both populations are equally able to induce proliferation of CD45RA CD4+ T cells with half maximal proliferation observed with 300 to 600 DCs (Fig 1C). Also, at day 14 both DC populations are comparable in their capacity to stimulate the proliferation of CD8+ T cells. Higher numbers of stimulator cells were required (103 DCs) when compared with CD4+ T cells (Fig 1D). However, further addition of IL-2 reduced the number of stimulator cells to 300 cells (not shown).
We next analyzed whether naive T-cell activation induced by the two DC populations was involving identical molecular interactions. As shown in Fig 2A, in both cases, activation of naive T cells is blocked by 80% using MoAbs against CD86, whereas MoAbs against CD80 have no effect, as previously described, with unseparated DCs.39 Thus CD86 appears to act as the major ligand for CD28 on the two DC subsets. Furthermore, addition of exogenous IL-10 reduces by 70% to 80% the T-cell proliferation in both cases (Fig 2B), as previously described, for unseparated DCs.40
Thus, both DC populations can induce considerable naive T-cell proliferation through apparently common pathways with CD14-derived DCs displaying a delayed stimulatory potential.
CD14-derived DCs capture soluble antigen more efficiently than CD1a-derived DCs.The ability of the two populations to capture soluble antigen was analyzed during cell maturation using FITC dextran and flow cytometry38 (Figs 3 and 4A). At day 4, none of the subsets can significantly capture FITC dextran. The CD1a+ precursors show FITC-dextran uptake at day 6 with a majority of cells being moderately labeled. This capacity is downregulated at day 8 and lost at day 10 and later, even after 1 hour of exposure to FITC dextran (Fig 4C). At day 6, 12% to 35% (range of 6 experiments) of the CD14+ precursors accumulate FITC dextran and 42% to 71% of cells do so at day 8. At day 10, 94% to 100% of cells capture FITC dextran so efficiently that it can be detected after a contact as short as 3 minutes (Fig 4C). After 10 days of culture, CD14-derived DCs progressively lose their capture capacity with 12% to 35% of cells labeled at day 16. This heterogeneity in the capacity to form antigen uptake among CD14-derived DCs at day 16 suggests the coexistence of two populations, probably two stages of maturation. The capture of FITC dextran, at day 6 and day 11, appears to be a linear function of time, and CD14-derived DCs are 8 to 12 times more efficient than day 6 CD1a+ precursors (Fig 4B and C). Similar results were observed using HRP rather than FITC dextran (Fig 5E and F ). The FITC-dextran uptake is restricted to CD1a and CD14 subpopulations as CD14−CD1a− cells lack such a capacity (Fig 4B, day 6). Pulse chase experiments show that the two DC populations (day 6 for CD1a+, Fig 4D; and day 11 for CD14+, Fig 4E) retained more than 80% of the FITC dextran for several hours (up to 16 hours, not shown), showing that the captured antigen is not immediately released.
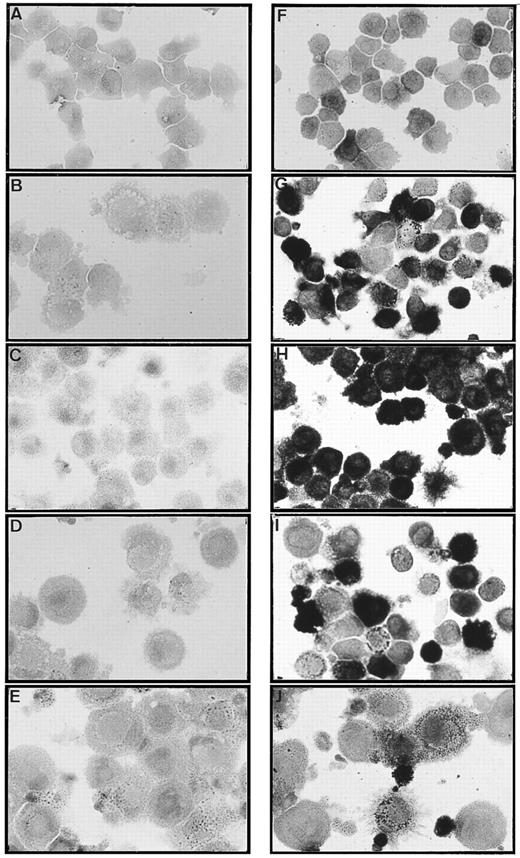
Only CD14-derived DCs display nonspecific esterase activity. The CD1a- (A, B, C, D, and E) and CD14- (F, G, H, I, and J) derived DC subsets were obtained as described in Materials and Methods and in the legend to Fig 1. Cells were processed at day 6 (A and F ), day 8 (B and G), day 10 (C and H), day 13 (D and I), and day 16 (E and J) for nonspecific esterase staining. Original magnification × 400. Results are representative of three experiments.
Only CD14-derived DCs display nonspecific esterase activity. The CD1a- (A, B, C, D, and E) and CD14- (F, G, H, I, and J) derived DC subsets were obtained as described in Materials and Methods and in the legend to Fig 1. Cells were processed at day 6 (A and F ), day 8 (B and G), day 10 (C and H), day 13 (D and I), and day 16 (E and J) for nonspecific esterase staining. Original magnification × 400. Results are representative of three experiments.
These results show that the CD1a-derived DCs display a limited antigen capture capacity that is restricted to the early stages of differentiation, whereas the CD14-derived DCs show a high antigen capture capacity that is long lasting during their maturation.
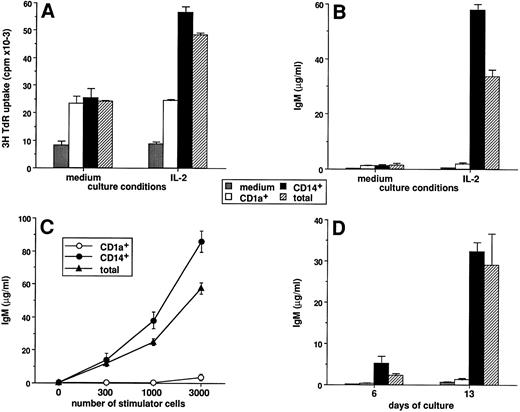
Only CD14-derived DCs can induce CD40-activated naive B cells to differentiate into IgM secreting cells. The CD1a- and CD14-derived DC subsets were obtained as described in Materials and Methods and in the legend to Fig 1. A total of 104 highly purified IgD+ B cells were cultured over 2,500 irradiated CD40-L–transfected L cells in the presence or absence of DC subsets. Proliferation was measured by 3H-TdR incorporation at day 6. Supernatants were harvested after 15 days of culture and assayed for the presence of IgM. (A) DC subsets were recovered at day 12 and used as stimulator cells (3,000 cells/well) for IgD+ B-cell proliferation in the absence or presence of 20 U/mL IL-2. (B) DC subsets were recovered at day 12 and used as stimulator cells (3,000 cells per well) for IgD+ B cell differentiation in the absence or presence of 20 U/mL IL-2. (C) DC subsets were recovered at day 12, and 300, 1,000, and 3,000 cells/well were used as stimulator cells for IgD+ B-cell differentiation in the presence of 20 U/mL IL-2. (D) DC subsets were recovered at the time point indicated and used as stimulator cells (3,000 cells/well) for IgD+ B-cell differentiation in the presence of 20 U/mL IL-2. IgM levels are expressed as mean ± SD of triplicate cultures. Results of each panel are representative of three experiments or more.
Only CD14-derived DCs can induce CD40-activated naive B cells to differentiate into IgM secreting cells. The CD1a- and CD14-derived DC subsets were obtained as described in Materials and Methods and in the legend to Fig 1. A total of 104 highly purified IgD+ B cells were cultured over 2,500 irradiated CD40-L–transfected L cells in the presence or absence of DC subsets. Proliferation was measured by 3H-TdR incorporation at day 6. Supernatants were harvested after 15 days of culture and assayed for the presence of IgM. (A) DC subsets were recovered at day 12 and used as stimulator cells (3,000 cells/well) for IgD+ B-cell proliferation in the absence or presence of 20 U/mL IL-2. (B) DC subsets were recovered at day 12 and used as stimulator cells (3,000 cells per well) for IgD+ B cell differentiation in the absence or presence of 20 U/mL IL-2. (C) DC subsets were recovered at day 12, and 300, 1,000, and 3,000 cells/well were used as stimulator cells for IgD+ B-cell differentiation in the presence of 20 U/mL IL-2. (D) DC subsets were recovered at the time point indicated and used as stimulator cells (3,000 cells/well) for IgD+ B-cell differentiation in the presence of 20 U/mL IL-2. IgM levels are expressed as mean ± SD of triplicate cultures. Results of each panel are representative of three experiments or more.
Both CD1a+ cells and CD14-derived DCs capture FITC dextran through a receptor-mediated mechanism.We next wondered whether the day-6 CD1a+ cells and the day-11 CD14-derived DCs captured antigen through either fluid phase pinocytosis or receptor-mediated endocytosis. The amount of FITC dextran (Fig 5A and B) and HRP (Fig 5E and F ) accumulated by the two DC populations showed a clear saturation at increasing doses of the marker, thus suggesting a receptor-mediated mechanism. The uptake of FITC-dextran and HRP by the two populations is completely blocked in the presence of mannan (1 mg/mL) even for high concentration of tracer (1 mg/mL). The uptake of FITC dextran is usually blocked by a twofold to threefold excess of mannan (not shown). Kinetics experiments (1 to 60 minutes) show that for both populations FITC dextran uptake is entirely blocked by an excess of mannan (1 mg/mL mannan for 0.1 mg/mL FITC dextran, shown in Fig 5C and D), even after 1 hour of exposure. Finally, an antibody against the mannose-receptor (MR), that blocks MR dependent FITC dextran capture,38 inhibits by about 80% the FITC dextran capture of the two populations (hybridoma supernatant used at 50%; Fig 6A and B). The FITC dextran capture of the day-6 CD14+ precursors follows the rules of their more mature day-11 progeny (not shown). As shown in Fig 6C and D, MR is strongly expressed on day-6 CD1a+ precursors but is lost on day-11 CD1a-derived DCs. In contrast, on CD14-derived cells, MR expression is detected at day 6 and peaks at day 11.
Thus, the uptake of FITC dextran and HRP by the two DC populations is exclusively receptor mediated and correlates with the level of MR expression.
Only CD14-derived DCs display nonspecific esterase activity.The two populations were then processed, from day 6 to day 16, for detection of nonspecific esterase (NSE) activity. As shown in Fig 7, the CD1a-derived DCs never display any significant NSE activity, whereas, in sharp contrast, the CD14-derived DCs show NSE activity. At day 6, 20% to 35% of CD14+ cells express a moderate level of NSE activity, and from day 9 to 12 the proportion of NSE expressing cells increases up to 100% (range 80 to 100; n), and the level of activity per cell increases. From day 13 to 16, the frequency of NSE expressing cells decreases (20% to 50%), and the level of activity per cell decreases as well. At day 16, the NSE activity appears to be associated with intracytoplasmic structures, possibly lysosomes.
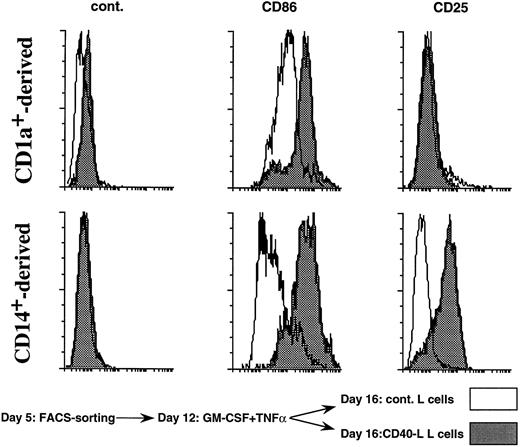
CD40 triggering upregulates CD25 specifically on CD14-derived DCs. The CD1a- (upper panels) and CD14- (lower panels) derived DC subsets were obtained as described in Materials and Methods and in the legend to Fig 1. At day 12, DC subsets were recovered and cultured over CD40-L–transfected L cells on control L cells (2 × 10⁴ LCs for 1 × 10⁵ DCs) in the presence of GM-CSF for 4 days. Then cells were processed for staining using anti-CD25–PE, anti-CD86–PE, and isotype match control. A total of 5,000 events were acquired. White histograms show phenotype over control L cells and black histograms show phenotype over CD40-L transfected L cells. Results are representative of three experiments.
CD40 triggering upregulates CD25 specifically on CD14-derived DCs. The CD1a- (upper panels) and CD14- (lower panels) derived DC subsets were obtained as described in Materials and Methods and in the legend to Fig 1. At day 12, DC subsets were recovered and cultured over CD40-L–transfected L cells on control L cells (2 × 10⁴ LCs for 1 × 10⁵ DCs) in the presence of GM-CSF for 4 days. Then cells were processed for staining using anti-CD25–PE, anti-CD86–PE, and isotype match control. A total of 5,000 events were acquired. White histograms show phenotype over control L cells and black histograms show phenotype over CD40-L transfected L cells. Results are representative of three experiments.
Thus, CD1a-derived DCs never express NSE activity, whereas CD14-derived DCs express transiently a high NSE activity that parallels their strong antigen uptake capacity.
Only CD14-derived DCs can induce CD40-activated naive B cells to differentiate into IgM secreting cells.We have previously described that in vitro generated DCs can enhance the proliferation and the differentiation of naive B cells activated through CD40.41 As shown in Fig 8A, in the absence of exogenous cytokine, both DC subsets increase naive B-cell proliferation by threefold (range 2 to 5). In contrast, the enhancing effect of IL-2, which is DC dependent, is only observed in the presence of CD14-derived DCs (fold enhancement because of IL-2; medium, 1.0; CD1a+, 1.1; CD14+, 2.2). In response to IL-2, CD40 triggering alone does not allow naive B cells to produce significant levels of IgM. In contrast, addition of DCs induces a strong IgM production (30 to 80 μg/mL, range from 6 experiments; Fig 8B). In the absence of IL-2 (Fig 8B) or CD40 triggering (data not shown) no IgM secretion is detectable. Interestingly, only CD14-derived DCs are able to induce IgM production by naive B cells, and as few as 300 CD14-derived DCs induce the production of 5 to 20 μg/mL IgM (ranges from 6 experiments) (Fig 8C). Although CD14-derived DCs can induce IgD+ B-cell differentiation as early as day 6, this activity appears optimal at day 13 (Fig 8D). At each time point tested, CD1a-derived DCs do not induce IgM synthesis by IgD+ B cell. Of note, CD3+ T cells are never detected at any time points tested.41
Although the two DC populations are sensitive to CD40 engagement as shown by CD86 upregulation, CD25 expression is upregulated only on CD14-derived DCs (Fig 9). This result indicates that the IL-2–dependent effect of CD14-derived DCs on naive B-cell differentiation might be linked to their unique capacity to express CD25 on activation.
Those experiments show that the ability of DCs to induce naive B-cell differentiation into IgM secreting cells is restricted to the CD14-derived DCs. The unique capacity of CD14-derived DCs to express CD25 on activation suggests a role of IL-2 on DC functions.
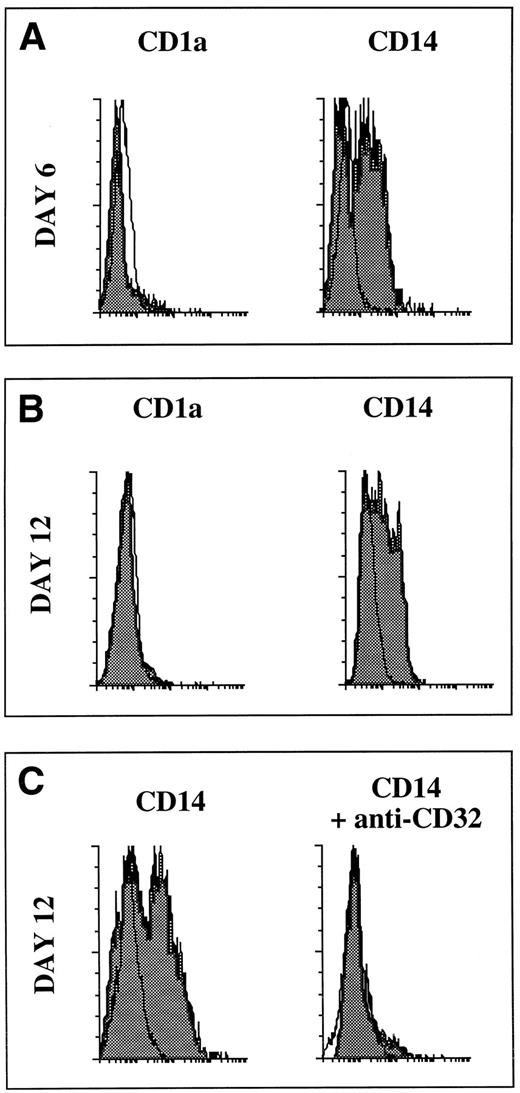
Only CD14-derived DCs bind immune complexes.We then wondered whether both DC populations were able to bind immune complexes. To address this issue, a complex of FITC-coupled streptavidin and mouse IgG1 MoAb anti-FITC was used. Both at days 6 and 12, CD14+ cells but not CD1a+ cells bind this complex (Fig 10A). Similar results were obtained with a complex of FITC-coupled streptavidin and goat polyclonal antistreptavidin (not shown). No staining was detected using (1) FITC-coupled streptavidin alone, (2) FITC-coupled isotype controls, and (3) a complex of FITC-coupled streptavidin and rat MoAb anti-FITC of IgM isotype (not shown). Furthermore, a blocking MoAb against CD32 abrogated the binding of the complex (Fig 10B).
Only the CD14-derived DCs bind immune complexes. The CD1a- and CD14-derived DC subsets were obtained as described in Materials and Methods and in the legend to Fig 1. At days 6 and 12, DC subsets were recovered and were incubated at 4°C for 15 minutes with 5 μg/mL FITC-coupled streptavidin and 100 μg/mL mouse IgG1 MoAb anti-FITC. (A) Day 6, (B) day 12, and (C) day-12 CD14-derived cells were first incubated for 15 minutes with 50 μg/mL of a blocking MoAb against CD32 followed by 15 minutes with 5 μg/mL FITC-coupled streptavidin and 100 μg/mL mouse IgG1 MoAb anti-FITC. White histograms show FITC streptavidin alone. FITC-coupled isotype match controls were superposable to the white histograms.
Only the CD14-derived DCs bind immune complexes. The CD1a- and CD14-derived DC subsets were obtained as described in Materials and Methods and in the legend to Fig 1. At days 6 and 12, DC subsets were recovered and were incubated at 4°C for 15 minutes with 5 μg/mL FITC-coupled streptavidin and 100 μg/mL mouse IgG1 MoAb anti-FITC. (A) Day 6, (B) day 12, and (C) day-12 CD14-derived cells were first incubated for 15 minutes with 50 μg/mL of a blocking MoAb against CD32 followed by 15 minutes with 5 μg/mL FITC-coupled streptavidin and 100 μg/mL mouse IgG1 MoAb anti-FITC. White histograms show FITC streptavidin alone. FITC-coupled isotype match controls were superposable to the white histograms.
Thus, CD14+ precursors and their progeny bind immune complexes through CD32 whereas CD1a do not, in line with their low CD32 expression.30
DISCUSSION
Recently, we showed the existence of two independent pathways of DC development yielding to (1) an epithelial DC related to LCs and (2) a monocyte-derived DC potentially related to interstitial DCs and/or peripheral blood DCs.30 In the present study, we have investigated the potential physiological relevance of these two populations through the study of their specific biological functions. Although both populations were equally potent in stimulating naive T cells through apparently identical mechanisms, each displayed the other's unique properties. In particular, CD14-derived DCs show a potent antigen uptake activity that is, at its peak, about 10-fold more efficient than that of CD1a+ precursors. In addition, antigen uptake capacity of CD14-derived DCs was long lasting (from day 8 to day 14), whereas the weak activity of CD1a+ cells was restricted to the immature stage (day 6). Modulation of uptake capacity during maturation correlates with the expression of the mannose-receptor, which is expressed at high levels on day-6 CD1a+ precursors and on day-11 CD14-derived DCs. In both DC subsets, the capture of FITC dextran and HRP is exclusively mediated through receptor for mannose polymers. It remains to be determined whether receptor-mediated endocytosis involving coated pits or macropinocytosis38 are used by these distinct DC subsets. An alternative pathway allowing antigen uptake is mediated through binding of immune complexes to CD32, a capacity restricted to CD14+ precursors and their progeny. Antigen uptake through either mannose receptors (mannosilated antigen) or through CD32 (immune complexes) allow efficient presentation to CD4+ T cells,44 suggesting that CD14+ cells might be more efficient than CD1a+ cells in presenting these forms of antigen.
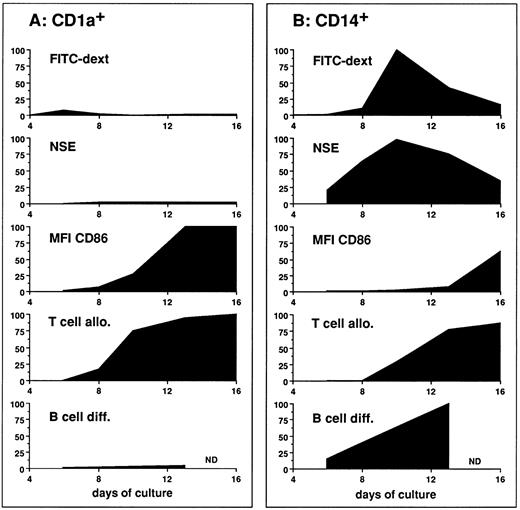
The high antigen capture efficiency of CD14-derived DCs correlated with their high NSE activity, which is a tracer of lysosomial compartment characterizing scavengers. These properties, which are linked to antigen capture and degradation, precede, despite some overlaps (day 13), the upregulation of accessory molecules such as CD86 and the capacity to activate naive T cells (Fig 11), which is in accordance with the accepted scheme of DC maturation.1,45 It has to be noticed that the capacity to stimulate naive T cells, which is CD86 dependent, precedes the upregulation of CD86 expression, suggesting CD86 induction during interaction with T cells, potentially through CD40 engagement.39
Evolution of functions during DC subpopulation maturation. The figure represents parameters of DC activities as a function of time. MFI of CD86 illustrates the progression of DC maturation. FITC dextran illustrates the capacity of antigen uptake. NSE illustrates the lysosomal activity. T-cell alloreaction illustrates the capacity to activate naive T cells. B-cell differentiation illustrates the capacity to induce naive B-cell differentiation in response to IL-2. To plot the different parameters on a same scale, values were calculated as the following ratio: (experimental value/maximal value) × 100; the maximal value being the maximal value obtained with either CD1a or CD14 populations. (A) The evolution of the CD1a-derived cells activities. (B) The evolution of the CD14-derived cells activities.
Evolution of functions during DC subpopulation maturation. The figure represents parameters of DC activities as a function of time. MFI of CD86 illustrates the progression of DC maturation. FITC dextran illustrates the capacity of antigen uptake. NSE illustrates the lysosomal activity. T-cell alloreaction illustrates the capacity to activate naive T cells. B-cell differentiation illustrates the capacity to induce naive B-cell differentiation in response to IL-2. To plot the different parameters on a same scale, values were calculated as the following ratio: (experimental value/maximal value) × 100; the maximal value being the maximal value obtained with either CD1a or CD14 populations. (A) The evolution of the CD1a-derived cells activities. (B) The evolution of the CD14-derived cells activities.
The most striking difference between the two DC populations is the unique capacity of CD14-derived DCs to induce naive B cells to differentiate into IgM secreting cells, in response to CD40 triggering and IL-2. Such a property suggests an involvement of CD14-derived DCs in the regulation of humoral responses. This regulation might occur during the initiation of primary B-cell responses, which would be consistent with in vivo studies showing that, after immunization, CD40L+ IL-2–producing CD4+ T cells are colocalized with antibody-specific secreting B cells in the extrafollicular areas of secondary lymphoid organs.46-48 In keeping with this, in vitro studies have shown IL-2 to be an important factor of primary humoral responses.49-51 However, the recent localization of typical DCs of myeloid origin within human tonsil germinal centers20 suggests an alternative interpretation. CD14-derived DCs could be related to germinal center DCs and, thus, might participate in the regulation of germinal center reaction. In this context, it is interesting that these DCs display immune complexes like CD14-derived DCs. This immune complex binding capacity might be related to native antigen carriage into the B-cell follicule.
The present studies lead us to propose that epithelial DCs (CD1a-derived LCs) migrate after antigen capture through the lymph stream to the T-cell–rich area of regional lymph nodes where they induce a primary T-cell immunization but no primary B-cell responses. This hypothesis, which suggests a preferential role of LCs in the cellular-type immune responses, is supported by the involvement of LCs in delayed-type hypersensitivity reactions observed after hapten application on the epidermis.4,6 52 In contrast, CD14-derived DCs related to monocyte-derived DCs, potentially located into tissues such as dermis or blood, might, after antigen capture, migrate through the blood (or lymph) stream into either the T-cell–rich area and/or the B-cell follicules where they could be involved in the regulation of primary B-cell responses.
The present study together with our initial one1 show the existence of two independent pathways for the development of DCs with discrete biological functions. This heterogeneity of DCs requires further understanding, particularly in view of the development of strategies aimed at using DCs as therapeutic entities to elicit immune responses specific for infectious agents as well as cancer.53 54
ACKNOWLEDGMENT
We are grateful to E. Garcia for FACS sorting; N. Courbière, S. Bonnet-Arnaud, and M. Vatan for editorial assistance; Doctors and colleagues from clinics and hospitals in Lyon who provide us with umbilical cord blood samples; and Dr J. Chiller for support and for discussions.
B.D. is a recipient of a grant from Fondation Marcel Mérieux, Lyon, France. Preliminary results were presented at the Keystone Meeting on Dendritic Cells, held in Taos, New Mexico, March 1995 and at the Fourth International Symposium on Dendritic Cells, held in Venice, Italy, October 1996.
Address reprint requests to Christophe Caux, PhD, Schering-Plough, 27 chemin de Peupliers, BP 11, 69571, Dardilly, France.

This feature is available to Subscribers Only
Sign In or Create an Account Close Modal