Abstract
Hemoglobin Constant Spring (HbCS) is the most common nondeletional α-thalassemic mutation and is an important cause of HbH-like disease in Southeast Asia. HbCS variants have an almost normal mean cell volume (MCV) and the anemia is more severe when compared with other α-thalassemic variants. We explored the pathobiology of HbCS red blood cells (RBCs) because the underlying cause(s) of this MCV “normalizing” effect of HbCS and the more severe anemia are not fully explained. HbCS containing RBCs are distinctly overhydrated relative to deletional α-thalassemia variants, and the derangement of volume regulation and cell hydration occurs early in erythroid maturation and is fully expressed at the reticulocyte stage. Furthermore, the membrane rigidity and membrane mechanical stability of HbCS containing RBCs is increased when compared with HbH and α-thalassemia-1 trait RBCs. In seeking the cause(s) underlying these cellular alterations we analyzed membranes from HbCS and deletional α-thalassemic variants and found that in addition to oxidized β-globin chains, oxidized αcs-globin chains are also associated with the membranes and their skeletons in HbCS containing RBCs. We propose that the membrane pathology of HbCS variants is caused by combination of the deleterious effects induced by membrane-bound oxidized αcs- and β-globin chains. The membrane alterations induced by αcs chains are more akin to those induced by βA-globin chains than those induced by the αA-globin chains that accumulate in the β-thalassemias. Thus, each globin chain, αcs, αA, βA, appears to produce its own form of membrane perturbation.
THE HUMAN thalassemias have proved to be very useful models to study the different cellular and membrane consequences of accumulation of excess unmatched α- or β-globin chains. Highly specific effects of excess α- or β-globin chains on ineffective erythropoiesis, hemolysis, targeted oxidant attack, state of cell hydration, membrane mechanical stability, and deformability have been documented.1-3 Red blood cell (RBC) membranes in β-thalassemia intermedia are more mechanically unstable possibly due to oxidation of protein 4.1, whereas in hemoglobin H (HbH) disease the membranes are hyperstable and there is no evidence of oxidation or dysfunction of protein 4.1.2-5 Ineffective erythropoiesis appears to be primarily responsible for anemia in severe β-thalassemia intermedia, while peripheral RBC destruction appears to account for anemia in severe α-thalassemia (HbH).6,7 Furthermore, the state of RBC dehydration is also different in α- and β-thalassemia. Accumulation of excess α-globin chains in β-thalassemia leads to cellular dehydration whereas accumulation of β-globin chains in severe α-thalassemia results in increased hydration of RBCs.2,8-10 It is likely that these differential alterations in cellular hydration are the result of the differing effect of specific oxidized globin chains on the K:Cl cotransporter and possibly other transport pathways.11 Thus, our attention was drawn to variants of Hb Constant Spring (CS), a nondeletional α-thalassemic mutation that is very common in Southeast Asia.8-10,12-14 HbCS is caused by a mutation in the stop codon of the α2 -globin gene that results in poor output (1% of normal) of an α-globin which has 31 additional amino acids,13,14 and when inherited along with α-thalassemia-1, produces a variant of HbH disease which is generally characterized by a more severe anemia and by an almost normal mean corpuscular volume (MCV) caused by increased cell hydration.15,16 This paradoxical event is reinforced by the finding that HbCS homozygosity, which should produce an asymptomatic or very mild clinical picture like α-thalassemia trait, due to the persistence of two fully functional α-globin genes, instead produces a disease with hemolysis, mild anemia, jaundice, and splenomegaly.15 These observations suggest that accumulation of αcs could have deleterious effects on RBCs leading to more severe hemolysis.
To understand the cellular events that may contribute to these differences in HbCS disease severity and state of hydration, we performed a series of biophysical and biochemical analyses on erythrocytes obtained from patients with severe HbH disease, HbH/CS, HbCS/CS, HbCS trait, and α-thalassemia-1 trait. We discovered that the membrane pathology of HbCS variants, which includes increased membrane rigidity, increased membrane mechanical stability, and altered cell hydration, is the result of perturbations induced by association of oxidized αcs with the membrane.
MATERIALS AND METHODS
Samples of venous blood were obtained from individuals with HbH, HbH/CS, HbCS/CS, α-thalassemia-1 trait, and HbCS trait and normal controls under protocols approved by the Thalassemia Center, Siriraj Hospital and the Department of Pathology, Ramathibodi Hospital, Bangkok, Thailand. The diagnoses were based on globin gene analysis.10 None of the patients had received a blood transfusion for at least 3 months before blood collection. The subjects were adults, ages 20 to 40 years, with equal numbers of each gender. Very few of these patients had undergone splenectomy. The samples were drawn into EDTA or citrate-phosphate-dextrose (CPD) and shipped on ice to California. Each shipment was accompanied by blood drawn from at least one control subject in exactly the same manner and under exactly the same conditions. Analysis of RBC indices were done at the Ramathibodi Hospital, measurement of membrane deformability and stability were performed at the Lawrence Berkeley National Laboratory, and all other analyses were performed at Stanford University.
Determination of RBC volume, Hb content, and Hb concentration.The Bayer H*3 automated hematology analyzer (Diagnostics, Tarrytown, NY) provides a cell-by-cell measurement of volume, Hb concentration, and Hb content of individual RBCs and displays these data in graphic form. Statistical analyses were performed using analysis of variance (ANOVA) and post-hoc analysis by Fisher's PLSD. From these histograms the proportion of RBCs outside specified normal limits can also be determined.17 Furthermore, reticulocytes are identified using an RNA-specific dye17 18 and their indices are independently measured and displayed. By comparing histograms of these parameters of RBCs and reticulocytes, one can determine if reticulocytes freshly delivered from the bone marrow already show abnormalities of volume, Hb concentration (cell hydration), or Hb content or whether these changes occur relatively slowly during the life span of RBCs in the peripheral circulation.
Membrane mechanical stability and deformability measurements.Resealed membranes were prepared for mechanical stability and deformability measurements as previously described.2 The erythrocytes were washed three times in 5 mmol/L Tris, 140 mmol/L NaCl (pH 7.4), and then lysed in 40 vol of 7 mmol/L NaCl and 5 mmol/L Tris (pH 7.4). The membranes were then pelleted by centrifugation, resuspended in 10 vol of 5 mmol/L Tris and 140 mmol/L NaCl (pH 7.4), and incubated for 30 minutes at 37°C for resealing.
For mechanical stability measurements, the resealed membranes were pelleted by centrifugation and 100 μL of a 40% membrane suspension was mixed with 3 mL dextran (40,000 molecular weight, 35 g/100 mL in 10 mmol/L phosphate buffer, pH 7.4, viscosity 95 cp) and subjected continuously to 750 dynes/cm2 in the ektacytometer. Under this stress, the membranes progressively fragment, generating undeformable spheres. This process is detected as a time-dependent decrease in the Deformability Index (DI). The time required for the DI to decrease to 60% of its maximum value is termed T60 and is taken as a measure of membrane mechanical stability.2
For deformability measurements, resealed membranes, prepared as described above, were suspended in 3 mL of Stractan (Arabinogalactan, St Regis Paper Co, Tacoma, WA) (290 mOsm, 22 cp, pH 7.4) and exposed to gradually increasing shear stress (0 to 125 dynes/cm2 ) in the ektacytometer. For resealed membranes, the shear stress required to obtain a defined value of DI is determined by the property of membrane deformability without contributions from either internal viscosity or cell geometry. Analysis of the DI curve generated by the ektacytometer provides a measure of membrane deformability.2 These studies were performed on 4 patients with α-thalassemia-1 trait, 3 with HbCS trait, 2 with homozygous Hb CS/CS, 4 with HbH, and 3 with HbH/CS.
Analysis of ghosts and membrane skeletons.RBCs were washed extensively and then pretreated with proteolysis inhibitors diisopropyl fluro-phosphate (DFP; Sigma, St Louis, MO) (2 mmol/L), pepstatin A (10 mg/mL), and leupeptin (10 mg/mL) for 30 minutes at 37°C. Ghosts were then prepared by lysing 1 vol of packed erythrocytes with 40 vol of lysing buffer consisting of 5 mmol/L phosphate buffer (pH 8.0) containing 0.5 mmol/L DFP. The membranes were then pelleted by cetrifugation and washed three times with the lysing buffer.2,3,19 Membrane skeletons were prepared from the washed ghosts by Triton extraction exactly as previously described.2,3 19
Ghosts and skeletons were analyzed by sodium dodecyl sulfate-polyacrylamide gel electrophoresis (SDS-PAGE) using concave 6% to 18% PAGE gradients in the Laemmli separation system as previously described.2,3 Gels were stained with Coomassie Brilliant Blue and then destained. Bands were identified and quantified, as required, by densitometry using the LKB ultrascan XL Laser Densitometer. (Pharmacia LKB Biotechnology AB, Bromma, Sweden). To confirm the identity of the globin bands in the 15- to 20-kD region of the gel as either α- or β-globin we performed Western blotting using specific monoclonal antibodies (MoAbs).3 The MoAbs to human α- and β-globin chain were developed by Dr L. Michael Snyder and Dr C.R. Keifer of the University of Massachusetts. The reactions were revealed by a peroxidase-conjugated rabbit anti-mouse Ig obtained from Dako Corp (Carpenteria, CA). The substrate for the horseradish peroxidase was 4-chloro-1-naphthol (Sigma Chemical Co).
Thiol-disulfide exchange chromatography was performed to identify proteins that had undergone intramolecular sulfhydryl loss as previously described.3 These measurements enabled us to identify those specific proteins that had been oxidatively damaged.3 In performing these studies we analyzed 11 normal shipment controls, 3 α-thalassemia-1 trait, 5 HbCS trait, 9 homozygous HbCS/CS, 8 HbH, and 10 HbH/CS.
RESULTS
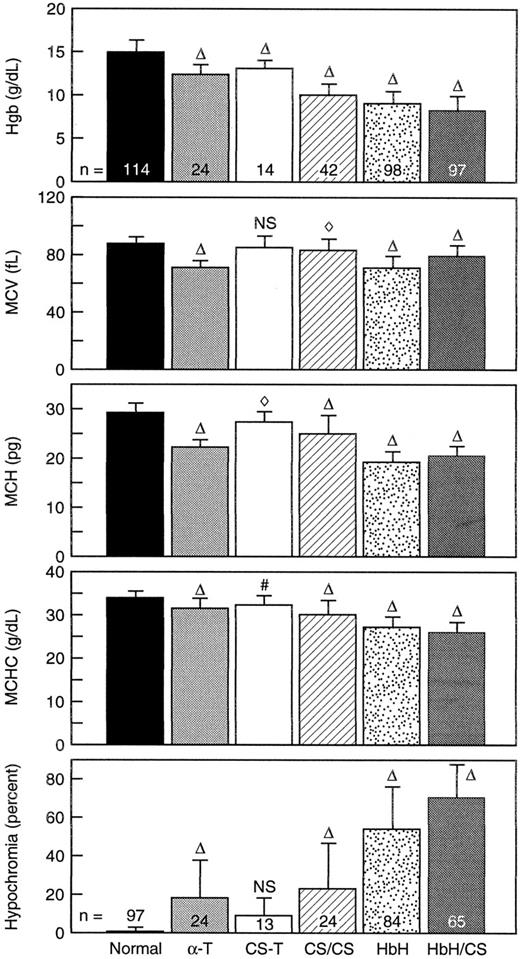
RBC parameters.The Hb values, RBC indices, and proportions of hypochromic RBCs in the different variants of α-thalassemia and HbCS are summarized in Fig 1. The degree of anemia as reflected by Hb levels ranged from being very mild in individuals with HbCS trait to being quite severe in individuals with HbH/CS. In general, the extent of decrease in Hb values was as follows: HbH/CS > HbH > HbCS/CS > α-thalassemia-1 trait > HbCS trait. As expected, the mean cell Hb content of RBCs in these variants was decreased. The smallest decrease in Hb content was noted in HbCS trait while the largest decrease was found in HbH and HbH/CS. RBCs in α-thalassemia-1 trait and Hb CS/CS exhibited intermediate decrease in Hb content. The largest decrease in cell volume was seen in α-thalassemia-1 trait and in HbH and the extent of decrease in cell volume was roughly proportional to the decrease in Hb content. Thus, the mean cell Hb concentration of α-thalassemia-1 trait RBC was only slightly decreased compared with that of normal RBCs. In contrast, RBCs in HbH and HbH/CS had larger cell volumes in relation to their Hb content, resulting in marked reduction in the mean cell Hb concentration. RBCs in Hb CS/CS also showed considerable decrease in mean cell Hb concentration. The discordance between cell volume and cell Hb content in these variant RBCs is best illustrated by quantitating the numbers of hypochromic RBCs (Fig 1, bottom panel). Although less than 1% of normal RBCs are hypochromic (Hb concentration values <28 g/dL), approximately 70% of RBCs in HbH/CS are hypochromic. The percentage of hypochromic RBCs proceeded in the following order: HbH/CS > HbH > HbCS/CS > α-thalassemia-1 trait > HbCS trait. The difference between α-thalassemia-1 trait and HbCS trait was not significant. These results imply that RBCs in these different variants are unable to regulate their volume in accordance with their Hb content, thereby leading to increased hydration. These results further suggest that αcs may have distinct effects on RBC volume regulation.
An analysis of patients with variant forms of α-thalassemia from Bangkok, Thailand. The top panel shows the Hb concentration. The subsequent four panels are parameters derived from the H*3 Bayer Hematology Analyzer indicating the mean cell volume (MCV), the mean cell Hb content (MCH), and the mean cell Hb concentration (MCHC), while the bottom panel indicates the percent of cells that are hypochromic (percent of RBC where the MCHC is less than 28 g/dL). The error bars indicate 1 standard deviation about the mean. Abbreviations: α-T, α-thalassemia-1 trait; CS-T, heterozygous HbCS; CS/CS, homozygous CS; HbH, α-thalassemia-1 trait/α-thalassemia-2 trait; HbH/CS, α thalassemia-1 trait/αCSα. The symbols indicate P values showing significant differences from the normal. The following symbols indicate the respective P values: NS, not significant; #, < .01; ⋄, < .0005; ▵, < .0001. The number of analyses done for the top four panels are indicated within the bars in the top panel. The number of analyses done to determine the extent of hypochromia (bottom panel) are indicated within or on the bars in that panel.
An analysis of patients with variant forms of α-thalassemia from Bangkok, Thailand. The top panel shows the Hb concentration. The subsequent four panels are parameters derived from the H*3 Bayer Hematology Analyzer indicating the mean cell volume (MCV), the mean cell Hb content (MCH), and the mean cell Hb concentration (MCHC), while the bottom panel indicates the percent of cells that are hypochromic (percent of RBC where the MCHC is less than 28 g/dL). The error bars indicate 1 standard deviation about the mean. Abbreviations: α-T, α-thalassemia-1 trait; CS-T, heterozygous HbCS; CS/CS, homozygous CS; HbH, α-thalassemia-1 trait/α-thalassemia-2 trait; HbH/CS, α thalassemia-1 trait/αCSα. The symbols indicate P values showing significant differences from the normal. The following symbols indicate the respective P values: NS, not significant; #, < .01; ⋄, < .0005; ▵, < .0001. The number of analyses done for the top four panels are indicated within the bars in the top panel. The number of analyses done to determine the extent of hypochromia (bottom panel) are indicated within or on the bars in that panel.
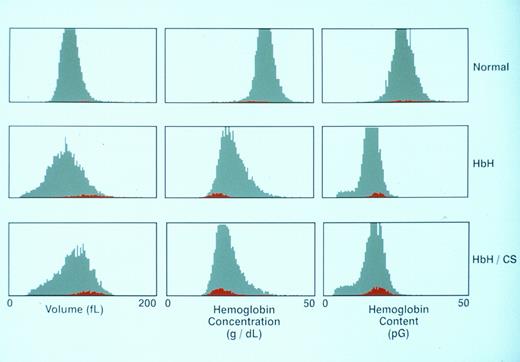
Reticulocyte parameters.The volume, Hb concentration, and Hb content histograms of RBCs and reticulocytes in representative normals, HbH, and HbH/CS blood samples are shown in Fig 2 and values for all the variants studied are shown in Table 1. A distinguishing feature of these histograms is that reticulocytes in both HbH and HbH/CS exhibit increased volume and decreased cell Hb concentration compared with their mature RBC counterparts, a feature that is also characteristic of reticulocytes in normal blood. Thus, the disproportionate increase in cell volume relative to its Hb content is a feature that is expressed even at the reticulocyte stage in these variant RBCs. From these data we can conclude that the deranged volume regulation of RBCs responsible for their increased hydration occurs early in their evolution. The finding that these reticulocytes enter the circulation from the bone marrow already overhydrated and once in circulation are not able to regulate their volume in relation to their Hb content implies that the transport mechanisms responsible for volume regulation of these RBCs has been irreversibly damaged.
Parameters for the RBCs and reticulocytes from a normal patient, a patient with classical HbH, and a patient with classical HbH/CS. The distribution curves for the entire RBC population are shown in gray, whereas the reticulocyte population is displayed in red.
Parameters for the RBCs and reticulocytes from a normal patient, a patient with classical HbH, and a patient with classical HbH/CS. The distribution curves for the entire RBC population are shown in gray, whereas the reticulocyte population is displayed in red.
Comparison of Values in Reticulocytes and RBCs
| . | . | RBCs (mean ± SD) . | Reticulocyte (mean ± SD) . | Ratio: Reticulocytes/RBCs (mean ± SD) . |
|---|---|---|---|---|
| MCV | Normal (10) | 89.27 ± 3.89 | 113.98 ± 4.97 | 1.28 ± 0.04 |
| α-T (7) | 75.49 ± 4.53 | 102.00 ± 4.96 | 1.35 ± 0.08 | |
| CS-T (8) | 85.38 ± 4.12 | 106.38 ± 4.81 | 1.25 ± 0.03 | |
| CS/CS (6) | 82.05 ± 3.72 | 98.68 ± 5.45 | 1.20 ± 0.06 | |
| HbH (30) | 74.79 ± 7.81 | 104.89 ± 8.00 | 1.41 ± 0.10 | |
| HbH/CS (19) | 85.74 ± 5.65 | 107.48 ± 5.81 | 1.26 ± 0.06 | |
| MCHC | Normal | 31.27 ± 0.82 | 25.65 ± 1.13 | 0.82 ± 0.03 |
| α-T | 28.03 ± 0.63 | 22.63 ± 1.35 | 0.81 ± 0.04 | |
| CS-T | 29.81 ± 0.64 | 25.09 ± 0.64 | 0.84 ± 0.01 | |
| CS/CS | 29.03 ± 1.21 | 25.53 ± 2.01 | 0.88 ± 0.04 | |
| HbH | 23.94 ± 1.29 | 19.15 ± 0.86 | 0.80 ± 0.04 | |
| HbH/CS | 22.46 ± 1.22 | 20.02 ± 1.12 | 0.89 ± 0.03 | |
| MCH | Normal | 27.22 ± 1.66 | 28.20 ± 1.53 | 1.04 ± 0.02 |
| α-T | 20.51 ± 1.59 | 22.27 ± 1.77 | 1.09 ± 0.05 | |
| CS-T | 24.74 ± 1.18 | 25.96 ± 1.12 | 1.05 ± 0.01 | |
| CS/CS | 23.03 ± 1.60 | 24.32 ± 1.05 | 1.06 ± 0.03 | |
| HbH | 16.85 ± 1.28 | 19.31 ± 1.00 | 1.15 ± 0.05 | |
| HbH/CS | 18.27 ± 1.12 | 20.58 ± 1.06 | 1.13 ± 0.04 |
The number in parentheses in the top panel indicates the number of patient samples analyzed.
The Hb content histograms in HbH and HbH/CS also exhibited an interesting feature. In normal blood, the Hb content of reticulocytes and RBCs is very similar and the distributions are symmetric.17 In contrast, while reticulocyte Hb content histograms in both HbH and HbH/CS are symmetric, the RBC histograms are markedly asymmetric with a characteristic tail extending to low values of Hb content (Fig 2). This finding implies that during their circulatory life span, but not during reticulocyte maturation, some RBCs underwent fragmentation resulting in generation of mature cells with decreased Hb content. This fragmentation may be relatively greater in α-thalassemia-1 trait and in HbH because these variants showed the greatest reduction in MCV from the reticulocyte stage to mature RBC (Table 1, MCV ratios, respectively, of 1.35 P < .05 and 1.41 P < .0001 when compared with the normal).
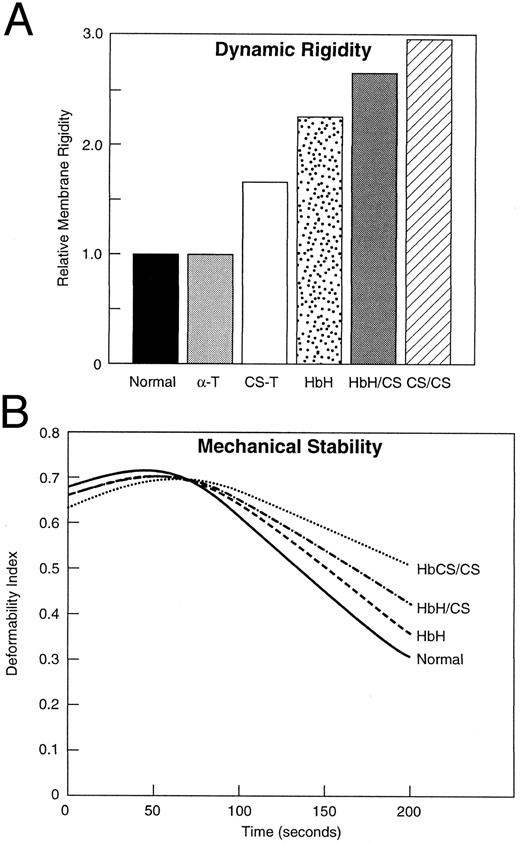
Membrane material properties.Mechanical stability and dynamic rigidity of resealed membranes prepared from these variant α-thalassemic RBCs was measured by ektacytometry and the data are shown in Fig 3. Membrane dynamic rigidity was increased for the variant RBCs with membranes of HbCS/CS RBCs exhibiting the highest increase in rigidity (Fig 3A). CS trait RBCs, HbH, and HbH/CS RBCs exhibited intermediate increases in membrane rigidity, whereas membranes of α-thalassemia-1 trait RBCs exhibited no increase in rigidity (Fig 3). In addition to increased membrane rigidity, these variant RBCs also exhibited increased membrane mechanical stability (Fig 3B). The greatest increase in mechanical stability was noted for membranes of HbCS/CS RBCs, whereas membranes of HbH/CS and HbH RBCs exhibited intermediate increases in membrane mechanical stability. The membrane mechanical stability of CS trait RBCs and α-thalassemia-1 trait RBCs was similar of that of normal RBCs (data not shown). These findings suggest that αcs-chain interaction with the membrane can induce changes in material properties that mimic the membrane changes induced by excess β-globin chains interacting with the membrane in HbH RBCs.2
Relative membrane rigidity and membrane mechanical stability of variant α-thalassemia RBCs. HbCS/CS RBCs exhibited the greatest increase in membrane rigidity while HbH/CS, HbH, and CS trait RBCs exhibited intermediate increases in membrane rigidity (A). The α-thalassemia-1 trait RBC membranes exhibited normal membrane rigidity (A). Representative membrane mechanical stability data for the variant RBCs are shown (B). The rate of decline of deformability index of membranes from HbCS/CS was the slowest, indicating that these membranes exhibit the greatest increase in membrane mechanical stability. The rate of decline of deformability index of membranes of HbH/CS and HbH RBCs was intermediate between that of HbCS/CS and normal membranes, indicating somewhat less of an increase in membrane mechanical stability. The abbreviations are the same as those in Fig 1.
Relative membrane rigidity and membrane mechanical stability of variant α-thalassemia RBCs. HbCS/CS RBCs exhibited the greatest increase in membrane rigidity while HbH/CS, HbH, and CS trait RBCs exhibited intermediate increases in membrane rigidity (A). The α-thalassemia-1 trait RBC membranes exhibited normal membrane rigidity (A). Representative membrane mechanical stability data for the variant RBCs are shown (B). The rate of decline of deformability index of membranes from HbCS/CS was the slowest, indicating that these membranes exhibit the greatest increase in membrane mechanical stability. The rate of decline of deformability index of membranes of HbH/CS and HbH RBCs was intermediate between that of HbCS/CS and normal membranes, indicating somewhat less of an increase in membrane mechanical stability. The abbreviations are the same as those in Fig 1.
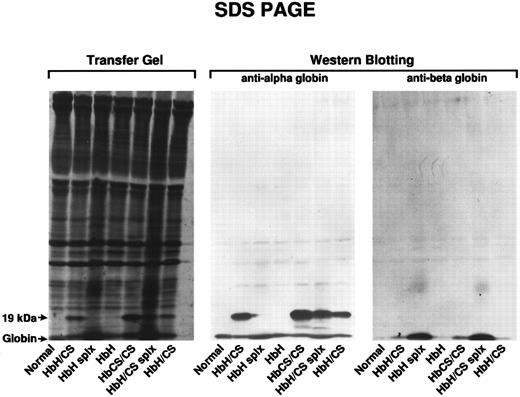
Analysis of membrane and skeletal protein components.To determine the nature of the globin chains interacting with membranes in these variant RBCs, we performed SDS-PAGE analysis of ghosts from patients with HbH disease, HbH/CS, and Hb CS/CS and the data are shown in Fig 4 (left panel). The HbCS trait was omitted from this analysis because the band was too faint to be seen regularly. In all of the ghost membranes from patients with HbCS, a polypeptide species migrating with a molecular weight of 19 kD was detected. As αcs with its additional 31 amino acids has a molecular weight of approximately 19 kD, these data suggest that this polypeptide is likely to be membrane-associated αcs. To unequivocally document that this polypeptide is indeed αcs, Western blotting of these proteins was performed using MoAbs to human α- and β-globin chains, and the data are shown in Fig 4. The 19-kD polypeptide species reacted with the α-globin MoAb but not with β-globin antibody, confirming the identity of the membrane-associated polypeptide as αcs. As we have previously shown, only β-globin chains were found in association with HbH membranes (Fig 4). Interestingly, the amount of membrane-bound globin was substantially increased in two splenectomized patients, one with the HbH genotype and the other with HbH/CS genotype, compared to membranes from their nonsplenectomized counterparts. Using laser densitometry we were able to measure the ratio of spectrin to αcs in two patients with HbH/CS and one patient with Hb CS/CS. Using relatively standard assumptions regarding membrane protein content,20 we were able to calculate that there were 0.16 and 0.25 mg of membrane associated αcs per 1010 RBCs in HbH/CS and 0.4 mg of αcs per 1010 RBCs in the patient with HbCS/CS. Assuming that the cytosolic HbCS content is about 2% in HbH/CS and about 4% in Hb CS/CS,14 15 then about 7% of αcs is membrane bound in each case.
The left panel (Transfer Gel) identifies the SDS-PAGE analysis of solubilized membranes of normal controls, patients with HbH, HbH/CS, and patients with homozygous HbCS/CS. Splenectomized patients are indicated by splx. The globin band, running at approximately 15 kD, appears at the bottommost portion of the gel. The arrow indicates bands seen only in HbCS variants that run at a position consistent with 19 kD molecular weight. Western blotting of similar patients is shown on the two righthand panels with a monoclonal anti–α-globin in the center and anti–β-globin MoAb on the right. The anti–β-globin antibody shows accumulations of β-globin in HbH and HbH/CS, but the largest accumulations occurred in splenectomized patients with HbH and HbH/CS. Of importance is the fact that the anti–α-globin antibody reacted specifically with the 19-kD band.
The left panel (Transfer Gel) identifies the SDS-PAGE analysis of solubilized membranes of normal controls, patients with HbH, HbH/CS, and patients with homozygous HbCS/CS. Splenectomized patients are indicated by splx. The globin band, running at approximately 15 kD, appears at the bottommost portion of the gel. The arrow indicates bands seen only in HbCS variants that run at a position consistent with 19 kD molecular weight. Western blotting of similar patients is shown on the two righthand panels with a monoclonal anti–α-globin in the center and anti–β-globin MoAb on the right. The anti–β-globin antibody shows accumulations of β-globin in HbH and HbH/CS, but the largest accumulations occurred in splenectomized patients with HbH and HbH/CS. Of importance is the fact that the anti–α-globin antibody reacted specifically with the 19-kD band.
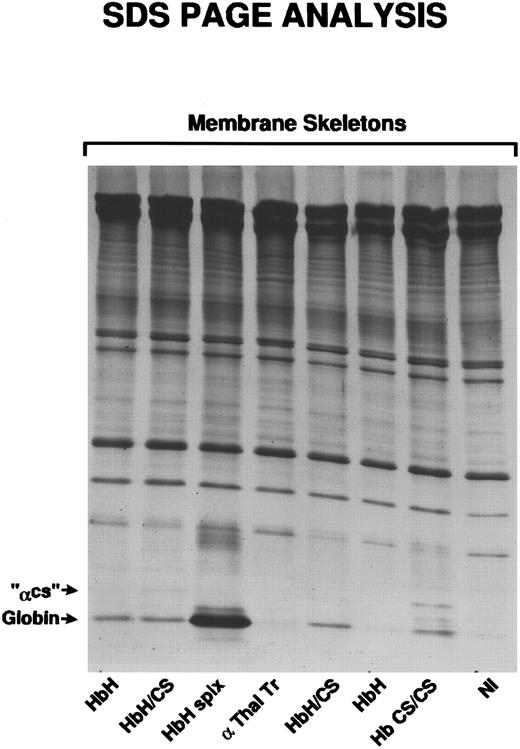
We had previously shown that much of the membrane-bound α-globin in severe β-thalassemia and β-globin in α-thalassemia is associated with membrane skeletons.3 19 To determine if membrane-associated αcs chains are also associated with membrane skeletons, Triton-extracted membranes prepared from αcs variant RBCs were analyzed by SDS-PAGE. The 19-kD polypeptide corresponding to the molecular weight of αcs was indeed found to be associated with membrane skeletons in all HbCS variant RBCs (Fig 5) except HbCS-T, where the amounts were too small to be seen regularly. We then determined by laser densitometry the ratio of spectrin to αcs in ghosts and skeletons in a patient with Hb CS/CS and found that 55% of membrane-bound αcs remained with the skeleton fraction.
Membrane skeletons, prepared as described, were subjected to SDS-PAGE analysis. Characteristic of membrane skeletons is the prominence of α- and β-spectrin, band 4.1, and actin. Relatively faint bands identified as αCS, because of their position at 19 kD, are seen only in the two patients with HbH/CS and the patient with HbCS/CS.
Membrane skeletons, prepared as described, were subjected to SDS-PAGE analysis. Characteristic of membrane skeletons is the prominence of α- and β-spectrin, band 4.1, and actin. Relatively faint bands identified as αCS, because of their position at 19 kD, are seen only in the two patients with HbH/CS and the patient with HbCS/CS.
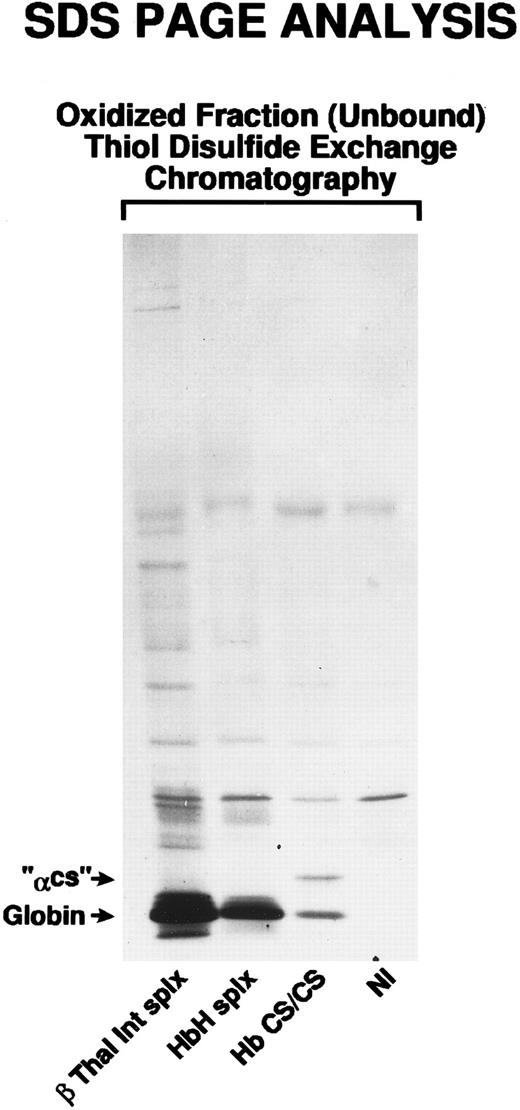
To determine if there had been oxidation of membrane-associated globin chains, we performed thiol-disulfide exchange chromatography, and the data are shown in Fig 6. In this assay, the unbound fraction represents proteins devoid of free thiols and, hence, oxidized proteins. The unbound protein fraction of membranes prepared from HbCS/CS cells contained αcs-globin chains, indicating that the membrane-associated αcs-globin chains were indeed oxidized. Membranes of HbH RBCs contained only oxidized β-globin chains. In Fig 6, β-thalassemia intermedia membranes contained only oxidized α-globin chains. All HbCS-containing RBCs had varying amounts of partially oxidized membrane-associated αcs (not shown). Using laser densitometry we determined the ratio of αcs to glycophorin A in two patients with Hb CS/CS from which we calculated that 15% to 30% of the membrane-associated αcs had become oxidized. This probably means that the single cysteine at position 10414 had become oxidized.
Thiol-disulfide exchange chromatography was performed on a normal control, a β-thalassemia intermedia patient who had been splenectomized, an HbH patient who had been splenectomized, and a patient with homozygous HbCS/CS. The unbound fraction was analyzed by SDS-PAGE and the αCS was identified at a position consistent with a molecular weight of 19 kD. Note the presence of globin bands at the bottom of the gel. These have previously been shown to be αA in β-thalassemia intermedia and βA in HbH.2
Thiol-disulfide exchange chromatography was performed on a normal control, a β-thalassemia intermedia patient who had been splenectomized, an HbH patient who had been splenectomized, and a patient with homozygous HbCS/CS. The unbound fraction was analyzed by SDS-PAGE and the αCS was identified at a position consistent with a molecular weight of 19 kD. Note the presence of globin bands at the bottom of the gel. These have previously been shown to be αA in β-thalassemia intermedia and βA in HbH.2
DISCUSSION
The HbCS gene is very common in Southeast Asia and its frequency approaches 5% to 8% in Thailand.8,9,21 The CS mutation only affects the α2 gene, which accounts for about 2/3 of normal α-globin chain production.14 Furthermore, the mRNA of αcs is very unstable compared with normal α mRNA and as such accounts for less than 1% of protein output of a normal α2 gene.14 Interestingly, in terms of pathophysiology, the synthesis of even small amounts of elongated αcs results in more severe anemia than is seen in analogous deletional α-thalassemia-2.14,15 Therefore, it has been suggested that αcs-chains may have deleterious effects on cellular and membrane properties of HbCS-containing RBCs and these changes in turn could account for increased hemolysis. To date the only well-documented pathobiologic feature of some of the HbCS variant RBCs is their increased cell volume relative to their Hb content.15,16 The unique properties of HbCS lead to studies indicating that the inclusion bodies seen in HbH are distributed somewhat differently than the inclusion bodies seen in HbH/CS.12 There is defective spectrin self association in HbH/CS but the same pattern is seen in HbH.22 HbCS/CS skeletons dissociated more readily with release of spectrin, actin, and band 4.1 than skeletons of HbH/CS which in turn dissociated more readily than HbH.20 Other than these observations there is currently little information available on various membrane alterations of HbCS-containing RBCs and the mechanistic basis for these changes.
The present study has enabled us to document a number of cellular and membrane changes in HbCS variant RBCs and also obtain some new insights into the mechanistic basis for these changes. A distinguishing feature of all HbCS variant RBCs studied is their increased volume relative to their Hb content (Fig 1), resulting in a large increase in the percentage of hypochromic (Hb concentration <28 g/dL) RBCs (Fig 1). Increased numbers of hypochromic RBCs were seen even in heterozygous HbCS RBCs, implying a role of αcs in cell volume regulation. The increased numbers of hypochromic RBCs in HbH/CS compared with HbH further validates this thesis. Importantly, our finding that reticulocytes in both HbH and HbH/CS are more hydrated than normal reticulocytes (Fig 2, Table 1) implies that hydration of these cells occurs early in their development. We have previously documented increased hydration of HbH RBCs and proposed that damage to membrane transport pathways induced by membrane-associated oxidized β-chains may be responsible for the deranged volume regulation of these RBCs.2 Our present finding that increased hydration is also a feature of reticulocytes in HbH allows us to consider that damage to the K-Cl cotransport pathway might be the basis for increased hydration of these RBCs without excluding other cellular hydration systems. However, the K-Cl cotransport pathway plays a major role in volume regulation of early erythroid cells as well as reticulocytes; therefore, damage to this transport mechanism could prevent the volume loss that accompanies maturation of normal erythroblasts and reticulocytes to RBCs.10,23,24 Furthermore, the finding that reticulocytes and RBCs in HbH/CS are even more hydrated than comparable HbH RBC suggests that αcs interacting with the membrane may accentuate the damage induced by β-globin chains to the K-Cl cotransport, or other transport systems controlling cellular hydration.23,24 These effects of αcs on cell volume regulation resemble those exerted by β-globin rather than those induced by α-globin.2 11
Quantitation of membrane rigidity and mechanical stability showed that HbCS variant RBCs demonstrated considerable alterations in these membrane material properties. Increased membrane rigidity and increased membrane mechanical stability were features of all the HbCS variant cells studied. These changes are identical in direction to those induced by oxidized β-globin chains interacting with the membrane and enhanced them.2 Thus, as with volume regulation, the membrane alterations induced by αcs were akin to those induced by β-globin chains rather than those induced by α-globin chains in severe β thalassemia.2
The exploration of the biochemical basis for these impressive cellular and membrane alterations in HbCS variant RBCs showed that partially oxidized αcs was associated with the membranes of all HbCS variant RBCs (Figs 4 and 6). Membrane skeletal preparations of HbCS variant RBC revealed that αcs was associated with membrane skeletal structures (Fig 5). Thus, as in the case of HbH and β-thalassemia intermedia where oxidized β-globin and oxidized α-globin, respectively, are associated with the membrane and its skeletons,2 3 partially oxidized αcs is associated with the skeletal structure in all the HbCS variant RBCs. We do not know why αcs behaves in this manner. The 31 additional amino acids do not contain an extra cysteine which could be oxidized. But this stretch of amino acids contains 14 relatively hydrophobic amino acids and thus might lead to insertion of αcs into membrane transport sites. By comparing the cellular and membrane alterations documented in HbH, HbH/CS, HbCS/CS, and β-thalassemia intermedia, we come to the conclusion that oxidized αcs induced changes that mimic those induced by oxidized β-globin.
The mechanism(s) by which these highly specific globin-chain–induced abnormalities are produced remains incompletely understood. Each of these globin chains contains heme and its associated iron. The role of this membrane-associated iron in producing localized oxidant damage in sickle disease and in thalassemia has been extensively explored by Shalev et al.25 A likely hypothesis is that each of these partially oxidized globin chains (αA, αcs, and βA) produce highly specific sorts of oxidant damage relating to their underlying physical chemistry and special sites of localization. We believe that we have begun to unravel the unique pathophysiology of the HbCS variants that accounts for the increased severity of the anemia and the related alterations in cellular hydration and in membrane mechanical properties. In these HbCS variants of α-thalassemia, in addition to the membrane accumulation of the excess β-globin chains characteristic of all α-thalassemias, there is membrane-associated αcs as well. Surprisingly, this additional impact produced by αcs leads to membrane damage more akin to that produced by βA than the αA accumulation seen in β-thalassemia. The mechanistic basis for the effects of oxidized αcs on cell volume regulation and membrane material properties awaits further detailed studies of the specific protein targets perhaps undergoing oxidant damage, including the K-Cl transporter, spectrin, and band 3.
NOTE ADDED IN PROOF
While the manuscript was being prepared Prof Prapon Wilairat informed us that he had also noted the presence of αCS in the membrane of RBC containing HbCS.26
Supported by grants from National Institutes of Health (DK 13682, DK 26263, and HL 31579); a grant from the European Community, EEC TSS-CT92-0081 from NATSDA, Thailand; and a grant from Prajadhipok Rambhai Barni Foundation.
Address reprint requests to S.L. Schrier, MD, Division of Hematology, Stanford University School of Medicine, Stanford, CA 94305-5112.

This feature is available to Subscribers Only
Sign In or Create an Account Close Modal