Abstract
The success of adoptive immunotherapy for the treatment of leukemia depends on the generation of T cells that can specifically react with malignant cells. Dendritic cells (DCs) are important antigen-presenting cells in the development of antileukemic T-cell responses. In this study, we generated DCs from peripheral blood cells of patients with chronic myelogenous leukemia (CML). CML cells incubated concurrently with granulocyte-macrophage colony-stimulating factor, interleukin-4, and tumor necrosis factor-α in vitro developed morphologic and phenotypic characteristics of DCs. Fluorescence in situ hybridization showed the presence of t(9; 22) in the nuclei of these cells, indicating that they were leukemic in origin. These cells were potent stimulators of lymphocyte proliferation in specific in vitro assays for DC function. Autologous T cells stimulated with in vitro-generated, leukemic DCs displayed vigorous cytotoxic activity against CML cells but low reactivity to major histocompatability complex-matched normal bone marrow cells. Cytotoxic activity against CML targets was fourfold to sixfold higher using DC-stimulated autologous T cells than with autologous T cells expanded by culture with interleukin-2 alone. DC-stimulated T cells also inhibited growth of CML clonogenic precursors in colony-forming assays in vitro. These results suggest that cytokine-driven in vitro differentiation of CML cells results in generation of DCs with potent T-cell stimulatory function. In vitro-generated DCs can be effectively used as antigen-presenting cells for the ex vivo expansion of antileukemic T cells.
T-CELL IMMUNITY plays a critical role in preventing relapse of chronic myelogenous leukemia (CML) after allogeneic bone marrow transplantation.1 Patients who receive bone marrow transplants from identical twins and recipients of T-cell–depleted transplants have a significantly higher risk of relapse compared with those patients who receive unmanipulated transplants from HLA-identical sibling.2,3 More directly, infusion of peripheral blood lymphocytes from the allogeneic donor can induce remission in patients who relapse after transplantation.4
Adoptive immunotherapy with autologous antileukemic T cells may be potentially useful in the context of autologous bone marrow transplantation for CML. A critical component for generation of antileukemic T cells is presentation of leukemia-associated antigens in conjunction with a potent antigen-presenting cell. Dendritic cells (DCs) are effective antigen-presenting cells, capable of inducing cytotoxic responses from naive T cells.5,6 DCs can be generated in vitro from hematopoietic progenitors when cultured in the presence of granulocyte-macrophage colony-stimulating factor (GM-CSF ), tumor necrosis factor-α (TNF-α) and interleukin-4 (IL-4).7,8 CML is a clonal disorder arising from a pluripotent stem cell in which cells of the myeloid and B-lymphoid lineage are derived from malignant progenitors.9 In this study, we showed that DCs in CML patients can be derived from the malignant clone and that these malignant DCs could induce antileukemic reactivity in autologous T lymphocytes without the neccessity for additional exogenous antigens.
MATERIALS AND METHODS
Patients.Blood and bone marrow samples for this study were collected from patients and normal donors concurrently with clinical test samples, after obtaining informed consent. The protocol was reviewed and approved by the institutional review board of the M.D. Anderson Cancer Center. All of the patients had CML and cell samples were collected at diagnosis or less than 10 days after commencing treatment with hydroxyurea. Patients were in chronic phase and cytogenetic analysis showed that 100% of the analyzed metaphases carried t(9; 22).
Generation of dendritic cells from CML cells.Peripheral blood mononuclear cells (PBMNCs) were separated from CML patients and normal donors using a discontinuous density gradient (LSM; Organon Teknika Corp, Rockville, MD) and cultured or cryopreserved. To generate DCs, mononuclear cells in a 2 × 10⁶/mL concentration were cultured in 75-mm2 tissue culture flasks (Corning Inc, Corning, NY) in RPMI-1640 (GIBCO Laboratories, Grand Island, NY) supplemented with 2 mmol/L glutamine, 10% heat-inactivated fetal bovine serum (Hyclone Laboratories Inc, Logan UT), and the following human cytokines. Recombinant granulocyte-macrophage colony-stimulating factor (GM-CSF; Immunex, Seattle, WA) was added at a final concentration of 1,000 U/mL. Recombinant tumor necrosis factor-α (TNF-α) and interleukin-4 (IL-4; Genzyme Corp, Cambridge MA) were used at a final concentration of 50 U/mL and 1,000 U/mL, respectively.
In some experiments, DCs were enriched using anti-CD1a antibody (Immunotech, Westbrook, ME) and immunomagnetic separation using a previously established procedure.10 CML cells cultured for 10 days as described above were washed and treated with mouse monoclonal anti-CD1a antibody at a concentration of 1 μg/106 cells for 30 minutes at 4°C. They were washed and incubated for 30 minutes with sheep antimouse IgG-coated magnetic beads (Dynal, Oslo, Norway) at a 1:10 bead:cell ratio. Rosetted cells were separated using a magnet, washed, and briefly treated with 0.05% trypsin to detach the beads. The detached beads were magnetically removed and the cells were cultured for an additional 4 days under conditions described above.
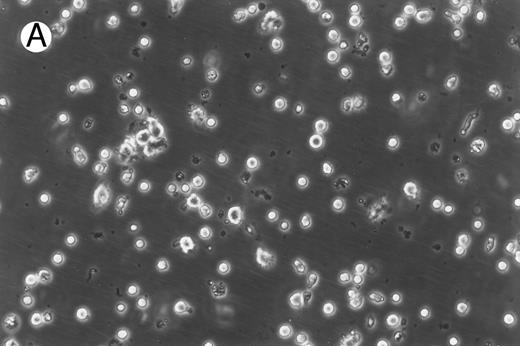
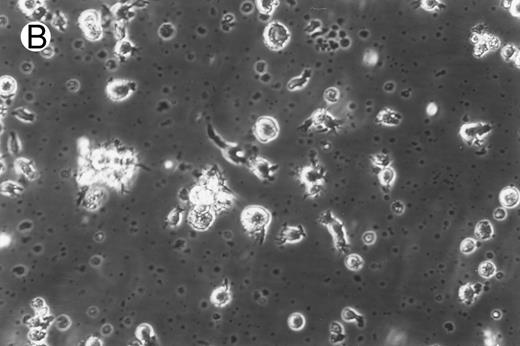
Morphology of freshly isolated and cultured CML cells. PBMNCs from chronic-phase CML patients were isolated and cultured as described in the Materials and Methods. The results depicted are phase-contrast micrographs of freshly isolated cells (A) and after 10 days of culture in the presence of GM-CSF, IL-4, and TNF-α (B).
Morphology of freshly isolated and cultured CML cells. PBMNCs from chronic-phase CML patients were isolated and cultured as described in the Materials and Methods. The results depicted are phase-contrast micrographs of freshly isolated cells (A) and after 10 days of culture in the presence of GM-CSF, IL-4, and TNF-α (B).
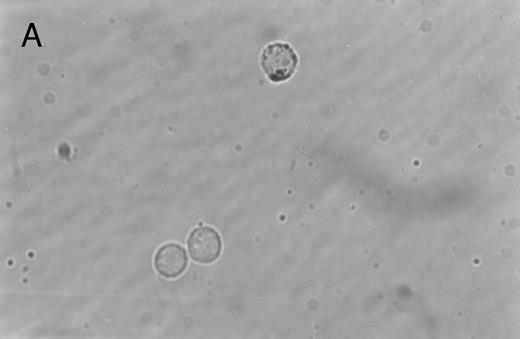
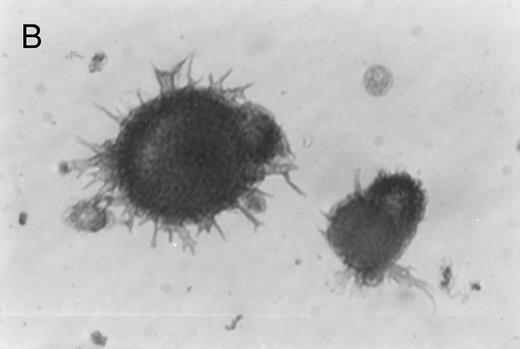
Immunoperoxidase staining of of freshly isolated and cultured CML cells with anti-CD1a antibody. Freshly isolated (A) or 10-day cultured, nonadherent CML cells (B) were adhered to poly-l-lysine–coated coverslips and stained with anti-CD1a and peroxidase-conjugated antimouse IgG. Cells stained with isotype control antibody and peroxidase conjugate were similar to those depicted in (A) (data not shown).
Immunoperoxidase staining of of freshly isolated and cultured CML cells with anti-CD1a antibody. Freshly isolated (A) or 10-day cultured, nonadherent CML cells (B) were adhered to poly-l-lysine–coated coverslips and stained with anti-CD1a and peroxidase-conjugated antimouse IgG. Cells stained with isotype control antibody and peroxidase conjugate were similar to those depicted in (A) (data not shown).
Immunocytochemical staining of dendritic cells.Freshly isolated or 10-day cultured CML cells were adhered to glass coverslips (Oncor Inc, Gaithersburg, MD) coated with poly-l-lysine (Sigma Chemical Co, St Louis, MO) and fixed with buffered paraformaldehyde. Endogenous peroxidase activity was reduced by incubating the cells for 15 minutes in 0.5% H2O2 followed by a blocking step with phosphate-buffered saline + 2% human IgG (Sandoz, East Hanover, NJ) for 30 minutes. The cells were incubated with CD1a antibody (0.05 μg/mL), washed, and further incubated with peroxidase-conjugated rabbit antimouse IgG (Sigma) diluted 1:200 with phosphate-buffered saline (PBS)-hIgG. Colored product was developed using a substrate consisting of 1.3 mmol/L diaminobenzidine, 0.02% H2O2 , and 0.03% NiCl2 (Sigma).
Phenotypic analysis of cells by flow cytometry.Fluorescein- or phycoerythrin-conjugated mouse monoclonal antibodies against CD3, CD4, CD8, CD11b, CD13, CD15, CD14, CD20, CD33, and CD34 and fluorochrome-labeled isotype controls were purchased commercially (Becton Dickinson, Duarte, CA). Fluorescein- or phycoerythrin-labeled antibodies against HLA-D, HLA-A,B,C, CD1a, CD 74, CD80, and CD86 were purchased from Pharmingen (San Diego, CA). Freshly isolated or day-14, CD1a-enriched DCs were incubated with various combinations of antibodies, washed with PBS-hIgG, and analyzed using a FACSscan II flow cytometer and the LYSIS software (Becton Dickinson).
Lymphocyte proliferation assays.Oxidative mitogenesis assays were performed according to a previously established procedure.11 PBMNCs from normal volunteers were treated with 1.2 mmol/L sodium periodate and used as responder cells. Freshly isolated CML cells or immunomagnetically enriched DCs irradiated with 30 Gy were used as stimulator cells. Periodate-treated PBMNCs (2 × 10⁵) were added as responders to varying numbers of accessory cells. Lymphocyte proliferation was measured at the end of 48 hours of culture by quantitating incorporation of 3H-thymidine added for the final 4 hours of culture.
Mixed leukocyte response (MLR) assays were performed using a procedure similar to that described above using untreated PBMNCs as responder cells. Lymphocyte proliferation was measured after 4 days of cultures with the addition of 3H-thymidine for the final 18 hours of culture.
Genetic analysis of cells by fluorescence in situ hybridization (FISH).To confirm that the immunomagnetically enriched DCs were derived from leukemic progenitors, dual-color BCR/ABL translocation DNA probes (Oncor) were used to examine interphase nuclei. FISH procedures were performed according to the manufacturer's instructions. Normal cells were expected to display randomly distributed, two red (BCR gene) and two green (ABL gene) hybridization signals. Leukemic cells were expected to display a red, a green, and a yellow signal that resulted from the fusion of the BCR and ABL gene. Four hundred cells were examined in each sample to quantitate the percentage of cells bearing the BCR/ABL translocation.
Expansion of T cells from CML patients and stimulation with autologous DCs.PBMNCs of CML patients were suspended at a concentration of 1 × 10⁶ cells/mL and cultured in RPMI + FCS containing 1,000 U/mL α-interferon (α-IFN; Roche Laboratories, Nutley, NJ) for 24 hours. They were then washed and resuspended in medium containing 5 μg/mL Con A (Sigma) and 500 U/mL IL-2 (Chiron Therapeutics, Emeryville, CA). Nonadherent cells were resuspended in fresh medium containing IL-2 every 3 to 4 days of culture. On day 7, the cells were divided into two groups. Nonenriched, irradiated DCs were added to one group at a ratio of 3:1, whereas the other group was maintained in IL-2–containing medium alone. Both groups of cells were expanded for an additional 7 days in IL-2–containing medium before being assayed for antileukemic activity.
T-cell cytotoxicity assay.T-cell cytotoxicity was measured in vitro using the lactate dehydrogenase (LDH) release assay.12 Thawed, cryopreserved target cells were cocultured with effector T cells at various ratios for 6 hours in 96-well round-bottomed plates in phenol red-free RPMI + 0.1% human albumin (Miles Inc, Elkhart, IN). Spontaneous release of effector and target cells was controlled by separate incubation of the respective populations. Maximal LDH enzyme release was measured after lysis of the target cells with 0.5% Triton X-100 (Sigma). Cell-free supernatants were incubated in a separate 96-well plate with LDH substrate12 for 10 minutes before measuring absorbance using a microplate reader (Dynatech MR5000) at 490 nm with 650 nm reference. The percentage of cytotoxicity was calculated according to the following formula: % Age Cytotoxicity = ([E − St − Se]/[M − St]) × 100. With E being the LDH release by effector-target coculture, St being the spontaneous release by target cells, Se being the spontaneous release by effector cells, and M being the maximal release by target cells.
Colony-forming units (colony-forming unit–granulocyte-macrophage [CFU-GM]) assay.A total of 1 × 10⁵ bone marrow mononuclear cells (BMMNCs) from CML patients or major histocompatability complex (MHC)-matched normal donors were incubated with 25 × 105 DC-stimulated T cells or freshly isolated PBMNCs from normal donors for 6 hours. The cells were then suspended in medium containing methylcellulose and the growth factors GM-CSF (10 ng/mL), stem cell factor (50 ng/mL), IL-3 (10 ng/mL), and erythropoietin (3 U/mL; Methocult; Stem Cell Technologies, Vancouver, British Columbia, Canada), and colonies were scored after 10 days of culture. Results were reported as the mean ± SD of triplicate cultures.
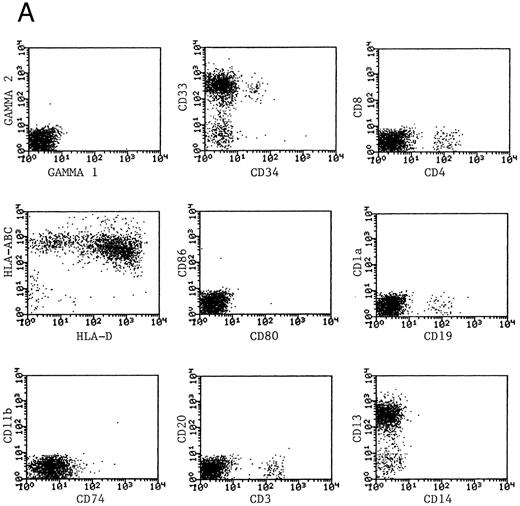
Phenotype of fresh and cultured, CD1a-enriched CML cells. Freshly isolated PBMNCs from CML patients (A) or immunomagnetically enriched day 10 cells cultured for an additional 4 days (B) were stained with fluorescein- or phycoerythrin-conjugated antibodies and analyzed by flow cytometry. Cellular debris was gated out on the basis of light scatter and the plots depict fluorescence values on all viable cells. The results of one representative experiment are shown. Similar results were noted for seven other patients.
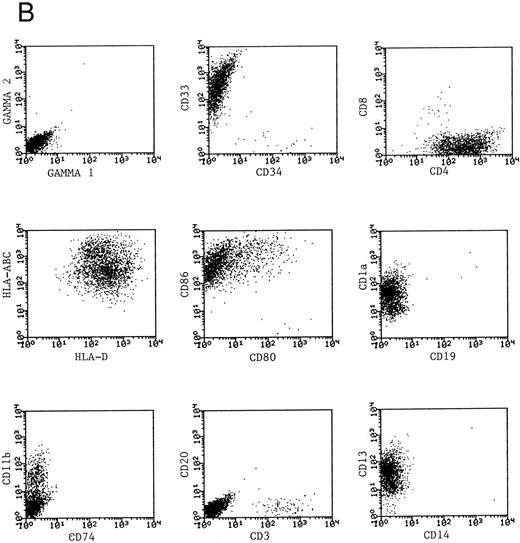
Phenotype of fresh and cultured, CD1a-enriched CML cells. Freshly isolated PBMNCs from CML patients (A) or immunomagnetically enriched day 10 cells cultured for an additional 4 days (B) were stained with fluorescein- or phycoerythrin-conjugated antibodies and analyzed by flow cytometry. Cellular debris was gated out on the basis of light scatter and the plots depict fluorescence values on all viable cells. The results of one representative experiment are shown. Similar results were noted for seven other patients.
RESULTS
Generation of dendritic cells in vitro.Freshly isolated PBMNCs of CML patients appeared as dispersed, spherical cells with a smooth surface morphology (Fig 1A). After 3 to 4 days of culture, the cells appeared larger and were associated in nonadherent grape-like clusters with short projections emerging from the surface. Between days 7 and 10, in clusters or dispersed, nonadherent cells with large-cell bodies and long dendritic projections were the predominant population (Fig 1B). In addition, there was a minor but significant population of strongly adherent macrophages. Beginning with an initial population of 10 × 106 cells, 2.4 ± 1.8 × 10⁶ viable cells were recovered on day 2, 3.9 ± 1.6 × 10⁶ cells were recovered on day 8, and 4.6 ± 2.2 × 10⁶ cells were recovered on day 14. On days 0 and 2, less than 1% of these cells exhibited a dendritic morphology. The numbers of cells with a dendritic morphology increased to 24% ± 6% after 8 days and 53% ± 14% on day 14 of culture (n = 9). The viability and dendritic morphology of these cells could be maintained for up to 29 days by transferring the nonadherent cells into fresh medium containing GM-CSF, IL-4, and TNF-α every 3 to 4 days. No significant increase in cell numbers was noted after days 14 to 18.
Immunohistochemical staining of cultured CML cells with anti-CD1a antibodies.Previous studies have shown that Langerhans cells of the skin and dendritic cells express CD1a.8 13 Freshly isolated or cultured CML cells were adhered to poly-l-lysine–coated slides and stained with anti-CD1a antibodies as described in the Materials and Methods. In the freshly isolated population, a few cells displayed a weak, punctate staining that could be attributed to endogenous peroxidase (Fig 2A). In contrast, the cultured cells of dendritic morphology showed intense homogeneous staining with the antibody (Fig 2B). Approximately, 70% to 75% of the cells expressed moderate to high levels of CD1a after 10 days of culture compared with less than 1% of the freshly isolated CML cells expressing this antigen.
Phenotypic analysis of DCs.The expression of CD1a on the surface of DCs provided a useful means of further enriching DCs and examining their properties as a distinct population. Dendritic cells were immunomagnetically enriched on day 10 with the anti-CD1a antibody and cultured for an additional 4 days before examination of surface molecules by flow cytometry. Figure 3 represents the surface phenotype of freshly isolated (Fig 3A) and immunomagnetically enriched DCs (Fig 3B) obtained with one CML patient. Similar results were also obtained with four other patient samples. The changes in expression of surface molecules that accompanied differentiation of CML cells into DCs are summarized in Table 1. Whereas MHC class I and class II antigens were noted to be expressed by freshly isolated CML PBMNCs as well as by day 14 DCs, the expression of the costimulatory molecules B7-1 (CD80) and B7-2 (CD86) on the DCs was a notable change in phenotype after differentiation in vitro.
Surface Phenotype of Freshly Isolated and CD1a-Enriched CML-Derived DCs
| Marker . | Freshly Isolated CML Cells . | DCs . |
|---|---|---|
| CD 1a | − | ++ |
| CD 3 | +/− | − |
| CD 4 | +/− | + |
| CD 8 | − | − |
| CD 13 | ++ | ++ |
| CD14 | − | − |
| CD 19 | − | − |
| CD 20 | − | − |
| CD 33 | ++ | ++ |
| CD 34 | − | − |
| CD 74* | + | − |
| CD 80 (B7-1) | − | + |
| CD 86 (B7-2) | − | ++ |
| HLA-ABC | ++ | ++ |
| HLA-DR | ++ | ++ |
Abbreviations: −, 0% to 5%; +/−, 6% to 10%; +, 11% to 50%; ++, 51% to 100%.
Surface invariant chain.
Functional properties of DCs generated from CML cells.The immunostimulatory properties of DCs were compared with those of freshly isolated CML using in vitro, lymphoproliferative assays. The oxidative mitogenesis assay measures the proliferation of lymphocytes treated with sodium periodate when cocultured with varying numbers of DCs. Macrophages and B cells do not serve as accessory cells in this assay, which makes it a sensitive and specific assay to measure dendritic cell function.11 In the present study, various numbers of irradiated, freshly isolated CML cells or immunomagnetically purified, day 14 DCs were cocultured with 2 × 10⁵ periodate-treated responder lymphocytes. Proliferation of the responder cells was measured at the end of 48 hours by measuring the incorporation of 3H-thymidine added for the final 4 hours of culture. As shown in Table 2, immunomagnetically purified and cultured DCs were potent stimulators of periodate-treated lymphocytes, whereas freshly isolated CML cells had poor or negligible immunostimulatory activity. Similar results were also obtained in the MLR assays when the ability of DCs to stimulate allogeneic lymphocytes was measured. Freshly isolated CML cells were poor stimulators of MHC-mismatched peripheral blood lymphocytes obtained from normal volunteers, whereas immunomagnetically purified and cultured DCs were potent stimulators of allogeneic lymphocytes.
Ability of Freshly Isolated and CD1a-Enriched Dendritic Cells to Stimulate Periodate-Treated and Allogeneic Lymphocytes
| Patient No. . | Freshly Isolated CML Cells . | CD1a-Selected DCs . | ||
|---|---|---|---|---|
| . | 2,000 Cells . | 1,000 Cells . | 2,000 Cells . | 1,000 Cells . |
| Periodate treated | ||||
| 1 | 642 ± 18 | <100 | 5,561 ± 714 | 2,633 ± 836 |
| 2 | <100 | <100 | 5,705 ± 193 | 3,132 ± 42 |
| 3 | <100 | <100 | 6,251 ± 403 | 3,632 ± 299 |
| 4 | 942 ± 270 | <100 | 14,175 ± 773 | 10,404 ± 118 |
| Allogeneic | ||||
| 1 | 1,924 ± 281 | 879 ± 404 | 13,663 ± 1,092 | 12,107 ± 627 |
| 2 | 1,825 ± 399 | 1,366 ± 114 | 16,131 ± 853 | 12,262 ± 308 |
| 3 | 1,092 ± 439 | 286 ± 523 | 17,430 ± 270 | 15,055 ± 230 |
| 4 | 2,156 ± 351 | 365 ± 311 | 14,150 ± 697 | 15,422 ± 1,610 |
Results represent the mean counts per minute ± SD of triplicate results with 200,000 responder lymphocytes and 2,000 or 1,000 stimulator cells. Counts are corrected for background incorporation of 3H-thymidine by 200,000 responder cells alone.
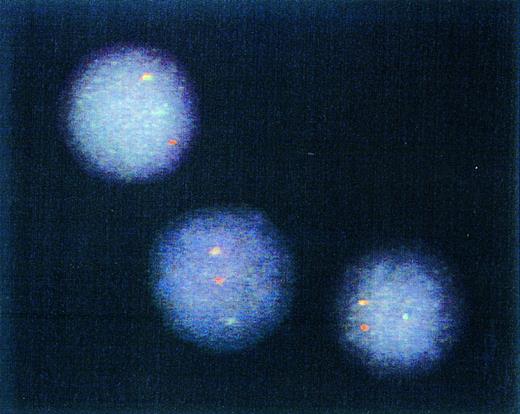
Genotype of immunomagnetically enriched DCs. Most DCs from four patients studied exhibited one red (BCR) gene, one green (ABL) gene, and one yellow/orange (fused BCR-ABL) gene hybridization signal after FISH procedure. Representative cells from a single patient sample are depicted.
Genotype of immunomagnetically enriched DCs. Most DCs from four patients studied exhibited one red (BCR) gene, one green (ABL) gene, and one yellow/orange (fused BCR-ABL) gene hybridization signal after FISH procedure. Representative cells from a single patient sample are depicted.
Detection of t(9; 22)by FISH of interphase nuclei.The results of the experiments described above indicated that differentiation of CML cells by the cytokines GM-CSF, TNF-α, and IL4 yielded cells with the morphology, phenotype, and functional properties of DCs. To assess whether they were of leukemic origin, immunomagnetically purified DCs were analyzed by interphase FISH for the presence of the fusion of BCR and ABL genes.14 Examples of cells from one CML patient are depicted in Fig 4. A yellow hybridization signal resulting from the fusion of the red (BCR) and green (ABL) hybridization signals was observed in most of the analyzed nuclei obtained from all four patients. These results confirmed that DCs obtained by in vitro differentiation of the CML cells were leukemic in origin. Day 14, CD1a-enriched cells from four patients were studied by FISH and BCR-ABL fusion-positive cells in these populations were 76%, 83%, 86%, and 73%.
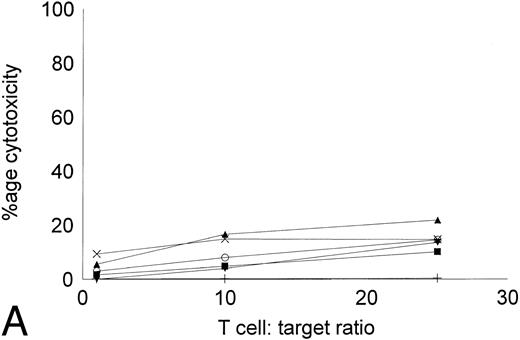
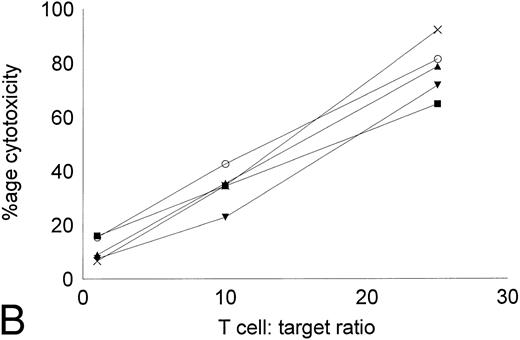
Cytotoxicity of IL-2–expanded and DC-stimulated T cells against autologous CML targets.T cells cocultured in IL-2–containing medium with or without autologous DCs were analyzed for residual myeloid cell contamination by flow cytometry. In both groups, greater than 95% of the cells expressed the T-cell marker CD2, whereas less than 1% of the cells expressed the myeloid marker CD13. A total of 63.8% ± 19.6% of the cells were CD8+CD4−, whereas 33.3% ± 16.3% of the cells were CD4+CD8− (n = 4). Less than 5% of the cells were CD4+CD8+ or CD56+ (data not shown). The number of T cells recovered with DCs and IL-2 or IL-2 alone were comparable. Figure 5 shows the cytotoxicity of the two T-cell groups against autologous CML targets. At an effector:target ratio of 25:1, IL-2–stimulated T cells displayed antileukemic cytotoxicity in the approximate range of 9% to 22% (Fig 5A). At the same effector:target ratio, 65% to greate than 90% cytotoxicity was noted with DC-stimulated T cells (Fig 5B). Thus, stimulation of T cells with autologous, leukemic DCs significantly increased the cytotoxicity of the effector cells against autologous leukemia cells.
Cytotoxicity of IL-2–expanded or DC-stimulated T cells against autologous CML targets. Autologous CML BMMNCs were incubated with various ratios of T cells stimulated with IL-2 alone (A) or IL-2 and DCs (B) for 6 hours, and the cell-free supernatants were assayed for LDH enzyme released. Maximum release was determined by lysing an equal number of target cells with 0.5% Triton X-100. Values were normalized for spontaneous release of enzyme by target and effector cells cultured alone. The symbols represent the results with individual patients. The data points shown were calculated using the mean value of triplicate cultures.
Cytotoxicity of IL-2–expanded or DC-stimulated T cells against autologous CML targets. Autologous CML BMMNCs were incubated with various ratios of T cells stimulated with IL-2 alone (A) or IL-2 and DCs (B) for 6 hours, and the cell-free supernatants were assayed for LDH enzyme released. Maximum release was determined by lysing an equal number of target cells with 0.5% Triton X-100. Values were normalized for spontaneous release of enzyme by target and effector cells cultured alone. The symbols represent the results with individual patients. The data points shown were calculated using the mean value of triplicate cultures.
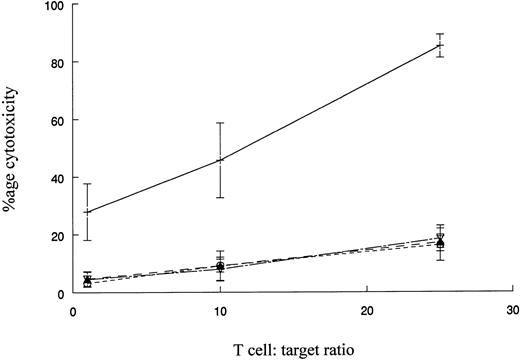
The reactivity of DC-stimulated T cells against HLA-matched normal donor or autologous remission state BMMNCs.The reactivity of DC-stimulated T cells against normal cells was evaluated using BMMNCs from MHC-matched normal donors as targets. K562 cells were also tested as targets to assess the extent of non–MHC-restricted cytotoxicity against a Ph+ cell. Figure 6 represents the cumulative results with four patients whose CML cells or MHC-matched donor BMMNCs were used as targets. DC-stimulated T cells had potent cytotoxic activity against CML cells but very low cytotoxicity towards normal BM cells. Very low levels of cytotoxicity were observed with K562 targets or a 1:1 mixture of K562 and donor BM cells. The results suggest that cytotoxicity is directed at MHC-matched, leukemic cells and very low levels of non–MHC-restricted cytotoxicity or reactivity towards normal BMMNCs is mediated by the effector T-cell populations.
Cytotoxicity of DC-stimulated T cells against autologous CML cells, MHC-matched normal cells, and the K562 cell line. The ability of DC-stimulated T cells to lyse autologous leukemic cells, MHC-matched normal cells, and K562 cells was measured as described in Fig 5. The results shown are the mean ± SEM of four patient-donor pairs. The difference in cytoxicity between CML cells (+) and normal cells (○), K562 cells (▴), or a 1:1 mixture of K562 cells and normal cells (▿) is significant (P ≤ .005, Student's paired t-test).
Cytotoxicity of DC-stimulated T cells against autologous CML cells, MHC-matched normal cells, and the K562 cell line. The ability of DC-stimulated T cells to lyse autologous leukemic cells, MHC-matched normal cells, and K562 cells was measured as described in Fig 5. The results shown are the mean ± SEM of four patient-donor pairs. The difference in cytoxicity between CML cells (+) and normal cells (○), K562 cells (▴), or a 1:1 mixture of K562 cells and normal cells (▿) is significant (P ≤ .005, Student's paired t-test).
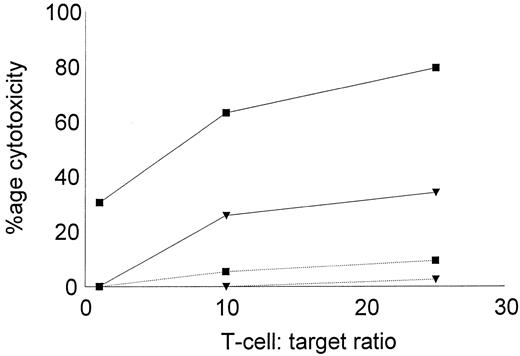
The low reactivity of DC-stimulated T cells against nonleukemic targets was further confirmed using autologous, remission state BMMNCs as targets in the cytotoxic assay. BMMNCs were obtained during diagnostic aspiration from two CML patients in remission. Both patients had received α-IFN and were in complete cytogenetic remission for greater than 4 years. Leukemic DCs and T cells were generated from cryopreserved PBMNCs collected at diagnosis, before therapy. DC-stimulated T cells were assayed for their cytotoxic activity against cryopreserved, thawed leukemic, or remisssion state targets. As shown in Fig 7, autologous, leukemic targets were lysed by DC-stimulated T cells, but little cytolytic activity was noted against the remission state BMMNCs.
Cytotoxicity of DC-stimulated T cells against autologous leukemic or remission state BMMNCs. DC-stimulated T cells were examined for their cytotoxic activity against autologous, leukemic, or remission state BMMNC targets. Solid lines represent the percentage of cytotoxicity against leukemic targets and dotted lines represent remission state BMMNC targets. The symbols represent the results with individual patients. Data points shown were calculated using the mean value of triplicate cultures.
Cytotoxicity of DC-stimulated T cells against autologous leukemic or remission state BMMNCs. DC-stimulated T cells were examined for their cytotoxic activity against autologous, leukemic, or remission state BMMNC targets. Solid lines represent the percentage of cytotoxicity against leukemic targets and dotted lines represent remission state BMMNC targets. The symbols represent the results with individual patients. Data points shown were calculated using the mean value of triplicate cultures.
Effect of DC-stimulated T cells on normal and leukemic colony growth.The progression of leukemia and relapse after chemotherapy or transplantation is thought to result from persistent, clonogenic, leukemic precursors. Any therapeutic efficacy of antileukemic T cells would thus be dependent on their ability to inhibit leukemic clonogenic precursors without affecting normal blood formation. The effect of DC-stimulated T cells on leukemic colony growth was examined in a CFU-GM assay. T cells stimulated with DCs and IL-2 or IL-2 alone were cocultured with autologous, leukemic, or MHC-matched, normal BMMNCs at a ratio of 25:1 for 6 hours before being assayed for CFU-GM growth. A significant inhibition of leukemic colony growth by DC-stimulated T cells was noted without a notable effect on the numbers of CFU-GM in normal bone marrow cultures (Table 3). In addition to a total decrease in the number of colonies, there was a reduction in the average colony size generated from CML bone marrow when cocultured with DC-stimulated T cells (data not shown) that may be the result of soluble factors such as γ-IFN and TNF-α produced by T cells that are inhibitory to CML colony growth.15 T cells expanded in IL-2 alone caused a smaller but statisitically significant reduction in the numbers of colonies by the autologous CML bone marrow.
Effect of T Cells Stimulated With IL-2 or DC and IL-2 on Colony Growth by Autologous CML or MHC-Matched Normal BMMNCs
| Effector Cell Type . | Autologous CML Targets . | HLA-Matched Normal BM Targets . |
|---|---|---|
| None | ||
| Patient no. 1 | 107 ± 22 | 44 ± 9 |
| Patient no. 2 | 213 ± 31 | 79 ± 20 |
| Patient no. 3 | 332 ± 145 | 169 ± 73 |
| IL-2 expanded | ||
| Patient no. 1 | 94 ± 44 | 36 ± 20 |
| Patient no. 2 | 116 ± 34 | 51 ± 12 |
| Patient no. 3 | 245 ± 62 | 117 ± 16 |
| P ≤ .01 | P < NS | |
| DC + IL-2 expanded | ||
| Patient no. 1 | 16 ± 10 | 34 ± 16 |
| Patient no. 2 | 23 ± 10 | 58 ± 3 |
| Patient no. 3 | 31 ± 1 | 212 ± 110 |
| P ≤ .001 | P = NS |
One hundred thousand BMMNCs, were incubated with 25 × 105 T cells for 6 hours before culture for 10 days in methylcellulose medium. Values represent the mean number of colonies ± SD of triplicate cultures. Statistical significance was determined using the Student's t-test.
Abbreviation: NS, not significant (P ≥ .05).
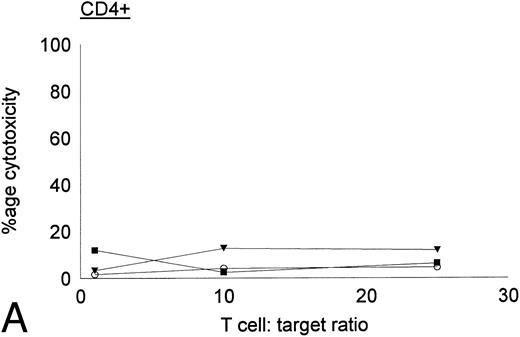
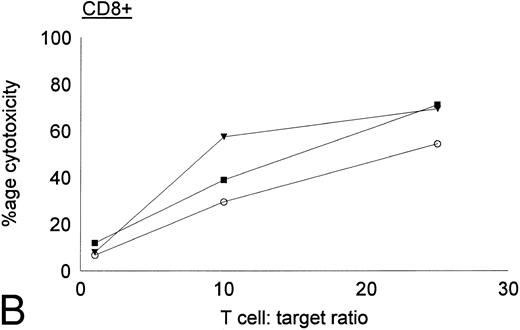
Antileukemic activities of CD4+ and CD8+ DC-stimulated T cells.DC-stimulated T cells were fractionated into CD4+ and CD8+ subpopulations by immunomagnetic depletion of the corresponding population with monoclonal anti-CD4 or CD8 antibodies. These populations were then tested for cytolytic activity against autologous CML targets. As shown in Fig 8, CD8+ cells were potent effectors of cytolytic activity, whereas very little cytotoxicity was associated with the CD4+ population. However, these results do nor rule out the possibility that CD4+ populations may provide helper functions with other cell populations or direcly lyse leukemia cells after longer periods of coculture or at higher effector:target ratios. In addition to cytotoxicity by direct cellular interaction, culture supernatants of CD4+ or CD8+ DC-stimulated T cells were assayed for their ability to inhibit the colony growth of leukemic cells. The addition of 30% supernatant from cultures of CD4+ but not CD8+ DC-stimulated T cells brought about a partial but significant inhibition of colony growth by CML cells (Table 4). Previous studies have also reported that weakly cytolytic CD4+ T cells can secrete soluble factors that inhibit the growth of leukemia cells.15
Cytotoxic activity of CD4+ and CD8+ DC-stimulated T cells against autologous CML targets. CD4+ and CD8+ T cells were obtained by immunomagnetic depletion of the corresponding fraction with monoclonal anti-CD4 and anti-CD8 antibodies and tested in vitro for cytotoxic activity against autologous CML target cells. The symbols represent results with individual patients. Data points shown were calculated using the mean value of triplicate cultures.
Cytotoxic activity of CD4+ and CD8+ DC-stimulated T cells against autologous CML targets. CD4+ and CD8+ T cells were obtained by immunomagnetic depletion of the corresponding fraction with monoclonal anti-CD4 and anti-CD8 antibodies and tested in vitro for cytotoxic activity against autologous CML target cells. The symbols represent results with individual patients. Data points shown were calculated using the mean value of triplicate cultures.
Effect of Culture Supernatant From CD4+ or CD8+ DC-Stimulated T Cells on Colony Growth by Autologous CML Cells
| Patient No. . | Medium . | CD4+ Supernatant . | CD8+ Supernatant . |
|---|---|---|---|
| 1 | 129 ± 14 | 78 ± 16 | 97 ± 7 |
| 2 | 247 + 27 | 120 ± 34 | 205 ± 16 |
| 3 | 376 ± 24 | 164 ± 32 | 324 ± 42 |
| P ≤ .005 | P = NS |
| Patient No. . | Medium . | CD4+ Supernatant . | CD8+ Supernatant . |
|---|---|---|---|
| 1 | 129 ± 14 | 78 ± 16 | 97 ± 7 |
| 2 | 247 + 27 | 120 ± 34 | 205 ± 16 |
| 3 | 376 ± 24 | 164 ± 32 | 324 ± 42 |
| P ≤ .005 | P = NS |
One hundred thousand autologous CML BMMNCs were cultured in Methocult medium with 30% T-cell culture supernatant or control medium. Results represent the mean ± SD of triplicate cultures. Statistical significance determined using the Student's t-test.
Abbreviation: NS, not significant (P ≥ .05).
DISCUSSION
DCs are important antigen-presenting cells that can enhance generation of helper T-cell responses and cytotoxic cells from naive T cells in vitro.16-18 In this study, DCs generated from CML progenitors were shown to be Ph+ by FISH. These CML DCs function as potent accessory cells and likely present a range of leukemia-associated antigens such as peptides derived from the bcr-abl fusion protein or the abnormal products of the transformed malignant state.19 In terms of morphology and phenotypic and functional characteristics, the properties of CML DCs were very similar to those described for normal DCs.
Our results show that cocultivation of T cells with autologous CML DCs generates effectors with greater cytolytic activity against autologous CML targets than T cells expanded in IL-2 alone. CML DCs were substantially more active than freshly isolated CML cells in stimulating T-cell proliferation in the oxidative mitogenesis and MLR assays.
It has been previously reported that TNF-α downregulates processing and presentation of exogenous, soluble antigens by DCs while it concurrently upregulates their T-cell stimulatory activity.12 The results of our flow cytometry studies also indicate that expression of invariant chain (CD74) is downregulated in DCs in comparison to freshly isolated CML cells. The presence of TNF-α during the differentiation of DCs may be advantageous towards the generation of antileukemic T cells, because downregulation of exogeneous antigen processing and presentation may sustain expression of leukemic peptides initially presented on the surface of the CML cells.
High-dose chemoradiotherapy and autologous bone marrow transplantation can induce transient remission in patients with CML. Both normal and malignant progenitors are present in this disease. Relapse after autologous bone marrow transplantation is related to the presence of malignant cells in the marrow graft20 and to the inability of pretransplant conditioning regimens to totally eliminate minimal residual disease in patients without unacceptable levels of nonhematologic toxicity. The use of adoptive immunotherapy involving expanded antileukemic, cytotoxic T cells may offer a reasonable approach to eliminate residual disease in these patients.
In this study, T cells selectively cytolytic against CML mononuclear cells and colony-forming progenitors were generated by cocultivation of autologous blood mononuclear cells with CML DCs. The antileukemic acivity may be exerted by direct cellular cytotoxicity and through soluble factors that inhibit the growth of leukemic progenitors. Using this methodology, it may be feasible to generate sufficiently large numbers of cells for cellular immunotherapy. The toxicity and efficacy of these ex vivo-generated cytotoxic cells deserves study in clinical trials.
In conclusion, functional DCs can be generated from the malignant clone from patients with CML. Cocultivation of autologous blood mononuclear cells with CML DCs and IL-2 leads to generation of T cells with significantly greater cytotoxicity against CML cells than HLA-matched or autologous normal hematopoietic cells.
ACKNOWLEDGMENT
We thank A. Durett for technical assistance with flow cytometry and Drs R. Bast, G. Mills, and W. Bowers for helpful suggestions and discussions.
Supported by Grant No. CA49639 from the National Cancer Institute.
Address reprint requests to Richard E. Champlin, MD, Department of Hematology and Laboratory Medicine, University of Texas M.D. Anderson Cancer Center, 1515 Holcombe Blvd, Box 24, Houston, TX 77030.

This feature is available to Subscribers Only
Sign In or Create an Account Close Modal