In the HTML version of the article, due to an error that occurred during the publication process, a duplicate copy of Table 2 was displayed in place of Figure 1. The correct Figure 1 was published in the printed and PDF versions of the article, and it has been inserted in the HTML version. It is also shown below.
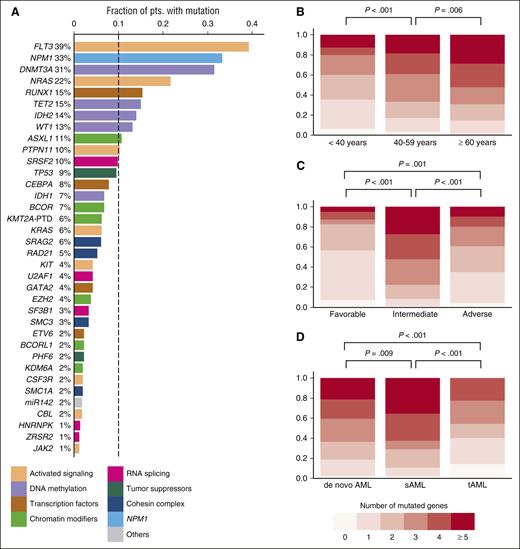
Overview of driver gene mutations identified by targeted sequencing in 664 AML patients. (A) Histogram showing the frequency of driver gene mutations detected in >1% of patients. Bars are colored according to the functional category assigned to each driver gene. (B) Number of mutated driver genes per patient, according to age category (<40 years, n = 112; 40-59 years, n = 264; ≥60 years, n = 288). (C) Number of mutated driver genes per patient, according to MRC cytogenetic risk category (favorable, n = 65; intermediate, n = 452; adverse, n = 129). (D) Number of mutated driver genes per patient for patients with de novo AML (n = 570) compared with sAML (n = 59) or tAML (n = 35). P values in (B-D) were calculated by the Kruskal-Wallis test, without adjustment for multiple testing.
Overview of driver gene mutations identified by targeted sequencing in 664 AML patients. (A) Histogram showing the frequency of driver gene mutations detected in >1% of patients. Bars are colored according to the functional category assigned to each driver gene. (B) Number of mutated driver genes per patient, according to age category (<40 years, n = 112; 40-59 years, n = 264; ≥60 years, n = 288). (C) Number of mutated driver genes per patient, according to MRC cytogenetic risk category (favorable, n = 65; intermediate, n = 452; adverse, n = 129). (D) Number of mutated driver genes per patient for patients with de novo AML (n = 570) compared with sAML (n = 59) or tAML (n = 35). P values in (B-D) were calculated by the Kruskal-Wallis test, without adjustment for multiple testing.


This feature is available to Subscribers Only
Sign In or Create an Account Close Modal