Key Points
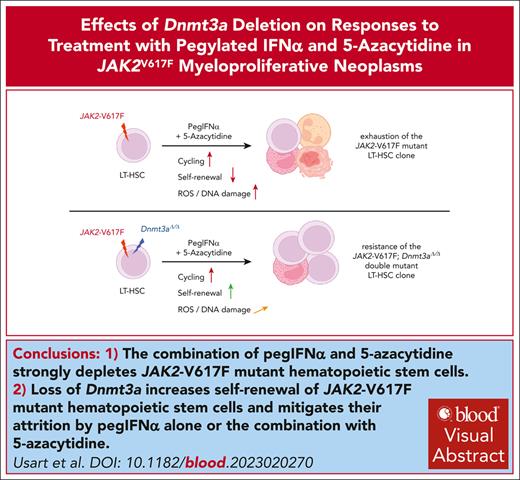
Loss of Dnmt3a increases self-renewal of JAK2-V617F HSCs and mitigates their attrition upon chronic pegIFN-α treatment.
A combination of pegIFN-α and 5-azacytidine can strongly decrease the JAK2-mutant allele burden in MPN driven by JAK2-V617F alone.
Visual Abstract
Pegylated interferon alfa (pegIFN-α) can induce molecular remissions in patients with JAK2-V617F–positive myeloproliferative neoplasms (MPNs) by targeting long-term hematopoietic stem cells (LT-HSCs). Additional somatic mutations in genes regulating LT-HSC self-renewal, such as DNMT3A, have been reported to have poorer responses to pegIFN-α. We investigated whether DNMT3A loss leads to alterations in JAK2-V617F LT-HSC functions conferring resistance to pegIFN-α treatment in a mouse model of MPN and in hematopoietic progenitors from patients with MPN. Long-term treatment with pegIFN-α normalized blood parameters and reduced splenomegaly and JAK2-V617F chimerism in single-mutant JAK2-V617F (VF) mice. However, pegIFN-α in VF;Dnmt3aΔ/Δ (VF;DmΔ/Δ) mice worsened splenomegaly and failed to reduce JAK2-V617F chimerism. Furthermore, LT-HSCs from VF;DmΔ/Δ mice compared with VF were less prone to accumulate DNA damage and exit dormancy upon pegIFN-α treatment. RNA sequencing showed that IFN-α induced stronger upregulation of inflammatory pathways in LT-HSCs from VF;DmΔ/Δ than from VF mice, indicating that the resistance of VF;DmΔ/Δ LT-HSC was not due to failure in IFN-α signaling. Transplantations of bone marrow from pegIFN-α–treated VF;DmΔ/Δ mice gave rise to more aggressive disease in secondary and tertiary recipients. Liquid cultures of hematopoietic progenitors from patients with MPN with JAK2-V617F and DNMT3A mutation showed increased percentages of JAK2-V617F–positive colonies upon IFN-α exposure, whereas in patients with JAK2-V617F alone, the percentages of JAK2-V617F–positive colonies decreased or remained unchanged. PegIFN-α combined with 5-azacytidine only partially overcame resistance in VF;DmΔ/Δ mice. However, this combination strongly decreased the JAK2-mutant allele burden in mice carrying VF mutation only, showing potential to inflict substantial damage preferentially to the JAK2-mutant clone.
Introduction
JAK2-V617F alone or together with additional somatic mutations is found in the majority of patients with myeloproliferative neoplasm (MPN).1 The presence of additional mutations correlates with worse outcome,2,3 and "high molecular risk" mutations with a strong negative impact on outcome have been identified.4 Although mutations in DNMT3A are relatively frequent in patients with MPN (∼5%-6%),5 and their frequencies are increased in patients with MPN who progress to acute myeloid leukemia (∼16%),6 it remains controversial whether they should also be considered as high molecular risk. DNMT3A is the most frequently mutated gene in individuals with clonal hematopoiesis of indetermined potential (CHIP),7-9 and CHIP is associated with increased risk of hematological malignancies.10-12DNMT3A mutations frequently occur in the methyltransferase domain around residue R882, resulting in loss of activity with dominant-negative effect over wild-type (WT) DNMT3A.13DNMT3A mutations lead to focal hypomethylation and loss of epigenetic silencing of self-renewal genes in long-term hematopoietic stem cells (LT-HSCs),14 thereby increasing the stemness and self-renewal of LT-HSCs.15-17 Patients with MPN responded to interferon alfa (IFN-α), in some cases with a substantial reduction in JAK2-V617F allelic burden.18,19 In mouse models of MPN, IFN-α preferentially targets Jak2-V617F–mutant LT-HSCs,20,21 involving mechanisms of cell cycle activation, reactive oxygen species (ROS) induction, and accumulation of DNA damage.22 Here, we examined how loss of Dnmt3a protects the JAK2-mutant clone from the effects of IFN-α in a JAK2-V617F mouse model and in primary hematopoietic cells from patients with MPN.
Materials and methods
Mice
Conditional JAK2-V617F transgenic "flip-flop" mice,23Dnmt3a floxed knockout mice,24 and UBC-GFP reporter mice25 were intercrossed with tamoxifen–inducible SclCreER mice.26 CreER enzymatic activity was induced by intraperitoneal injection of 2 mg tamoxifen (Sigma Aldrich) for 5 consecutive days, repeated for 4 consecutive weeks. All mice used in this study had pure C57BL/6N background and were maintained under specific pathogen-free conditions in accordance with Swiss Federal regulations. All animal experiments were approved by the Cantonal Veterinary Office of Basel-Stadt, Switzerland.
Production of pegylated mouse IFN-α
Mouse IFN-α was purified from culture supernatants of the NS0 mouse myeloma cell line stably transfected with a complementary DNA encoding mouse IFN-α4.27 The cells were switched to serum-free media, and supernatants were collected after 5 days. Details are provided in supplemental Methods, available on the Blood website.
Patients with MPN
Blood samples from patients with MPN were collected (supplemental Table 1), and diagnosis was established according to the World Health Organization criteria.28 The culture of CD34+ cells from the peripheral blood of patients with MPN and assessment of responses to IFN-α are described in detail in the supplemental Methods.
Blood samples and clinical data of patients with MPN were collected at the University Hospital Basel, Basel, Switzerland. The study was approved by the local ethics committee (Ethik Kommission Beider Basel) and written informed consent was obtained from all patients in accordance with the Declaration of Helsinki.
Results
Phenotypic characterization of VF and VF;DmΔ/Δ mice
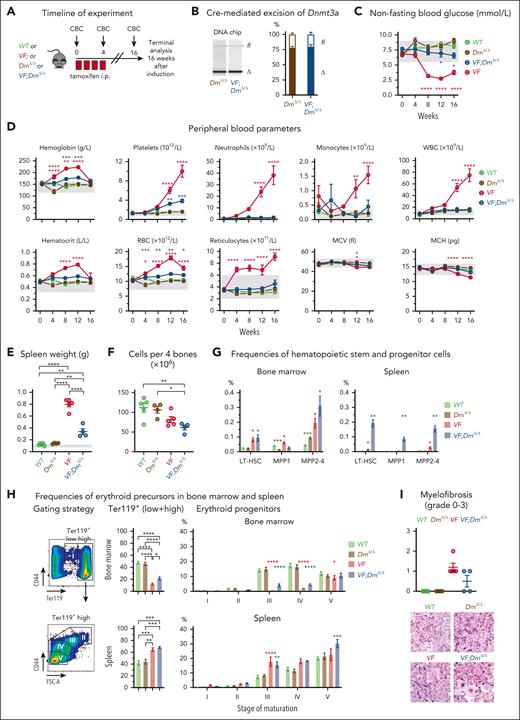
We compared the phenotypes of SclCre;FF1 (VF) mice with SclCre;FF1;Dnmt3aΔ/Δ (VF;DmΔ/Δ) mice after tamoxifen induction (Figure 1). The efficiency of Cre-mediated deletion of the conditional Dnmt3afl/fl alleles was determined by quantitative polymerase chain reaction (Figure 1B; supplemental Figure 1). VF mice developed polycythemia vera (PV) phenotype with increased blood counts and hypoglycemia, whereas VF;DmΔ/Δ mice displayed a reduction in red cell parameters and platelet counts, combined with a normalization of white blood cell counts and blood glucose (Figure 1C-D). Blood counts and glucose levels were unchanged in DmΔ/Δ mice compared with WT mice. Splenomegaly at 16 weeks was more pronounced in VF mice than in VF;DmΔ/Δ mice, whereas spleen weight remained normal in DmΔ/Δ mice (Figure 1E). Bone marrow (BM) cellularity was decreased in VF;DmΔ/Δ compared with WT mice (Figure 1F). An increase in LT-HSCs and early progenitors was noted in BM and spleen of VF and VF;DmΔ/Δ mice, with the most pronounced increase in the spleen of VF;DmΔ/Δ mice (Figure 1G). Ter119-positive erythroid cells were decreased in the BM but increased in the spleen of VF and VF;DmΔ/Δ mice, mainly reflecting the alterations in erythroid subpopulations 3 and 4 (Figure 1H). At 16 weeks, VF mice displayed slightly higher grades of reticulin fibrosis than VF;DmΔ/Δ mice (Figure 1I). VF mice heterozygous for the Dnmt3a mutation (VF;DmΔ/+) showed blood counts similar to VF;DmΔ/Δ mice (supplemental Figure 2), indicating that complete loss of Dnmt3a is not necessary to alter the VF phenotype.
Disease phenotype characterization of JAK2-V617F (VF) and JAK2-V617F;Dnmt3aΔ/Δ (VF;DmΔ/Δ) mice. (A) Schematic drawing of induction with tamoxifen injections for 4 weeks (red box) and experimental procedures. (B) Analysis of Cre-mediated excision of Dnmt3a. Left panel shows representative gel from Bioanalyzer DNA chip, with bands corresponding to floxed (fl) and deleted (Δ) Dnmt3a alleles. Right panel shows quantification of fl and Δ Dnmt3a alleles (n = 4 per genotype). (C) Time course of nonfasting blood glucose levels (n = 5-7 mice per genotype). (D) Time course of peripheral blood counts (n = 5-7 mice per genotype). (E) Spleen weight at terminal workup after 16 weeks postinduction. (F) BM cellularity per 4 bones (n = 4-5 mice per genotype). (G) Frequencies of HSPCs in BM and spleen at terminal workup after 16 weeks of treatment (n = 4-5 mice per genotype). (H) Analysis of erythroid progenitor’s frequencies in BM and spleen at terminal analysis. (I) Quantification BM fibrosis and osteosclerosis (n = 4-5 mice per genotype). The degree of myelofibrosis was scored and assigned on a scale from MF-0 to MF-3. Osteosclerosis was scored as present or absent. All data are presented as mean ± standard error of the mean. Two-way analyses of variance (ANOVA) with subsequent Tukey (B-C) and Dunnett posttest (G; erythroid progenitors), 1-way ANOVA with subsequent Tukey posttest (D,E,G; Ter119+ cells, H) or unpaired t test with Welch correction (F) were used. ∗P < .05; ∗∗P < .01; ∗∗∗P < .001; ∗∗∗∗P < .0001.
Disease phenotype characterization of JAK2-V617F (VF) and JAK2-V617F;Dnmt3aΔ/Δ (VF;DmΔ/Δ) mice. (A) Schematic drawing of induction with tamoxifen injections for 4 weeks (red box) and experimental procedures. (B) Analysis of Cre-mediated excision of Dnmt3a. Left panel shows representative gel from Bioanalyzer DNA chip, with bands corresponding to floxed (fl) and deleted (Δ) Dnmt3a alleles. Right panel shows quantification of fl and Δ Dnmt3a alleles (n = 4 per genotype). (C) Time course of nonfasting blood glucose levels (n = 5-7 mice per genotype). (D) Time course of peripheral blood counts (n = 5-7 mice per genotype). (E) Spleen weight at terminal workup after 16 weeks postinduction. (F) BM cellularity per 4 bones (n = 4-5 mice per genotype). (G) Frequencies of HSPCs in BM and spleen at terminal workup after 16 weeks of treatment (n = 4-5 mice per genotype). (H) Analysis of erythroid progenitor’s frequencies in BM and spleen at terminal analysis. (I) Quantification BM fibrosis and osteosclerosis (n = 4-5 mice per genotype). The degree of myelofibrosis was scored and assigned on a scale from MF-0 to MF-3. Osteosclerosis was scored as present or absent. All data are presented as mean ± standard error of the mean. Two-way analyses of variance (ANOVA) with subsequent Tukey (B-C) and Dunnett posttest (G; erythroid progenitors), 1-way ANOVA with subsequent Tukey posttest (D,E,G; Ter119+ cells, H) or unpaired t test with Welch correction (F) were used. ∗P < .05; ∗∗P < .01; ∗∗∗P < .001; ∗∗∗∗P < .0001.
Responsiveness of VF and VF;DmΔ/Δ hematopoiesis to IFN-α
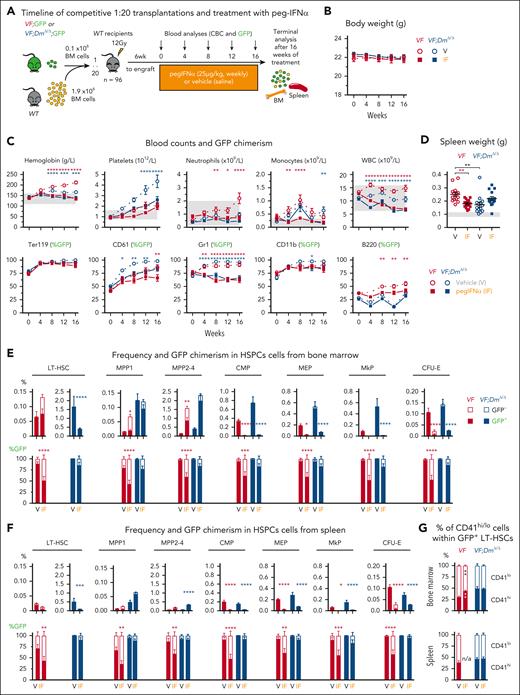
To study the effects of IFN-α on MPN in VF and VF;DmΔ/Δ mice, we produced pegylated IFN-α (pegIFN-α) from a cell line stably transfected with a complementary DNA encoding mouse IFN-α4.27 The purified IFN-α4 protein was pegylated to facilitate long-term treatment of mice (supplemental Figure 3). A pilot study was performed to determine the best pegIFN-α dosing and setup of the competitive BM transplantation (supplemental Figure 4). The initial pegIFN-α dose of 100 μg/kg per week had to be reduced after 6 weeks, and the 2 maintenance doses (25 μg/kg and 50 μg/kg per week) yielded similar results after additional 12 weeks of treatment. The decrease of green fluorescent protein (GFP) chimerism in the 1:1 competitive transplantation was less pronounced compared with 1:20 or 1:100 transplantations, and we selected the 1:20 ratio and 25 μg/kg per week pegIFN-α subcutaneously for further studies. The time course of IFN-α concentration in plasma after a single injection is shown in supplemental Figure 3D. Treatment with pegIFN-α for 16 weeks was well tolerated, normalized blood counts, and decreased GFP chimerism in most peripheral blood lineages of both VF and VF;DmΔ/Δ mice (Figure 2; supplemental Figure 5A). Spleen weight was reduced by pegIFN-α in recipients of VF BM but showed a trend toward higher values in double-mutant VF;DmΔ/Δ mice than vehicle controls (Figure 2D).
Differential effects of pegylated IFN-α on hematopoiesis in JAK2-V617F (VF) and JAK2-V617F;Dnmt3aΔ/Δ (VF;DmΔ/Δ) mice. (A) Schematic drawing of the experimental setup for BM transplantations and treatment with pegIFN-α. (B) Time course of body weight (n = 24 mice per group). (C) Time course of blood counts and GFP chimerism of recipient mice (n = 24 mice per group). (D) Spleen weight at terminal workup after 16 weeks of treatment. (E) Frequency and GFP chimerism of VF;GFP or VF;DmΔ/Δ;GFP HSPCs in BM at terminal workup after 16 weeks of treatment (n = 15 mice per group). (F) Frequency and GFP chimerism of VF;GFP or VF;DmΔ/Δ;GFP HSPCs in spleen at terminal workup after 16 weeks of treatment (n = 15 mice per group). (G) Analysis of the proportions of CD41hi and CD41lo subpopulations within the mutant (GFP-positive) LT-HSCs. All data are presented as mean ± standard error of the mean. ANOVA with subsequent Tukey (C,E,F,G) posttest or 1-way ANOVA with subsequent Tukey (D) posttest were used. ∗P < .05; ∗∗P < .01; ∗∗∗P < .001; ∗∗∗∗P < .0001. CBC, complete blood count.
Differential effects of pegylated IFN-α on hematopoiesis in JAK2-V617F (VF) and JAK2-V617F;Dnmt3aΔ/Δ (VF;DmΔ/Δ) mice. (A) Schematic drawing of the experimental setup for BM transplantations and treatment with pegIFN-α. (B) Time course of body weight (n = 24 mice per group). (C) Time course of blood counts and GFP chimerism of recipient mice (n = 24 mice per group). (D) Spleen weight at terminal workup after 16 weeks of treatment. (E) Frequency and GFP chimerism of VF;GFP or VF;DmΔ/Δ;GFP HSPCs in BM at terminal workup after 16 weeks of treatment (n = 15 mice per group). (F) Frequency and GFP chimerism of VF;GFP or VF;DmΔ/Δ;GFP HSPCs in spleen at terminal workup after 16 weeks of treatment (n = 15 mice per group). (G) Analysis of the proportions of CD41hi and CD41lo subpopulations within the mutant (GFP-positive) LT-HSCs. All data are presented as mean ± standard error of the mean. ANOVA with subsequent Tukey (C,E,F,G) posttest or 1-way ANOVA with subsequent Tukey (D) posttest were used. ∗P < .05; ∗∗P < .01; ∗∗∗P < .001; ∗∗∗∗P < .0001. CBC, complete blood count.
In BM of VF mice, pegIFN-α increased the frequencies of LT-HSCs and multipotent progenitors by increasing the numbers and percentages of GFP-negative (WT) cells, while decreasing GFP-positive (JAK2-mutant) cells in all progenitor compartments (Figure 2E). In the spleen of VF mice, the overall frequencies of hematopoietic stem and progenitor cells (HSPCs) were lower, but the same responses to pegIFN-α were observed (Figure 2F). In VF;DmΔ/Δ mice, the overall frequencies of HSPCs decreased upon pegIFN-α treatment, but no significant decrease in the percentages of GFP-positive (JAK2-mutant) cells was noted. The same behavior was observed in erythroid precursors (supplemental Figure 5C). The proportion of CD41hi vs CD41lo subsets of LT-HSCs within the GFP-positive (JAK2-mutant) cells increased in VF mice that received transplantation, as previously reported.29VF;DmΔ/Δ mice showed increased proportion of CD41hi LT-HSCs already at baseline but no increase upon pegIFN-α treatment (Figure 2G), correlating with the resistance of the double-mutant HSCs to IFN-α. Treatment with pegIFN-α normalized the histopathology of BM and spleen of VF recipients and reduced myelofibrosis and osteosclerosis, whereas VF;DmΔ/Δ double-mutant mice were largely resistant to these beneficial effects of pegIFN-α (supplemental Figure 6).
VF and VF;DmΔ/Δ mice showed differences in the accumulation of DNA damage and ROS in response to pegIFN-α
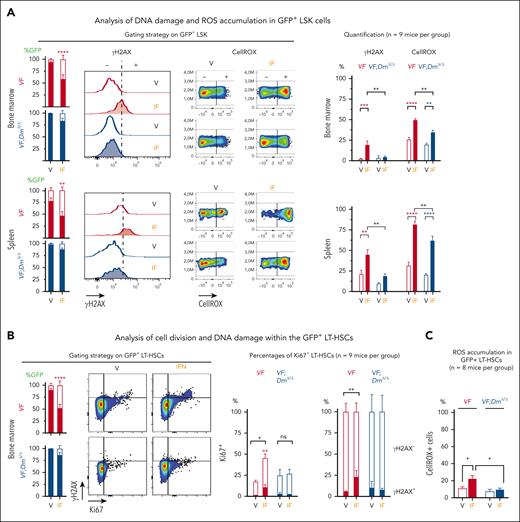
PegIFN-α was previously shown to preferentially affect JAK2-V617F mutant HSCs by inducing accumulation of DNA damage during replicative stress.22 Double-stranded DNA breaks trigger rapid phosphorylation of Ser139 on histone H2AX by PI3K-like kinases, including ataxia telangiectasia mutated (ATM), ataxia telangiectasia and Rad3-related protein (ATR), and DNA-dependent protein kinase (DNA-PK), as an early step in the DNA damage response.30 Phosphorylated H2AX (γH2AX) can be detected by phospho–specific antibodies to quantify DNA damage. We found that pegIFN-α induced phosphorylation of H2AX on Ser139, in GFP-positive lin–/Sca1+/Kit+ (LSK) cells of VF recipient mice, but it was largely unable to do so in GFP-positive LSKs from VF;DmΔ/Δ recipients (Figure 3A). PegIFN-α also increased the production of ROS in LSK cells from VF mice (Figure 3A) and, to a lesser extent, also in LSK cells from VF;DmΔ/Δ mice. Similar results were also obtained in LT-HSCs (Figure 3C). ROS was previously reported to induce functional attrition of HSCs in WT mice.31,32 In GFP-positive LT-HSCs from VF mice, treatment with pegIFN-α induced exit from quiescence, monitored by the marker Ki67, and an increase in DNA damage within Ki76-positive LT-HSC, monitored by the marker γH2AX. In contrast, GFP-positive LT-HSCs from double-mutant VF;DmΔ/Δ mice showed no increase in cell cycle entry or DNA damage (Figure 3B). These data show that JAK2-mutant LT-HSCs from VF;DmΔ/Δ mice were protected against pegIFN-α–induced loss of quiescence, increased DNA damage, and ROS production.
Effects of IFN-α treatment on accumulation of DNA damage and ROS and on cell division in HSPCs. (A) Accumulation of ROS and presence of γH2AX in lin–/Sca1+/Kit+ (LSK) cells from BM and spleen of recipient mice. GFP chimerism in LSK cells, gating strategy, and detection of DNA damage by anti-γH2AX antibody and ROS by staining with CellRox (left). Quantification of γH2AX and ROS in 9 mice per group (right). (B) Analysis of cell division (Ki67-positive cells) and DNA damage within the mutant (GFP-positive) LT-HSCs; LT-HSC chimerism and gating strategy (left); and the results obtained from 9 mice per group (right). (C) Analysis of ROS levels in GFP-positive LT-HSCs. These data were obtained from mice described in supplemental Figure 13. All data are presented as mean ± standard error of the mean. ANOVA with subsequent Tukey posttest was used. ∗∗P < .01; ∗∗∗P < .001; ∗∗∗∗P < .0001.
Effects of IFN-α treatment on accumulation of DNA damage and ROS and on cell division in HSPCs. (A) Accumulation of ROS and presence of γH2AX in lin–/Sca1+/Kit+ (LSK) cells from BM and spleen of recipient mice. GFP chimerism in LSK cells, gating strategy, and detection of DNA damage by anti-γH2AX antibody and ROS by staining with CellRox (left). Quantification of γH2AX and ROS in 9 mice per group (right). (B) Analysis of cell division (Ki67-positive cells) and DNA damage within the mutant (GFP-positive) LT-HSCs; LT-HSC chimerism and gating strategy (left); and the results obtained from 9 mice per group (right). (C) Analysis of ROS levels in GFP-positive LT-HSCs. These data were obtained from mice described in supplemental Figure 13. All data are presented as mean ± standard error of the mean. ANOVA with subsequent Tukey posttest was used. ∗∗P < .01; ∗∗∗P < .001; ∗∗∗∗P < .0001.
Functional analysis of the stem cell and progenitor compartment
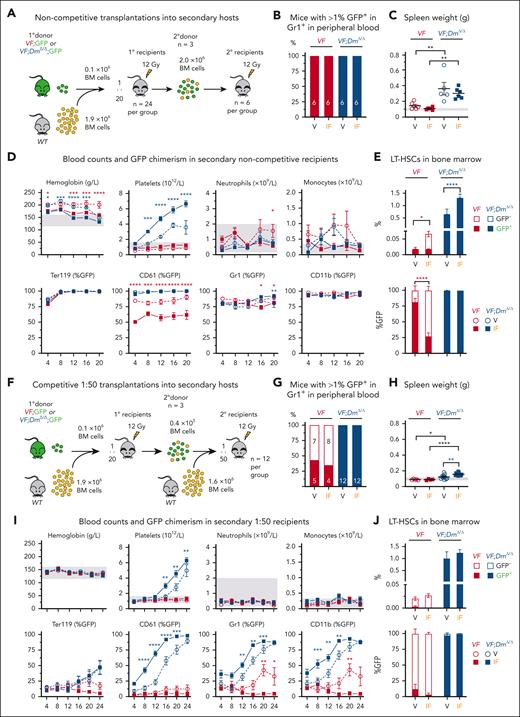
To assess the effects of pegIFN-α treatment on the functional fitness of LT-HSCs, we performed secondary and tertiary transplantations (Figure 4; supplemental Figures 7-9). As donors, we pooled BM cells from 3 primary recipients from the pegIFN-α or from 3 vehicle-treated recipients (supplemental Figure 7). Using these BM cells, we performed competitive and noncompetitive transplantations into secondary recipients (Figure 4; supplemental Figure 8). In transplantations without competitor cells (Figure 4A-E), engraftment, defined as >1% GFP chimerism in Gr1+ cells in peripheral blood, was observed in all recipients. Spleen weights at 20 weeks were higher in recipients of BM from VF;DmΔ/Δ double-mutant mice than recipients of VF BM, but no differences were noted between the treatment groups (Figure 4C). Secondary recipients of BM from pegIFN-α–treated VF donors displayed lower hemoglobin values and lower GFP chimerism in platelets as well as decreased frequencies of GFP-positive (JAK2-mutant) LT-HSCs in BM than recipients of BM from vehicle–treated VF donors (Figure 4D-E). In contrast, secondary recipients of BM from double-mutant VF;DmΔ/Δ mice treated with pegIFN-α displayed higher platelet counts than recipients of vehicle–treated VF;DmΔ/Δ BM, and GFP chimerism was very high in all peripheral blood lineages (Figure 4D). The frequencies of LT-HSCs in BM of pegIFN-α–treated VF;DmΔ/Δ mice were greatly increased and consisted exclusively of GFP-positive LT-HSCs (Figure 4E).
Transplantations of BM cells from primary recipients into secondary recipients. (A) Schematic drawing of the experimental setup for noncompetitive BM transplantations into secondary recipient mice (n = 6 mice per group). (B) Percentages of mice that showed engraftment defined as >1% GFP chimerism in Gr1+ cells in peripheral blood at 20 weeks after transplantation. (C) Spleen weight at terminal workup 20 weeks after transplantation. (D) Time course of blood counts and GFP chimerism in secondary recipients. (E) GFP chimerism in LT-HSCs at terminal workup 20 weeks after transplantation. (F) Schematic drawing of the experimental setup for competitive BM transplantations into secondary recipients at 1:50 dilution (n = 12 mice per group). (G-J) Same annotations as in panels B-E. ANOVA with subsequent Tukey (D,I) posttest or 1-way ANOVA with subsequent Tukey (E, H) posttest were used. ∗P < .05; ∗∗P < .01; ∗∗∗P < .001; ∗∗∗∗P < .0001.
Transplantations of BM cells from primary recipients into secondary recipients. (A) Schematic drawing of the experimental setup for noncompetitive BM transplantations into secondary recipient mice (n = 6 mice per group). (B) Percentages of mice that showed engraftment defined as >1% GFP chimerism in Gr1+ cells in peripheral blood at 20 weeks after transplantation. (C) Spleen weight at terminal workup 20 weeks after transplantation. (D) Time course of blood counts and GFP chimerism in secondary recipients. (E) GFP chimerism in LT-HSCs at terminal workup 20 weeks after transplantation. (F) Schematic drawing of the experimental setup for competitive BM transplantations into secondary recipients at 1:50 dilution (n = 12 mice per group). (G-J) Same annotations as in panels B-E. ANOVA with subsequent Tukey (D,I) posttest or 1-way ANOVA with subsequent Tukey (E, H) posttest were used. ∗P < .05; ∗∗P < .01; ∗∗∗P < .001; ∗∗∗∗P < .0001.
In competitive transplantations at 1:50 ratio (Figure 4F), only about 50% of recipients of VF BM showed engraftment (>1% GFP chimerism in peripheral blood of Gr1+ cells), and none of the recipients of vehicle–treated or pegIFN-α–treated BM developed MPN phenotype (Figure 4H-I). Nevertheless, pegIFN-α–treated recipients showed a trend toward lower GFP chimerism in peripheral blood. In contrast, all secondary recipients of BM from double-mutant VF;DmΔ/Δ donor mice treated with pegIFN-α showed engraftment and displayed increased spleen weight (Figure 4H) as well as higher platelet counts and higher chimerism in CD61, Gr1, and CD11b–positive peripheral blood cells than vehicle-treated group (Figure 4I). The frequencies of phenotypic LT-HSCs in recipients of VF;DmΔ/Δ BM were expanded about 10-fold and composed almost exclusively of GFP-positive cells, whereas LT-HSCs in recipients of VF BM were almost exclusively GFP-negative, and pegIFN-α treatment had no effect (Figure 4J).
Competitive transplantations into secondary recipients at 1:250 dilutions showed the same trend toward faster rise of the GFP chimerism in recipients of BM from pegIFN-α–treated donors (supplemental Figure 8), but the differences to vehicle-treated donors were smaller than those of the 1:50 transplantations. We calculated the frequencies of functional LT-HSCs from the competitive transplantation experiments at different dilutions using the extreme limiting dilution analysis method.33VF;DmΔ/Δ mice displayed ∼10 times higher frequencies of functional LT-HSCs than VF mice and no differences between IFN-α–treated mice vs vehicle were observed (supplemental Figure 8E). Thus, competitive transplantations at 1:250 with 8000 BM cells from VF donors were limiting, but 8000 BM cells from VF;DmΔ/Δ donors still contained ∼8 LT-HSCs per transplantation.
We also transplanted BM into tertiary recipients (supplemental Figure 9A) and found that fewer recipients showed engraftment when pegIFN-α–treated BM cells from VF mice were used than vehicle–treated VF BM (supplemental Figure 9B), Recipients the of VF BM that engrafted were unable to sustain long-term GFP chimerism and develop MPN phenotype (supplemental Figure 9C). In contrast, all recipients of VF;DmΔ/Δ BM cells showed engraftment and displayed MPN phenotype with high GFP chimerism in peripheral blood and in BM LT-HSCs (supplemental Figure 9B-E). Again, when pegIFN-α–treated BM cells from VF;DmΔ/Δ mice were used, the tertiary recipients showed higher platelet, neutrophil, and monocyte counts than that of vehicle-treated BM and developed anemia.
Together, these results illustrate the increased competitiveness of double-mutant VF;DmΔ/Δ BM compared with VF BM in secondary and tertiary transplantations and the reversal of the inhibitory effects of pegIFN-α on VF BM cells into stimulatory effects on VF;DmΔ/Δ BM cells.
Effects of IFN-α treatment on human progenitor and stem cells from patients with MPN carrying mutations in JAK2-V617F and DNMT3A in vitro
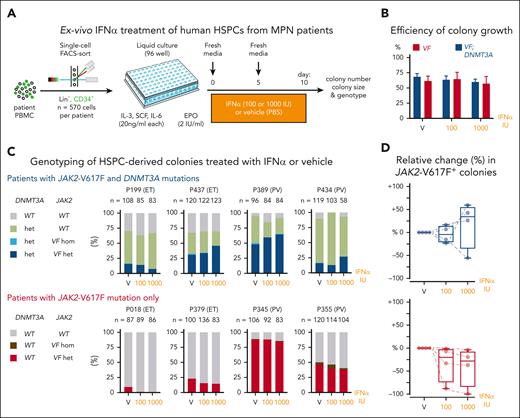
To assess the effects of IFN-α on human hematopoietic cells carrying JAK2-V617F alone or in combination with mutations in DNMT3A, we performed single-cell liquid cultures of CD34+/Lin– peripheral blood cells from patients with MPN and exposed them to human IFN-α or vehicle during 10 days of culture (Figure 5A). Material from 4 patients who carried both JAK2-V617F and DNMT3A mutations in the same clone was available (supplemental Figure 10). In 3 of these patients, no other gene mutation was detectable using a targeted next generation sequencing panel covering 86 genes,2 whereas 1 patient (P434) had an additional TET2 mutation (supplemental Figure 10). In all 4 patients, the DNMT3A mutation preceded the acquisition of JAK2-V617F. As a control, we selected 4 patients who carried solely the JAK2-V617F mutation and were matched for age, disease subtype, and JAK2-V617F allele burden in granulocytes from peripheral blood (supplemental Figure 10). Growth efficiency, defined as the percentage of wells that yielded colonies, was in the range of 70% for all conditions tested (Figure 5B). The percentages of JAK2-V617F–positive colonies increased upon IFN-α exposure in 3 of the 4 patients with MPN who carried both JAK2-V617F and DNMT3A mutations, whereas the percentages of JAK2-V617F–positive colonies decreased or remained unchanged in patients carrying solely JAK2-V617F (Figure 5C-D). Overall, the responses of the primary human HSPCs from patients with MPN to IFN-α are in line with the results obtained in our MPN mouse models.
Effects of IFN-α on HSPCs from patients with MPN carrying JAK2-V617F and DNMT3A mutations. (A) Experimental setup for liquid cultures of single-cell FACS sorted HSPCs. (B) Growth efficiency of single-cell sorted HSPCs expressed as the percentages of wells in which colonies grew. (C) Genotyping of HSPC–derived colonies treated with IFN-α or vehicle. Stacked bars represent the percentages of colonies for each of the genotypes. Numbers above the bars indicate the numbers of colonies analyzed. (D) Relative change (%) in the numbers of JAK2-V617F-positive colonies. ANOVA with subsequent Sidak (D) posttest were used. FACS, fluorescence-activated cell sorting.
Effects of IFN-α on HSPCs from patients with MPN carrying JAK2-V617F and DNMT3A mutations. (A) Experimental setup for liquid cultures of single-cell FACS sorted HSPCs. (B) Growth efficiency of single-cell sorted HSPCs expressed as the percentages of wells in which colonies grew. (C) Genotyping of HSPC–derived colonies treated with IFN-α or vehicle. Stacked bars represent the percentages of colonies for each of the genotypes. Numbers above the bars indicate the numbers of colonies analyzed. (D) Relative change (%) in the numbers of JAK2-V617F-positive colonies. ANOVA with subsequent Sidak (D) posttest were used. FACS, fluorescence-activated cell sorting.
Treatment with pegIFN-α induces stronger response in VF;DmΔ/Δ LT-HSCs in vivo
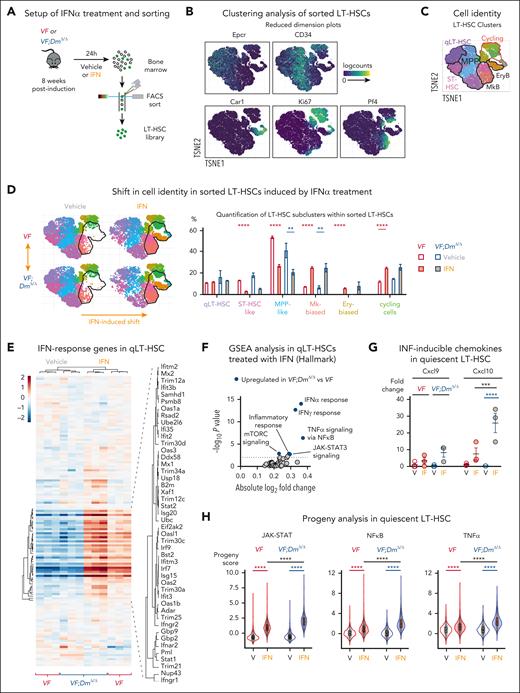
To analyze whether VF and VF;DmΔ/Δ LT-HSCs respond differentially to IFN-α, we injected VF and VF;DmΔ/Δ mice with a single dose of nonpegylated IFN-α (25 μg/kg) or vehicle and sorted phenotypic LT-HSCs after 24 hours for single-cell RNA sequencing (RNAseq) (Figure 6A). Unsupervised clustering of sorted cells identified 9 clusters, which were grouped into 6 different cell populations based on lineage-specific gene expression patterns (Figure 6B-C; supplemental Figure 11).34 We observed a shift toward more differentiated clusters upon treatment with IFN-α in both genotypes (Figure 6D). We then focused on expression changes in the most naive cluster of quiescent LT-HSCs (Figure 6E-H). Expression of genes involved in IFN response was significantly elevated in quiescent LT-HSCs from VF;DmΔ/Δ mice compared with VF mice (Figure 6E-F). Furthermore, analysis of chemokines (Cxcl9 and Cxcl10), previously shown to be directly induced by IFN signaling,35-37 showed significantly higher expression only in VF;DmΔ/Δ quiescent LT-HSCs (Figure 6G). In line with these results, the analysis of activities of several signaling pathways in each single cell using the PROGENy (Pathway RespOnsive GENes for activity inference) tool showed increased Jak-Stat, NF-κB, and tumor necrosis factor-α signaling in quiescent LT-HSCs from VF;DmΔ/Δ mice compared with VF mice treated with IFN-α (Figure 6H), indicating more robust response to IFN in double-mutant quiescent LT-HSCs.
Differential effects of IFN-α treatment on VF and VF;DmΔ/Δ LT-HSCs. (A) Experimental setup for single-cell RNA seq of FACS sorted LT-HSCs. (B) Expression of selected lineage and cycling genes in reduced dimension plots. TSNE, t-distributed stochastic neighbor embedding. (C) Clustering of cells is based on the gene expression in reduced dimension plot (D) Shifts in cell identity induced by IFN-α treatment in reduced dimension plots (left); and the relative cell abundance per cell type across genotypes and treatments (right). (E) Heat map analysis of IFN response genes expression (Reactome R-MMU-91353) in quiescent LT-HSCs. Normalized expression of genes in pseudobulk samples was plotted. (F) Gene set enrichment analysis of Hallmark gene sets comparing IFN-α–treated VF and VF;DmΔ/Δ quiescent LT-HSCs (qLT-HSCs). (G) Fold change in the normalized expression of Cxcl9 and Cxcl10 genes derived from number of reads (counts per million) in pseudobulk analysis. Expression in vehicle–treated VF cells was set to 1. (H) PROGENy analysis in quiescent LT-HSCs. ANOVA with subsequent Tukey posttest was used. ∗∗P < .01; ∗∗∗P < .001; ∗∗∗∗P < .0001. FACS, fluorescence-activated cell sorting.
Differential effects of IFN-α treatment on VF and VF;DmΔ/Δ LT-HSCs. (A) Experimental setup for single-cell RNA seq of FACS sorted LT-HSCs. (B) Expression of selected lineage and cycling genes in reduced dimension plots. TSNE, t-distributed stochastic neighbor embedding. (C) Clustering of cells is based on the gene expression in reduced dimension plot (D) Shifts in cell identity induced by IFN-α treatment in reduced dimension plots (left); and the relative cell abundance per cell type across genotypes and treatments (right). (E) Heat map analysis of IFN response genes expression (Reactome R-MMU-91353) in quiescent LT-HSCs. Normalized expression of genes in pseudobulk samples was plotted. (F) Gene set enrichment analysis of Hallmark gene sets comparing IFN-α–treated VF and VF;DmΔ/Δ quiescent LT-HSCs (qLT-HSCs). (G) Fold change in the normalized expression of Cxcl9 and Cxcl10 genes derived from number of reads (counts per million) in pseudobulk analysis. Expression in vehicle–treated VF cells was set to 1. (H) PROGENy analysis in quiescent LT-HSCs. ANOVA with subsequent Tukey posttest was used. ∗∗P < .01; ∗∗∗P < .001; ∗∗∗∗P < .0001. FACS, fluorescence-activated cell sorting.
VF;DmΔ/Δ mice showed improved response to a combination of pegIFN-α with Aza
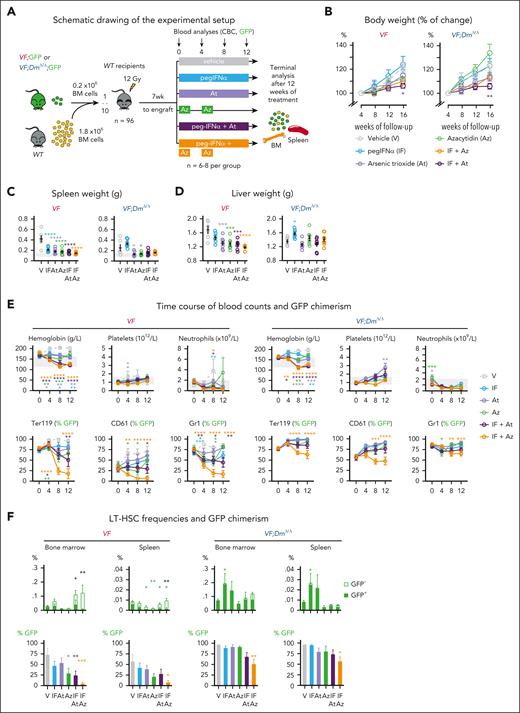
We examined whether the resistance of double-mutant VF;DmΔ/Δ mice to pegIFN-α can be overcome by addition of either arsenic trioxide (At), which was shown to potentiate IFN-α–induced growth suppression of JAK2-V617F hematopoietic progenitors,38 or 5-azacytidine (Aza) that interferes with DNA methylation of cytidine39 and showed increased cytotoxicity in the presence of Dnmt3a mutations.40,41 To test the effects of the treatments in vivo, we generated cohorts of mice using competitive transplantations of BM cells from VF or VF;DmΔ/Δ mice that express a GFP reporter gene mixed with a 10-fold excess of BM cells from a WT mouse and into lethally irradiated WT recipient mice (Figure 7A). After 7 weeks, recipient mice were randomized into 6 treatment groups and were treated for 12 weeks either with pegIFNα (25 μg/kg; subcutaneously once per week), At (5 mg/kg; intraperitoneally every second day), or Aza (2 mg/kg; intraperitoneally daily) for 2 weeks followed by a break of 2 weeks (Figure 7A). In addition, we tested the combinations of pegIFN-α + At and pegIFN-α + Az. No significant changes in body weight were observed compared with the vehicle-treated group, except in mice treated with pegIFN-α + At (Figure 7B). Spleen and liver weight was decreased in all treatment groups and genotypes (Figure 7C-D), except in VF;Dnmt3aΔ/Δ mice treated with pegIFN-α alone, which showed a trend toward increased spleen and liver weights. Blood counts were normalized in all treatment groups (Figure 7E). The combinations of pegIFN-α + At and pegIFN-α + Aza also induced pronounced decrease in GFP chimerism in peripheral blood lineages of VF mice, whereas VF;Dnmt3aΔ/Δ mice were largely resistant and only the combination of pegIFN-α + Aza was effective in reducing the GFP chimerism (Figure 7E). The frequencies of LT-HSCs and their GFP chimerism in BM and spleen are shown in Figure 7F. In VF mice, treatment arms that contained pegIFN-α increased the overall frequencies of LT-HSCs primarily by increasing the proportion of GFP-negative (JAK2-WT) cells. The strongest reduction in GFP chimerism was observed in VF mice treated with a combination of pegIFN-α + Aza (Figure 7F). LT-HSC from VF;DmΔ/Δ mice were largely resistant and showed reduction in GFP chimerism only when treated with a combination of pegIFN-α + Aza (Figure 7F).
Treatment with combination of Aza or At with pegIFN-α. (A) Schematic drawing of the experimental setup for BM transplantations and treatment. (B) Time course of changes in body weight (%); n = 6-8 per group. (C) Spleen weight at terminal workup after 12 weeks of treatment (n = 5-8 mice per group). (D) Liver weight at terminal workup (n = 5-8 mice per group). (E) Time course of blood counts and GFP chimerism of recipient mice (n = 6-8 mice per group). (F) Frequencies and GFP chimerism of HSCs (LT-HSCs) in BM and spleen at terminal workup after 12 weeks of treatment (n = 5-8 mice per group). ANOVA with subsequent Tukey posttest was used. ∗P < .05; ∗∗P < .01; ∗∗∗P < .001; ∗∗∗∗P < .0001.
Treatment with combination of Aza or At with pegIFN-α. (A) Schematic drawing of the experimental setup for BM transplantations and treatment. (B) Time course of changes in body weight (%); n = 6-8 per group. (C) Spleen weight at terminal workup after 12 weeks of treatment (n = 5-8 mice per group). (D) Liver weight at terminal workup (n = 5-8 mice per group). (E) Time course of blood counts and GFP chimerism of recipient mice (n = 6-8 mice per group). (F) Frequencies and GFP chimerism of HSCs (LT-HSCs) in BM and spleen at terminal workup after 12 weeks of treatment (n = 5-8 mice per group). ANOVA with subsequent Tukey posttest was used. ∗P < .05; ∗∗P < .01; ∗∗∗P < .001; ∗∗∗∗P < .0001.
To test the effects of the different treatments on the capacity of LT-HSCs to remain functional and maintain MPN, we performed noncompetitive transplantations into secondary recipients using BM cells harvested and pooled from 3 mice per group at the end of the treatments (supplemental Figure 12A). BM from VF mice treated with vehicle caused PV phenotype in secondary recipients with splenomegaly and high GFP chimerism in peripheral blood cells (supplemental Figure 12B-C). All treatments reduced the capacity of VF BM cells to induce MPN phenotype in secondary recipients, and the combination of pegIFN-α + Aza was the most effective in reducing GFP chimerism in peripheral blood and LT-HSCs in BM and spleen (supplemental Figure 12D). In contrast, none of the treatments impaired the capacity of BM cells from double-mutant VF;DmΔ/Δ mice to induce MPN phenotype in secondary recipients, and despite a temporary decrease in GFP chimerism, at 16 weeks, the JAK2-mutant cells dominated in peripheral blood, and only a small decrease in chimerism was noted in LT-HSCs in BM and spleen of mice who received transplantation with cells from pegIFN-α- or Aza-treated mice (supplemental Figure 12D).
To further characterize the effects of pegIFN-α, Aza, and pegIFN-α + Aza of LT-HSCs, we performed an additional transplantation experiment and analyzed the changes in cell cycle, DNA damage, and the transcriptome (supplemental Figures 13-14). The cell cycle and DNA damage analyses were performed separately on GFP-positive (JAK2-mutant) and GFP-negative (WT) LT-HSCs. In VF and VF;DmΔ/Δ mice, IFNα + Aza strongly reduced JAK2-mutant and WT LT-HSCs in G0 and increased HSCs in G1 and S/G2/M phase, whereas the single agents had either a weak or no significant effect on cell cycle (supplemental Figure 13D). Similar increase in DNA damage was observed in GFP-positive (JAK2-mutant) LT-HSCs but not in GFP-negative (WT) HSCs (supplemental Figure 13E), suggesting that WT HSCs can cope better with the proliferation-induced stress caused by IFN-α. Our RNAseq data in sorted LT-HSCs (supplemental Figure 14) revealed that in single-mutant VF HSCs, IFN-α and Aza as single agents upregulated only the IFN/inflammatory responses or the E2F and Myc pathways, respectively, whereas the combo of IFN-α + Aza had additive effects, upregulating both IFN/inflammatory responses as well as E2F and Myc pathways, without increasing the relative fold changes. In contrast, in the double-mutant VF;DmΔ/Δ HSCs, we observed upregulation of E2F and Myc pathways already in HSCs treated with IFN-α alone and upregulation of the IFN responses already in HSCs treated with Aza alone. In the HSCs treated with the combo, we saw IFN responses and E2F/Myc pathways to be both upregulated to higher fold-levels than in HSCs treated with the single agents.
Overall, the combination of pegIFN-α + Aza partially overcame resistance to pegIFN-α alone in primary VF;DmΔ/Δ mice (Figure 7), but BM from these treated mice recovered and induced high platelet counts in secondary recipients. Interestingly, pegIFN-α + Aza strongly decreased the JAK2-mutant allele burden single-mutant VF mice and prevented initiation of MPN in secondary recipients, showing potential to inflict long-term damage preferentially to the JAK2-mutant clone.
Discussion
Nontransplanted VF;DmΔ/Δ mice displayed milder MPN phenotype with less pronounced splenomegaly, lower blood counts, and lower grade of myelofibrosis than nontransplanted VF mice (Figure 1). The phenotype in recipients of BM from VF;DmΔ/Δ mice was comparable with nontransplanted VF;DmΔ/Δ mice, but it was more pronounced with higher platelet counts and higher degree of myelofibrosis than in recipients of BM from VF mice (Figure 2; supplemental Figure 6). The accentuated phenotype in recipients that received transplantation with VF;DmΔ/Δ BM appears to be related to the expansion of LT-HSCs and early progenitors under stress from recovery after transplantation (Figure 2E).16 The competitive advantage and increased self-renewal potential of the double-mutant VF;DmΔ/Δ HSCs was further evident in secondary and tertiary transplantations, resulting in more aggressive disease (Figure 4).
The phenotype of our VF;DmΔ/Δ mice showed similarities but also some differences with the phenotypes of previously described E2ACre;Jak2V617F knockin (E2Ki) mice, in which mutations in the Dnmt3a methyltransferase domain were induced by CRISPR-Cas9 gene editing.42 The unmodified E2Ki mice had high hematocrit but normal platelet and neutrophil counts,42,43 whereas our VF mice display elevated hematocrit with high platelet and neutrophil counts.23,44 The effects of CRISPR-Cas9–induced loss of Dnmt3a in E2Ki mice was studied using BM transplantations and should therefore be compared with our transplantations of VF;DmΔ/Δ BM. The Dnmt3a protein was not detected in Dnmt3a-Cas9 targeted BM cells (supplemental Figure 1B42), consistent with biallelic loss of Dnmt3a. VF;DmΔ/Δ and E2Ki;Dnmt3a-Cas9 mice both displayed higher degree of myelofibrosis compared with mutant VF or E2Ki mice. However, E2Ki;Dnmt3a-Cas9 mice displayed higher spleen weight but decreased frequencies of LT-HSCs,42 compared with our VF;DmΔ/Δ mice. The expansion of phenotypic and functional LT-HSCs in our VF;DmΔ/Δ mice is in line with the well documented expansion of HSCs in Dnmt3a knockout mice.15-17
PegIFN-α largely normalized blood counts in recipients of VF and VF;DmΔ/Δ BM cells, but was unable to substantially reduce the JAK2-mutant allele burden in HSPC of VF;DmΔ/Δ mice (Figure 2E-F; supplemental Figure 4). Primary recipients of VF;DmΔ/Δ BM already showed signs of adverse outcome in the pegIFN-α arm, for example, a trend toward increased spleen weight compared with vehicle (Figure 2D). The aggravating impact of IFN-α on VF;DmΔ/Δ hematopoiesis was even more apparent in secondary transplantations, with increased platelet counts, increased chimerism in peripheral blood lineages and vastly expanded HSPC pool composed exclusively of mutant cells (Figure 4). Consistent with the mouse data, we also observed adverse effects to IFNα in primary hematopoietic progenitors from patients with JAK2-V617F and DNMT3A mutations (Figure 5). MPN patients with JAK2-V617F and DNMT3A mutations were reported to respond less to IFNα treatment,45 and to show expansion of subclones with JAK2-V617F and DNMT3A mutations under IFNα treatment.46
Previous studies in mice have shown that long-term treatment with pegIFN-α preferentially targets Jak2-V617F LT-HSCs.20,21 Direct effects of IFN-α on WT LT-HSCs were linked to cell cycle activation and replication–induced stress, resulting in LT-HSC exhaustion,31 in line with the previous reports of replication stress being a critical factor in the functional decline of LT-HSC.47 More recently, long-term pegIFNα treatment was shown to preferentially affect Jak2-V617F LT-HSCs over WT LT-HSCs through sustained loss of quiescence, ROS production and DNA damage accumulation.22
Our data show that LT-HSCs and early hematopoietic progenitors from double-mutant VF;DmΔ/Δ mice treated with IFN-α were largely resistant to the accumulation of DNA damage, ROS, and exit of dormancy compared with VF (Figure 3). In secondary transplantations, LT-HSCs from IFNα treated VF;DmΔ/Δ mice showed increased self-renewal potential, resulting paradoxically in more aggressive disease (Figure 4). RNAseq data from sorted LT-HSCs, showed upregulation of inflammatory signatures in pegIFN-α treated VF and VF;DmΔ/Δ mice (Figure 6; supplemental Figure 14). Thus, VF;DmΔ/Δ HSCs were capable of maintaining their stemness despite exhibiting a greater upregulation of inflammatory pathways upon IFN-α treatment, compared with single-mutant VF HSCs. This suggests that the loss of Dnmt3a increases the threshold at which the double-mutant HSCs begin to exhaust when exposed to IFN-α signaling. Inflammation mediated by IFN-γ or tumor necrosis factor was also reported to promote the expansion of DNMT3A mutant clones in JAK2-WT hematopoiesis.48,49 Thus, resistance was not due to a block in IFN action, to the contrary, signaling was strongly activated by IFN-α, but loss of Dnmt3a protected the double-mutant HSCs from the deleterious effects of increased IFN signaling.
Combinations of pegIFN-α + At and pegIFN-α + Aza were very effective and pegIFN-α + Aza almost completely eliminated the JAK2-mutant clone in mice carrying the VF mutation alone (Figure 7; supplemental Figure 12-13). RNAseq data in sorted LT-HSCs (supplemental Figure 14) showed that IFN-α + Aza had the strongest effect on upregulating IFN- and inflammatory responses, as well as E2F and Myc pathways, which promote cell division and differentiation,50 ultimately contributing to exhausting the VF clone. Compared to VF mice, VF;DmΔ/Δ mice treated with pegIFN-α+Aza showed enhanced upregulation of IFN responses and E2F/Myc pathways in LT-HSCs, but responded with only ∼50% reduction of JAK2-617F-chimerism, and fully recovered MPN phenotype in secondary transplantations.
Overall, our data show that MPN caused by JAK2-V617F combined with loss of Dnmt3a resulted in a robust MPN phenotype, which worsened when the VF;DmΔ/Δ mutant HSCs were exposed to external stress, such as transplantation or treatment with pegIFN-α. Therefore, pegIFN-α should be avoided or applied with caution in patients who carry JAK2-V617F and DNMT3A mutations in the same clone. The combination of pegIFN-α + Aza partially overcame resistance in VF;DmΔ/Δ mice and strongly decreased the JAK2-mutant allele burden in mice carrying VF mutation only, rendering the HSCs incapable of initiating MPN in secondary recipients. Therefore, the combination of pegIFN-α + Aza bears promise for the treatment of patients with MPN caused by JAK2-V617F without presence of additional somatic gene mutations.
Acknowledgments
The authors thank David Tough for providing the NS0 cell line engineered to overproduce mouse IFN-α4 and Albert Neutzner for help with the fast protein liquid chromatography purification of IFN-α. The authors also thank the Genomics Facility of the University of Basel for their help with RNA preparation for single-cell and bulk RNA sequencing, as well as members of the laboratory for helpful discussions and critical review of the manuscript.
This work was supported by grants from the Swiss National Science Foundation (31003A_166613, 310030_185297/1, and 310030_185297/2), the Swiss Cancer Research (KFS-3655-02-2015 and KFS-4462-02-2018), the Stiftung für Hämatologische Forschung (R.C.S.), and the Czech Science Foundation (grant 24-11730S) (J.S.).
Authorship
Contribution: M.U. and J. Stetka designed and performed research, analyzed data, and wrote the manuscript; D.L.P., N.H., Q.K., T.A.F., M.L., L.K., R.K., and H.H.-S. performed research and analyzed data; A.B., A.E.T., J. Schulz, J.-C.L., and S.D. analyzed data; and R.C.S. designed research, analyzed data, and wrote the manuscript.
Conflict-of-interest disclosure: R.C.S. serves as a scientific adviser/scientific advisory board member and holds equity in Ajax Therapeutics; has provided consultancy services to and/or received honoraria from Novartis, Bristol Myers Squibb/Celgene, AOP, GSK, Baxalta, and Pfizer. N.H. owns stocks in the company Cantargia. The remaining authors declare no competing financial interests.
Correspondence: Radek C. Skoda, Department of Biomedicine, Experimental Hematology, University Hospital Basel and University of Basel, Hebelstr 20, 4031 Basel, Switzerland; email: radek.skoda@unibas.ch.
References
Author notes
M.U. and J. Stetka contributed equally to this study.
Presented orally at the 62nd annual meeting of the American Society of Hematology, San Diego, CA, 7 December 2020.
RNA sequencing (RNAseq) raw and processed data have been deposited in the Gene Expression Omnibus database (accession numbers GSE225918 [scRNAseq] and GSE255253 [bulk RNAseq]).
Additional methods are described and available in the supplemental Data. Original data and reagents are available on request from the corresponding author, Radek C. Skoda (radek.skoda@unibas.ch).
The online version of this article contains a data supplement.
There is a Blood Commentary on this article in this issue.
The publication costs of this article were defrayed in part by page charge payment. Therefore, and solely to indicate this fact, this article is hereby marked “advertisement” in accordance with 18 USC section 1734.

This feature is available to Subscribers Only
Sign In or Create an Account Close Modal