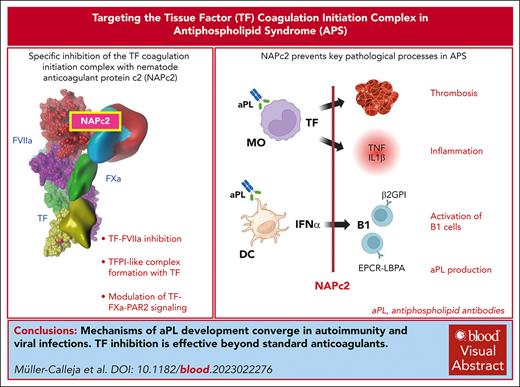
TF cytoplasmic domain coupling to the NAPDH-oxidase complex is required for aPL development.
Targeting TF-FVIIa prevents activation of B1 cells and circulating aPL in autoimmune and latent viral diseases.
Visual Abstract
Antiphospholipid antibodies (aPL) in primary or secondary antiphospholipid syndrome (APS) are a major cause for acquired thrombophilia, but specific interventions preventing autoimmune aPL development are an unmet clinical need. Although autoimmune aPL cross react with various coagulation regulatory proteins, lipid-reactive aPL, including those derived from patients with COVID-19, recognize the endolysosomal phospholipid lysobisphosphatidic acid presented by the cell surface–expressed endothelial protein C receptor. This specific recognition leads to complement-mediated activation of tissue factor (TF)–dependent proinflammatory signaling and thrombosis. Here, we show that specific inhibition of the TF coagulation initiation complex with nematode anticoagulant protein c2 (NAPc2) prevents the prothrombotic effects of aPL derived from patients with COVID-19 in mice and the aPL–induced proinflammatory and prothrombotic activation of monocytes. The induction of experimental APS is dependent on the nicotinamide adenine dinucleotide phosphate (NADPH) oxidase complex, and NAPc2 suppresses monocyte endosomal reactive oxygen species production requiring the TF cytoplasmic domain and interferon-α secretion from dendritic cells. Latent infection with murine cytomegalovirus causes TF cytoplasmic domain–dependent development of persistent aPL and circulating phospholipid-reactive B1 cells, which is prevented by short-term intervention with NAPc2 during acute viral infection. In addition, treatment of lupus prone MRL-lpr mice with NAPc2, but not with heparin, suppresses dendritic-cell activation in the spleen, aPL production and circulating phospholipid-reactive B1 cells, and attenuates lupus pathology. These data demonstrate a convergent TF-dependent mechanism of aPL development in latent viral infection and autoimmune disease and provide initial evidence that specific targeting of the TF initiation complex has therapeutic benefits beyond currently used clinical anticoagulant strategies.
Introduction
The antiphospholipid syndrome (APS) remains a clinically challenging acquired thrombophilia associated with autoimmune diseases and often severe morbidity and mortality.1-3 APS is diagnosed based on circulating antiphospholipid antibodies (aPL) which are reactive with the phospholipid (PL) cardiolipin and coagulation regulatory proteins, foremost β2-glycoprotein I (β2GPI),4,5 protein C (PC), and protein S.6 aPL also prolong clotting times in the lupus anticoagulant assay by interacting with procoagulant PLs, prothrombin, and β2GPI.7 The combination of persistent autoantibodies in systemic lupus erythematosus (SLE) defines a patient subgroup with high mortality.8 Although diagnosed by cardiolipin binding, aPL recognize the structural endolysosomal phospholipid lysobisphosphatidic acid (LBPA, or bis[monoacylglycerol]phosphate).9 The endothelial cell–protein C receptor (EPCR) exchanges bound phosphatidylcholine to LBPA after ALIX-dependent endosomal retrieval and presents LBPA on the cell surface for recognition by aPL.10 Lipid-reactive aPL, including those with protein cross-reactivity,11,12 engage EPCR-LBPA to promote prothrombotic responses and autoimmunity in vivo.10
Coagulation initiation by tissue factor (TF) is central to the thrombotic complications in APS.13 In addition, complement activation contributes to thrombosis and fetal loss in APS14 and complement mutations are associated with catastrophic APS.15 Complement is directly involved in activating monocyte-expressed cryptic TF by protein disulfide isomerase–dependent thiol-disulfide exchange,16 which also regulates the APS autoantigen β2GPI.17 Complement C3 activation triggered by aPL not only renders TF prothrombotic18 but also contributes to proinflammatory signaling in monocytes and endothelial cells.19,20 Mechanistically, aPL bind to EPCR which functionally associates with the coagulation initiation complex of TF coagulation factor (F) VIIa and FXa in protease-activated receptor (PAR) signaling.21,22 Signaling and prothrombotic activity of this complex are inhibited by TF pathway inhibitor (TFPI)23 and binding of aPL to EPCR-LBPA dissociates the cell surface TF-FVIIa-FXa-TFPI complex on monocytes. This liberates FXa for thrombin-dependent PAR1/PAR2 heterodimer signaling19 leading to procoagulant acidic sphingomyelinase activation.10 Furthermore, TF-FVIIa endosomal trafficking19 leads to proinflammatory toll-like receptor (TLR)–7 signaling.24,25
The engagement of EPCR-LBPA by aPL on dendritic cells (DCs) also triggers TLR7-dependent type I interferon (IFN) production that activates PL-reactive B1 cells in an autoamplification loop required for persistent aPL production in experimental APS and SLE.10 In addition to autoimmune diseases, coagulation activation by TF is a hallmark of viral infections26 and a major contributor to thromboinflammation in severe COVID-19.27-29 aPL develop transiently in various infectious diseases30 and are prothrombotic when isolated from patients with COVID-19 who were hospitalized 31 through specific engagement of EPCR-LBPA.20 Circulating PL-reactive B cells in patients with COVID-19 are phenotypically similar to circulating B1 cells in mouse models of APS and SLE but do not react with β2GPI.10,20 Here, we show that the TF coagulation initiation complex not only participates in aPL-induced thrombosis but also promotes persistent aPL production. We furthermore characterize the effects of targeted TF inhibition on immune-cell activation and the prevention of aPL development in latent viral infection and autoimmune disease.
Materials and methods
Materials
Detailed lists of reagents, suppliers, and primer sequences are given in the supplemental Tables 1 - 3, available on the Blood website. Human monoclonal aPL representative of patient reactivities HL5B (cardiolipin-reactive), rJGG9 (β2GPI-reactive), and HL7G (dual reactivity) were purified under endotoxin-free conditions and characterized extensively.10 Patient immunoglobulin fractions were purified by ammonium sulfate precipitation and MiniTrap G25 columns.20
Mice
Mutant and genetically matched wild-type (WT) mice were bred under identical housing conditions in the central animal facility of the University Medical Center Mainz or at TSRI. Mice were from the following sources: MRL-lpr (MRL/MpJ-Faslpr/J, JAX); C57BL/6J TF cytoplasmic domain deleted (TFΔCT) mice, EPCRC/S (ProcrC/S) and strain-matched EPCRWT mice;10,19 gp47phox−/− and gp91phox−/− (B6N.129S2-Ncf1tm1Shl/J and B6.129S-Cybbtm1Din/J, JAX). Experiments with age- and sex-matched mice were approved by the TSRI IACUC or Landesuntersuchungsamt Rheinland-Pfalz, Koblenz, Germany (no. 23-177-07/G20-1-067, no. 23-177-07/G22-1-025, no. 23-177-07/G18-1-003S, and no. 23-177-07/G19-1-089E2).
Animal models
Inferior vena cava thrombosis model
aPL-amplified thrombus development by 10 μg immunoglobulin G (IgG) purified from patients with COVID-19 was evaluated with and without inhibition by 1 μg/g bodyweight nematode anticoagulant protein c2 (NAPc2) subcutaneously by high-speed fluorescence video microscopy on an Olympus BX51WI, as described.20
Experimental APS
CMV infection model
TFΔCT and WT C57BL/6J control mice, as well as EPCRC/S and strain-matched EPCRWT mice were infected with 2 × 10⁵ PFU murine cytomegalovirus (mCMV) (Smith strain, ATCC-VR1399) intraperitoneally and received 10 subcutaneously doses of 0.5 μg/g NAPc2 in 100 μL phosphate-buffered saline (PBS) or vehicle control every other day. Cytokine levels were measured with the LEGENDplex Mouse Anti-Virus Response Panel (13-plex). Viral DNA load was determined by M55-specific and pthrp-specific quantitative polymerase chain reactions (PCRs) normalized to a log10-titration of standard plasmid pDrive_gB_PTHrP_Tdy, as described.33
SLE model and clinical pathological scoring
The effect of NAPc2 on lupus-like autoimmune disease was evaluated in MRL-lpr mice34 receiving 0.5 mg/kg rNAPc2 or saline control every other day for 3 weeks starting at an age of 11 weeks. Lymphadenopathy was scored at 3 sites (cervical, axillary, axillary or brachial, and inguinal (on a scale from 0-4 [none-very severe]). Skin lesions were scored at snout, ears, and neck (from 0-3 [none-severe]). Albumin in spot urine samples was detected with a mouse albumin enzyme-linked immunosorbent assay (ELISA) (Bethyl Laboratories) and normalized to creatinine content with the Creatinine Assay Kit (Creative BioMart).
Renal paraffin sections stained with periodic acid–Schiff reagent were scored for glomerulus pathology in 20 glomeruli per kidney.10 Interstitial or tubular pathology was assessed semiquantitatively in 10 randomly selected high-power fields. Glomerular and interstitial or tubular scores were averaged to obtain the renal pathology score. CD68, CD4, and B220 cell infiltration was quantified in stained sections and randomly selected high-power fields.
Methods
aPL stimulation of monocytes
Monocytic MM1 cells received inhibitors (20 μg/mL anti-PAR1 ATAP/WEDE, 50 μg/mL anti-TF 5G9/10H10, and 200 nM NAPc2) 15 minutes before stimulation with 400 ng/mL aPL HL5B and HL7G, 1 μg/mL aPL rJGG9 and control IgG, 10 μg/mL patient immunoglobulin, or 10 ng/mL lipopolysaccharide (LPS) for 1 hour. Endosomal reactive oxygen species (ROS) was detected with 10 μM fluorescent probe H2DCFDA by flow cytometry using a FACS Canto.19 Messenger RNA (mRNA) expression analysis by real-time PCR on the iCycler iQ thermal cycler (Bio-Rad) was normalized to glyceraldehyde-3-phosphate dehydrogenase.10 DC stimulation and IFNα measurements were performed as described.24
NGS sequencing and analysis
RNA isolated from MM1 cells was sequenced at the Max Delbrück Center for Molecular Medicine, Berlin, Germany, and next-generation sequencing (NGS) data were mapped to GRCh38.p13 with STAR on the fly. Count matrices were generated and transcripts with expression <10 were removed and analyzed for differential expression with the DESEQ2 package (version 4.2.0). After log normalization, differentially expressed genes were volcano plotted with ggplot2. Top differentially expressed genes were clustered with the Euclidean distance algorithm and log2-fold changes between groups were visualized with Pheatmap, using an adjusted P value <.05 as threshold.
NGS sequencing of MRL-lpr DCs used spleens digested with collagenase II (Worthington) and DNase I (Sigma-Aldrich) for 30 minutes at 37°C followed by cell dissociation with 10 mM EDTA and enrichment on an Optiprep density gradient (Sigma-Aldrich). Dead cells were stained with 7-aminoactinomycin D for cell sorting on an ARIA II cell sorter (Becton Dickinson) and live DCs identified by major histocompatibility complex II and CD11c in the CD3/CD19/NK1.1 negative population were lysed in 350 μL RLT lysis buffer (Qiagen), 10 μL β-MeEtOH and stored at −80°C. RNA was sequenced by Novogene and mapped to reference genome Mus_musculus.GRCm38.96 with STAR2.7.2. After quality control, low-count gene removal (gene expression <10), DESEQ2 analysis and normalization, gene set enrichment analysis was performed with the package Clusterprofiler version 4.8.2.
aPL and B-cell characterization
Immunoglobulin fractions or mouse sera were analyzed using ELISA plates coated overnight with 2 μg/mL PL in ethanol at 4°C, blocked with 1% Tween 20, and incubated with 40 μg/mL of immunoglobulin fractions or mouse sera in PBS, 0.1% Tween 20. Bound antibody was detected with horseradish peroxidase (HRP)-coupled anti-IgG secondary antibody and tetramethylbenzidine substrate. Binding to β2GPI was analyzed in a commercially available ELISA plates (AESKU Diagnostics, Wendelsheim, Germany).
aPL producing B cells were analyzed in peritoneal lavage or EDTA blood by PL vesicles or β2GPI staining and gating for live B1 cells.20 Changes in B1 cells in the bone marrow and peritoneal lavage were quantified with standardized multicolor flow cytometry using antibodies listed in the supplemental Table 4. Cells were washed with PBS or bovine serum albumin (0.5%), measured on an Attune Nxt flow cytometer (ThermoFisher), and data analyzed with FlowJo 7.2 software (TreeStar Inc).
Statistics
Mean and standard deviations of biological replicates are shown. GraphPad Prism 9.5.0 was used for statistical analysis by 2-way analysis of variance, followed by Sidak multiple comparison test for multiple groups or 2-tailed unpaired Student t test for 2 groups.
Results
The TF-inhibitor NAPc2 is a biased antagonist for aPL-triggered monocyte activation
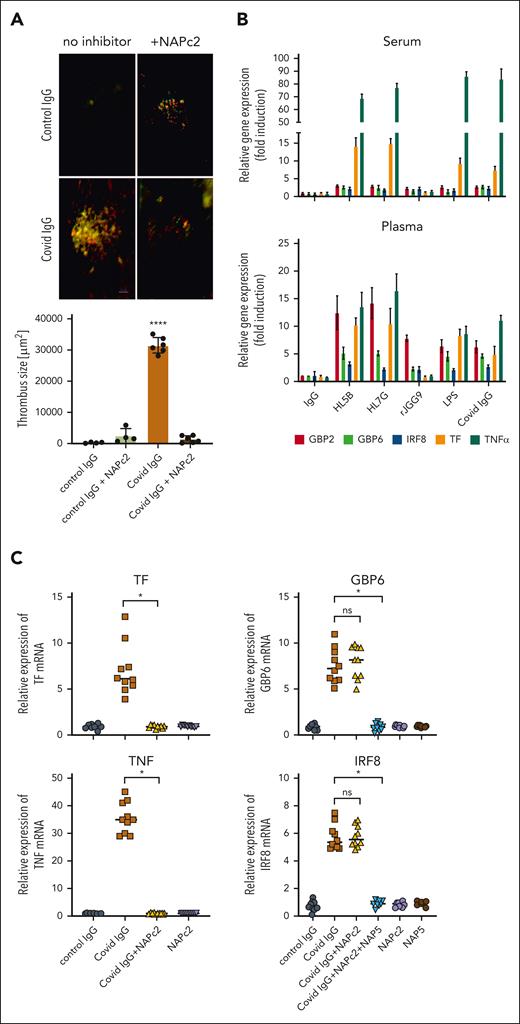
TF-initiated thromboinflammation is a hallmark of severe COVID-1927-29 and COVID-19 aPL induce thrombosis in mice.20,31 We analyzed the role of TF with the specific TF inhibitor NAPc2 that locks the TF-FVIIa-FXa complex in a TFPI-like manner.35,36 NAPc2 inhibits TF pathological functions in mouse and primate models37-41 and coagulation activation in humans.42-44 In an established model of aPL-enhanced thrombosis in the flow-restricted vena cava inferior,10,18-20,45 NAPc2 markedly reduced thrombosis induced by prothrombotic immunoglobulin fractions isolated from patients with COVID-19 and known to engage EPCR-LBPA20 (Figure 1A). Thus, COVID-19 aPL induced TF-dependent thrombosis.
Inhibition of aPL prothrombotic and proinflammatory response by NAPc2. (A) Thrombus formation in mice treated with immunoglobulin (10 μg) fractions either alone or together with NAPc2; platelets are shown in red, and leukocytes are shown in green. Quantification of thrombus size in the vena cava inferior 3 hours after injection of immunoglobulin isolated from healthy controls (n = 4) or patients with COVID-19 (n = 6) and flow restriction. Mean ± standard deviation (SD), ∗∗∗∗P < .0001, t test following Shapiro-Wilk test for normal distribution. (B) MM1 cells were cultured in human serum or plasma and then stimulated for 1 hour with HL5B or HL7G (400 ng/mL each), rJGG9 or IgG (1 μg/mL each), LPS (10 ng/mL) or IgG from patients with COVID-19 (10 μg/mL). (C) Suppression of TF, TNF, GBP6 and IRF8 mRNA induction by NAPc2 (200 nM) and NAP5 (200 nM) after 1 hour of stimulation with immunoglobulin (10 μg/mL) isolated from patients with COVID-19 (n = 10), ∗P < .0001; 1-way analysis of variance (ANOVA).
Inhibition of aPL prothrombotic and proinflammatory response by NAPc2. (A) Thrombus formation in mice treated with immunoglobulin (10 μg) fractions either alone or together with NAPc2; platelets are shown in red, and leukocytes are shown in green. Quantification of thrombus size in the vena cava inferior 3 hours after injection of immunoglobulin isolated from healthy controls (n = 4) or patients with COVID-19 (n = 6) and flow restriction. Mean ± standard deviation (SD), ∗∗∗∗P < .0001, t test following Shapiro-Wilk test for normal distribution. (B) MM1 cells were cultured in human serum or plasma and then stimulated for 1 hour with HL5B or HL7G (400 ng/mL each), rJGG9 or IgG (1 μg/mL each), LPS (10 ng/mL) or IgG from patients with COVID-19 (10 μg/mL). (C) Suppression of TF, TNF, GBP6 and IRF8 mRNA induction by NAPc2 (200 nM) and NAP5 (200 nM) after 1 hour of stimulation with immunoglobulin (10 μg/mL) isolated from patients with COVID-19 (n = 10), ∗P < .0001; 1-way analysis of variance (ANOVA).
To better understand the inhibitory function of NAPc2 on aPL–induced immune cell activation, we stimulated human monocytic cells with aPL derived from patients with COVID-19 or prototypic aPL monoclonal antibodies46 in human serum (Figure 1B), because NAPc2 has very low affinity for bovine FX/Xa.47 Except rJGG9 reactive only with β2GPI,10,48 COVID-19 and monoclonal aPL HL5B and HL7G reactive with EPCR-LBPA induced primarily proinflammatory tumor necrosis factor (TNF) and TF. We had previously shown that mouse monocytes also upregulated IFN-regulated transcripts (GBP6 and IFN-regulated factor [IRF] 8) in response to aPL.10 A repeat of the experiment in plasma showed that lipid-reactive aPL and LPS now robustly induced IFN-regulated transcripts (Figure 1B), suggesting that a labile factor required for IFN responses was severely reduced in the preparation of human serum.
Under these experimental conditions, NAPc2 also markedly attenuated induction of TF and TNF, but not GBP6 and IRF8 by COVID-19 aPL (Figure 1C). Although NAPc2 inhibits TF-FVIIa in a TFPI-like manner requiring FX/Xa, NAPc2 does not block the active site of FXa and permits TF-FVIIa-FXa–mediated proteolytic activation of PARs49 and other substrates of the nascent product FXa.50 Importantly, NAPc2 also maintains the signaling conformation of TF-FVIIa-FXa required for TLR4/PAR2-dependent IFN responses involving IRF7 in DCs.22 Addition of the FXa inhibitor NAP5 together with NAPc2 prevented the induction of IFN-regulated genes by aPL (Figure 1C), confirming that FXa mediates the IFN responses in the NAPc2-inhibited complex.
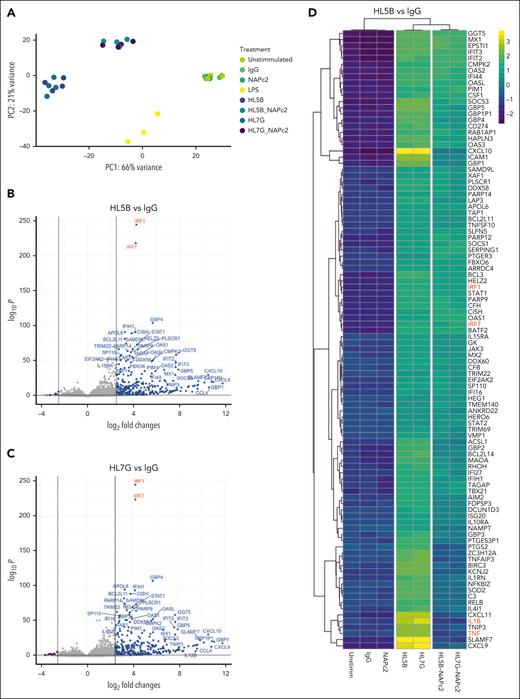
To fully understand the inhibitory properties of NAPc2, we analyzed the genome-wide transcriptional response induced by 2 prototypic human monoclonal aPL—HL5B solely reactive with EPCR-LBPA and HL7G reactive with EPCR-LBPA and β2GPI. Principal component analysis of transcript changes in NGS data (Figure 2A) showed that aPL HL5B and HL7G induced a very similar response distinct from LPS stimulation. The aPL HL5B (Figure 2B) and HL7G (Figure 2C) induced an overlapping response of IFN-regulated transcripts, including IRF1 and IRF7, proinflammatory TNF and interleukin (IL) 1β, which were found in the top 100 transcripts induced by aPL HL5B vs control IgG (Figure 2D). These similarities of prototypic aPL indicated that the cross-reactivity of aPL HL7G with the plasma protein β2GPI did not influence the early immune cell activation after engagement of EPCR-LBPA.
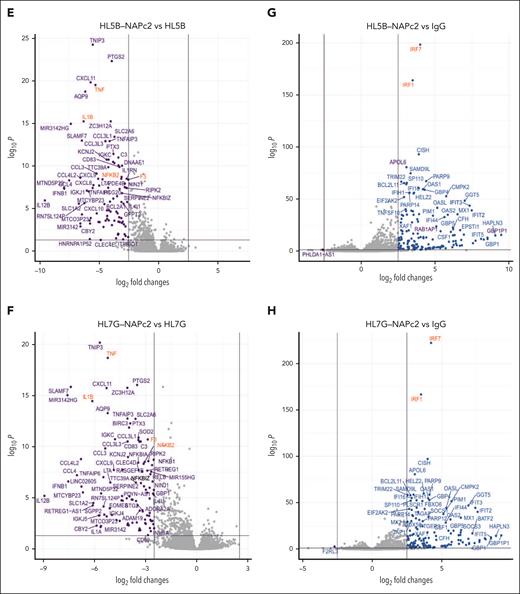
NAPc2 treatment inhibits aPL induced thromboinflammatory signaling without affecting aPL induced IFN response in monocytes. (A) Principal component analysis of aPL or NAPc2–treated monocytes and their respective controls reveals distinct clustering of stimulated and treatment groups (n = 4 per group). (B-C) Volcano plots of differentially expressed genes of HL5B and HL7G aPL–stimulated monocytes compared with IgG stimulated controls. Both aPL induce a highly similar proinflammatory phenotype involving NF-κB and IFN signaling. (D) Heatmaps showing z-scaled count values between the different treatment groups of the top 100 differentially expressed genes (P-adjusted <.001 and log2-fold change ± 2.5) from the comparison between HL5B- and IgG-treated monocytes. (E-H) Volcano plots revealed that NAPc2 treatment inhibited aPL induced NF-κB signaling, but not aPL induced IFN responses. Thresholds were set at a log2-fold change of ±2.5 and a P-adjust <.05.
NAPc2 treatment inhibits aPL induced thromboinflammatory signaling without affecting aPL induced IFN response in monocytes. (A) Principal component analysis of aPL or NAPc2–treated monocytes and their respective controls reveals distinct clustering of stimulated and treatment groups (n = 4 per group). (B-C) Volcano plots of differentially expressed genes of HL5B and HL7G aPL–stimulated monocytes compared with IgG stimulated controls. Both aPL induce a highly similar proinflammatory phenotype involving NF-κB and IFN signaling. (D) Heatmaps showing z-scaled count values between the different treatment groups of the top 100 differentially expressed genes (P-adjusted <.001 and log2-fold change ± 2.5) from the comparison between HL5B- and IgG-treated monocytes. (E-H) Volcano plots revealed that NAPc2 treatment inhibited aPL induced NF-κB signaling, but not aPL induced IFN responses. Thresholds were set at a log2-fold change of ±2.5 and a P-adjust <.05.
Remarkably, NAPc2 altered, but did not revert to baseline, the transcriptional profiles induced by aPL HL5B and HL7G (Figure 2A,D). The comparison of NAPc2 effects on the transcriptional profiles of aPL HL5B (Figure 2E) and HL7G (Figure 2F) stimulated cells revealed a suppression of proinflammatory responses and of TF induction by NAPc2, in line with the targeted transcript analysis with COVID-19 aPL (Figure 1C). In contrast, IFN-regulated transcripts were still induced by aPL HL5B (Figure 2G) and HL7G (Figure 2H) in the presence of NAPc2 in comparison with IgG control. Thus, stabilization of the TF-FVIIa-FXa complex by NAPc2 on aPL-stimulated monocytes suppressed prothrombotic and proinflammatory effects but not the induction of IFN responses implicated in antimicrobial host defense.
TF-dependent aPL development in latent viral infection is prevented by NAPc2
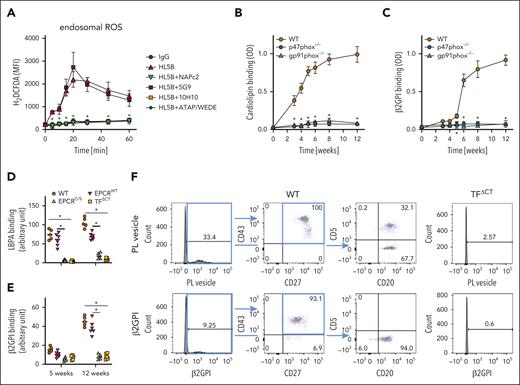
We next asked whether NAPc2 might also interfere with the development of aPL. The proinflammatory activation of monocytes by aPL requires endosomal ROS production and TF-FVIIa–mediated translocation of gp91phox to the endosome.19 In line with the observed inhibition of proinflammatory responses by NAPc2 (Figure 2), NAPc2 was as potent as the inhibitory anti-TF 10H1019,51 or cleavage blocking anti-PAR119 in preventing aPL HL5B-induced ROS generation (Figure 3A). Although the prothrombotic45 and proinflammatory46 effects of aPL are dependent on the nicotinamide adenine dinucleotide phosphate (NADPH) oxidase, the role of the NADPH oxidase complex in the development of APS is unknown. In an established experimental model of APS,10 we found that aPL reactive with cardiolipin (Figure 3B) or β2GPI (Figure 3C) did not develop in mice lacking components of the NADPH oxidase complex, p47phox and gp91phox. In this model, cardiolipin-reactive aPL develop dependent on TLR7 and EPCR10 and β2GPI-reactive aPL development was also abolished in EPCRC/S mice defective in LBPA-loading or Tlr7−/−, but not Tlr9−/− mice (supplemental Figure 1A-B), validating this prothrombotic APS model52 as highly relevant for autoimmune aPL development. Experimental APS can also be induced by immunization with β2GPI.32,52 In this alternative model, aPL reactive with LBPA and cell surface–expressed EPCR-LBPA and capable of proinflammatory and procoagulant monocyte activation also did not develop in EPCRC/S mice (supplemental Figure 2), indicating that experimental APS induction by immunization with aPL or β2GPI evokes similar autoimmune responses.
TF cytoplasmic domains signaling coupling to the NAPDH oxidase is required for aPL development. (A) Flow cytometric analysis of endosomal ROS production in MM1 cells stimulated with aPL HL5B and the effect of inhibitors. Cells were loaded with H2DCFDA before stimulation with HL5B without or with NAPc2, anti-TF 5G9 (aPL signaling noninhibitory) and 10H10 (aPL signaling inhibitory), or anti-PAR1 ATAP/WEDE; n = 5, means ± SD of mean fluorescence intensity; ∗P ≤ .001; 2-way ANOVA, Sidak multiple comparisons test. (B-C) Serum anticardiolipin (CL) (B) or anti-β2GPI (C) titers in mice of the indicated genotypes immunized with aPL HL5B; n = 5 mice, ∗P ≤ .03; 2-way ANOVA, Sidak multiple comparisons test. (D-E) The indicated mouse strains mice were infected with mCMV and serum anti-LBPA (D) or anti-β2GPI (E) titers were measured 5 and 12 weeks after infection; n = 6 mice, ∗P ≤ .0001; 2-way ANOVA, Sidak multiple comparisons test. (F) Representative example of flow cytometric detection of peripheral blood B cells reactive with fluorescently labeled PL vesicles or fluorescently labeled β2GPI. Seven weeks after CMV infection, circulating lipid-reactive as well as β2GPI-reactive B1 cells are found in C57BL/6J WT mice but not in TFΔCT mice.
TF cytoplasmic domains signaling coupling to the NAPDH oxidase is required for aPL development. (A) Flow cytometric analysis of endosomal ROS production in MM1 cells stimulated with aPL HL5B and the effect of inhibitors. Cells were loaded with H2DCFDA before stimulation with HL5B without or with NAPc2, anti-TF 5G9 (aPL signaling noninhibitory) and 10H10 (aPL signaling inhibitory), or anti-PAR1 ATAP/WEDE; n = 5, means ± SD of mean fluorescence intensity; ∗P ≤ .001; 2-way ANOVA, Sidak multiple comparisons test. (B-C) Serum anticardiolipin (CL) (B) or anti-β2GPI (C) titers in mice of the indicated genotypes immunized with aPL HL5B; n = 5 mice, ∗P ≤ .03; 2-way ANOVA, Sidak multiple comparisons test. (D-E) The indicated mouse strains mice were infected with mCMV and serum anti-LBPA (D) or anti-β2GPI (E) titers were measured 5 and 12 weeks after infection; n = 6 mice, ∗P ≤ .0001; 2-way ANOVA, Sidak multiple comparisons test. (F) Representative example of flow cytometric detection of peripheral blood B cells reactive with fluorescently labeled PL vesicles or fluorescently labeled β2GPI. Seven weeks after CMV infection, circulating lipid-reactive as well as β2GPI-reactive B1 cells are found in C57BL/6J WT mice but not in TFΔCT mice.
These data implicated TF-mediating endosomal translocation of the NADPH complex in aPL development. To further analyze aPL development in a pathological setting, we asked whether viral infections associated with activation of IFN responses could stimulate aPL production by B1 cells. Indeed, infection with mCMV caused a persistent production of aPL reactive with LBPA (Figure 3D) and β2GPI (Figure 3E) appearing during viral latency. These antibodies did not develop in EPCRC/S mice that were defective in aPL signaling.10 The TF cytoplasmic domain couples to the NADPH oxidase complex53,54 and is required for endosomal ROS production in aPL signaling.19 We, therefore, analyzed the development of aPL in mCMV-infected TF cytoplasmic domain deleted (TFΔCT) mice. TFΔCT mice did not develop autoantibodies (Figure 3D-E) or circulating PL-reactive B1 cells (Figure 3F). These data implicated TF and especially TF cytoplasmic domain signaling in the development of APS.
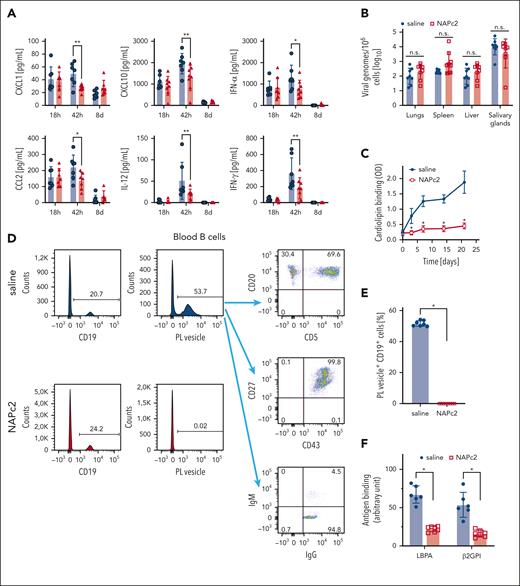
EPCR-LBPA recognition by aPL on DCs is also required for IFN signaling–dependent expansion of B1 cells with PL reactivity.10 Stimulation with aPL HL5B or COVID-19 aPL induced IFNα mRNA and protein secretion from DCs (supplemental Figure 3A-B). IFNα, but not GPB6 or IRF7 mRNA induction was markedly reduced in the presence of NAPc2, indicating that the TF-induced IFN responses were independent of autocrine IFNα signaling. We next asked whether the inhibition of the TF initiation complex by NAPc2 could prevent autoantibody production in latent mCMV infection. We treated mice during the acute viral infection from day 0 to 20 with NAPc2. Cytokine levels peaked at 42 hours and returned to baseline 8 days after infection (Figure 4A). NAPc2 treatment significantly reduced CXCL1, CCL2, CXCL10, IL12, IFNγ, and IFNα levels 42 hours after infection. NAPc2 treatment did not impair the control of acute infection as indicated by the viral genome load in lung, spleen, liver, and salivary gland which was indistinguishable between saline- and NAPc2-treated mice 21 days after infection (Figure 4B). Remarkably, treatment with NAPc2 attenuated the persistent production of aPL with cardiolipin reactivity (Figure 4C) and suppressed the appearance of circulating B cells reactive with PL vesicles (Figure 4D-E). These PL-reactive B cells circulating at day 10 after infection had the phenotypic makers CD5, CD20, CD27, and CD43 characteristic for B1 cells and were IgG class-switched (Figure 4D), a feature of B1 cells exiting the peritoneum.55 We also detected PL-reactive and IgG+ B1 cells in the peritoneal cavity and the blood 21 days after infection (supplemental Figure 3C), and NAPc2 suppressed the expansion of these B1 cells not only in the blood, but also the peritoneal cavity (supplemental Figure 3D). In addition, short-term treatment with NAPc2 for 20 days suppressed LBPA- and β2GPI-reactive aPL 12 weeks after infection (Figure 4F). Thus, targeting the TF initiation complex with NAPc2 prevented the development of aPL in latent viral infection without apparent impairments of antiviral immunity.
NAPc2 prevents the development of aPL in mCMV infection. (A) Blood cytokine levels of WT animals infected with 2 × 10⁵ plaque-forming unit mCMV and treated with 0.5 mg/kg NAPc2 (red) or saline (blue) every second day. In contrast to the depicted significantly reduced cytokine levels 42 hours after infection, NAPc2 treatment had no effect on TNF, IL6, IL1β, IL10, and CCL5 expression measured in the same multiplex assay; ∗P< .05, ∗∗P< .01, 2-way ANOVA, Sidak comparison. (B) Viral loads determined by quantification of genomic viral DNA in the indicated organs 21 days after infection in mice treated from day 2 after viral infection. (C) Serum anti-CL titers were determined at the indicated times; n = 8 mice, ∗P ≤ .001; 2-way ANOVA, Sidak multiple comparisons test. (D) Fluorescent PL vesicles staining of circulating B cells at day 10 after infection. PL-positive B cells were identified as CD5+CD19+CD27+CD43+ memory type B1a cells in peripheral blood and absent in NAPc2-treated mice. (E) Quantification of blood PL+ CD19+ B cells in mice treated with NAPc2 or saline control at day 10. Mean ± SD, n = 8 mice, ∗P < .0001, t test following Shapiro-Wilk test for normal distribution (F) serum anti-LBPA and anti-β2GPI titers were determined 12 weeks after infection and NAPc2 treatment for 20 days. n = 6 to 7 mice, ∗P ≤ .0001; 2-way ANOVA, Sidak multiple comparisons test.
NAPc2 prevents the development of aPL in mCMV infection. (A) Blood cytokine levels of WT animals infected with 2 × 10⁵ plaque-forming unit mCMV and treated with 0.5 mg/kg NAPc2 (red) or saline (blue) every second day. In contrast to the depicted significantly reduced cytokine levels 42 hours after infection, NAPc2 treatment had no effect on TNF, IL6, IL1β, IL10, and CCL5 expression measured in the same multiplex assay; ∗P< .05, ∗∗P< .01, 2-way ANOVA, Sidak comparison. (B) Viral loads determined by quantification of genomic viral DNA in the indicated organs 21 days after infection in mice treated from day 2 after viral infection. (C) Serum anti-CL titers were determined at the indicated times; n = 8 mice, ∗P ≤ .001; 2-way ANOVA, Sidak multiple comparisons test. (D) Fluorescent PL vesicles staining of circulating B cells at day 10 after infection. PL-positive B cells were identified as CD5+CD19+CD27+CD43+ memory type B1a cells in peripheral blood and absent in NAPc2-treated mice. (E) Quantification of blood PL+ CD19+ B cells in mice treated with NAPc2 or saline control at day 10. Mean ± SD, n = 8 mice, ∗P < .0001, t test following Shapiro-Wilk test for normal distribution (F) serum anti-LBPA and anti-β2GPI titers were determined 12 weeks after infection and NAPc2 treatment for 20 days. n = 6 to 7 mice, ∗P ≤ .0001; 2-way ANOVA, Sidak multiple comparisons test.
TF initiation complex inhibition by NAPc2 attenuates autoimmune aPL production in SLE
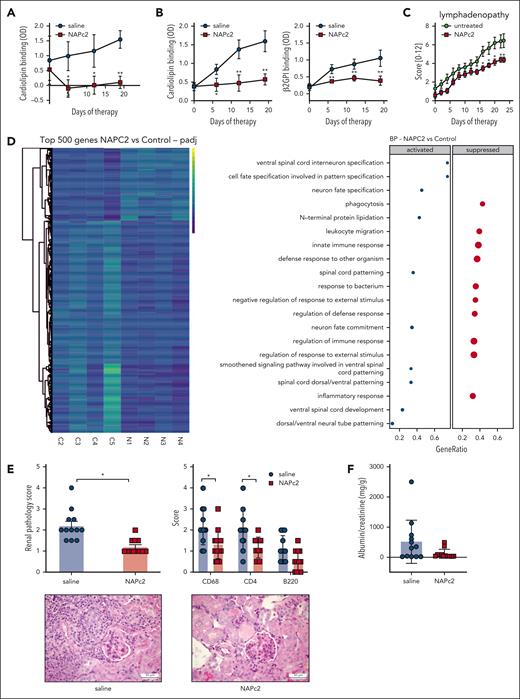
Viral sensing and autoimmune signaling pathways overlap in disease development.56 We, therefore, evaluated NAPc2 therapy in an established model of autoimmunity. MRL-lpr mice develop a TLR7-dependent57 SLE-like syndrome and aPL10 at an age of 5 to 6 weeks.10 The severe SLE-like syndrome progresses and requires euthanization of mice before they reach an age of 15 to 16 weeks. We treated MRL-lpr mice at an age of 11 weeks with 0.5 mg/kg rNAPc2 or saline control every other day for 3 weeks. At the time of randomization to therapy, both groups had similar anticardiolipin aPL titers, but aPL titers rather declined in rNAPc2-treated mice, whereas they increased in mice receiving saline (Figure 5A). In a second cohort, MRL-lpr mice were similarly randomized for treatment and the reactivity of serum samples against cardiolipin or β2GPI markedly increased over time in saline-treated mice, whereas mice randomized to receive rNAPc2 therapy continued to produce very low autoantibody titers (Figure 5B).
Prevention of SLE-like syndrome by NAPc2 treatment. (A) Anti-CL titers in MRL-lpr mice treated with 0.5 mg/kg NAPc2 every second day starting at an age of 11 weeks; n = 6, P ≤ .0007; 2-way ANOVA, Sidak multiple comparisons test. (B) Anti-CL and β2GPI titers in an independent cohort with the same randomization and treatment scheme; n = 6, P ≤ .0001; 2-way ANOVA, Sidak multiple comparisons test. (C) Lymphadenopathy score for NAPc2- or saline-treated MRL-lpr mice; n = 6 per group, ∗P ≤ .05; 2-way ANOVA, Sidak multiple comparisons test. (D) Heatmap of the top 500 most significantly differentially expressed genes in splenic DCs from MRL-lpr mice isolated at the end of the treatment experiment; counts are z-scale normalized. Gene set enrichment analysis (GSEA) confirmed that NAPc2 suppresses inflammatory responses in DCs sorted from spleen; P-adjust threshold <.05 was used in GSEA (n = 4 per group). (E) Renal pathology scores and glomerular immune cell infiltration of NAPc2- or saline-treated MRL-lpr mice; n = 12 mice per group, ∗P < .025; Mann-Whitney U test. Scale bars, 50 mm. (F) Albuminuria in NAPc2- or saline-treated MRL-lpr mice determined at the end of the experiment. Combined data from the cohorts shown in panels A and B; P = .0768, unpaired t test with Welch correction.
Prevention of SLE-like syndrome by NAPc2 treatment. (A) Anti-CL titers in MRL-lpr mice treated with 0.5 mg/kg NAPc2 every second day starting at an age of 11 weeks; n = 6, P ≤ .0007; 2-way ANOVA, Sidak multiple comparisons test. (B) Anti-CL and β2GPI titers in an independent cohort with the same randomization and treatment scheme; n = 6, P ≤ .0001; 2-way ANOVA, Sidak multiple comparisons test. (C) Lymphadenopathy score for NAPc2- or saline-treated MRL-lpr mice; n = 6 per group, ∗P ≤ .05; 2-way ANOVA, Sidak multiple comparisons test. (D) Heatmap of the top 500 most significantly differentially expressed genes in splenic DCs from MRL-lpr mice isolated at the end of the treatment experiment; counts are z-scale normalized. Gene set enrichment analysis (GSEA) confirmed that NAPc2 suppresses inflammatory responses in DCs sorted from spleen; P-adjust threshold <.05 was used in GSEA (n = 4 per group). (E) Renal pathology scores and glomerular immune cell infiltration of NAPc2- or saline-treated MRL-lpr mice; n = 12 mice per group, ∗P < .025; Mann-Whitney U test. Scale bars, 50 mm. (F) Albuminuria in NAPc2- or saline-treated MRL-lpr mice determined at the end of the experiment. Combined data from the cohorts shown in panels A and B; P = .0768, unpaired t test with Welch correction.
The development of lymphadenopathy was also attenuated in NAPc2-treated animal vs those treated with saline (Figure 5C) and only 1 of 5 of the NAPc2-treated mice had visible skin lesions at the end of the experiment as compared with 4 of 5 in the control group. NAPc2 treatment had no effect on peripheral blood cell counts (supplemental Figure 4). To evaluate the immune modulatory effect of NAPc2, we isolated splenic DCs by flow cytometry for NGS sequencing. Treatment with NAPc2 altered the expression profile of DCs (Figure 5D). Biological pathways analysis showed a suppression of inflammatory responses in DCs isolated from NAPc2-treated mice (Figure 5D). We next addressed the effects of NAPc2 on B1 cells in the peritoneum. Although NAPc2 treatment did not influence CD19+/CD43+ B1 cell abundance (supplemental Figure 5A-B), NAPc2 increased the proportion of peritoneal B1 cells expressing CD5, which is a negative regulator of B-cell receptor signaling.58 In contrast, NAPc2 did not alter B1 phenotypes in the bone marrow (supplemental Figure 5C), indicating that NAPc2 primarily altered immune pathology in the periphery.
Kidney pathology in the NAPc2 treatment cohorts revealed a significantly improved renal pathology score, a composite of glomerular and tubular injury, in rNAPc2- vs control-treated mice (Figure 5E). Treatment with rNAPc2 also significantly reduced kidney immune cell infiltration, based on scoring for macrophages (CD68), T cells (CD4), and B cells (B220) by immune-histochemistry (Figure 5E). In addition, renal function assessed by measuring albumin in the urine showed that sham-treated control mice developed more albuminuria in comparison to rNAPc2-treated mice (Figure 5F). These data showed that NAPc2 prevented not only the development of aPL but also disease severity in MRL-lpr mice.
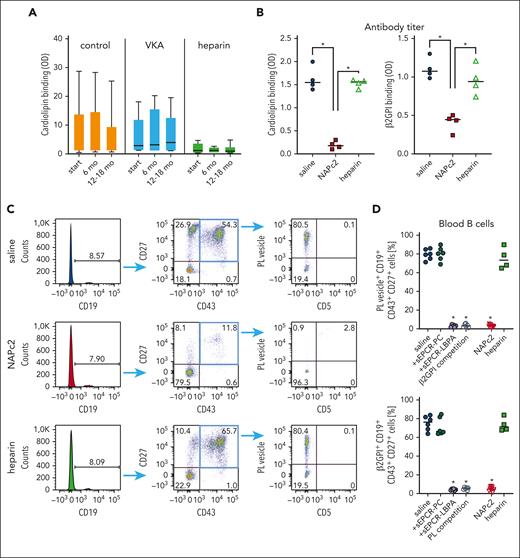
Current clinically used antithrombotic therapies have limited effects on aPL titers. We confirmed this observation in a single center cohort without antithrombotic therapy and under heparin or vitamin K–antagonist therapy (Figure 6A). The measured aPL titers in each treatment group did not change significantly over the observation period of 1 year. We next treated MRL-lpr mice with either NAPc2 or low-molecular weight heparin, using a previously established effective dosing scheme.59 Treatment with NAPc2, but not with heparin, suppressed anticardiolipin and anti-β2GPI titers (Figure 6B). At the end of the treatment experiment, circulating CD19+CD27+CD43+ B1 cells (Figure 6C) demonstrated binding of both autoantigens, labeled PL vesicles, and β2GPI (Figure 6D). As expected from the measured aPL titers in these mice, sham- and heparin-treated MRL-lpr mice showed a high percentage of PL and β2GPI-reactive circulating B1 cells which were not detected in NAPc2-treated mice (Figure 6D). PL vesicle staining was blocked by the pathogenic target of aPL, LBPA-loaded soluble EPCR (sEPCR-LBPA) as well as unlabeled β2GPI, but not soluble EPCR loaded with phosphatidylcholine (sEPCR-PC) (Figure 6D). Conversely, β2GPI staining was specifically prevented by sEPCR-LBPA as well as unlabeled PL vesicles, indicating that circulating B1 cells in this mouse model of autoimmunity had dual reactivity with EPCR-LBPA and β2GPI. In addition, these data showed that specific inhibition of TF with rNAPc2 but not anticoagulation with heparin effectively prevented the development of autoimmune antibodies.
Clinically used heparin does not suppress aPL development in SLE–like autoimmune disease. (A) Anti-CL titers observed over 1 year in a single-center cohort of 46 patients without antithrombotic therapy and under heparin (n = 8) or vitamin K antagonist (VKA) (n = 16) therapy. (B) Serum anti-CL or anti-β2GPI titers in MRL-lpr mice treated for 19 days with NAPc2 or heparin; n = 4 per group, ∗P < .002; 1-way ANOVA. (C) Representative flow cytometry analysis of B1 cells reactive with PL vesicles in the blood of mice treated for 19 days with NAPc2 or heparin. (D) Quantification of CD19+CD43+CD27+ B1 cells reactive with PL vesicle+ or β2GPI+ at day 19 of treatment. Specificity of B1-cell reactivity was demonstrated by competition with the pathogenic target for aPL, sEPCR-LBPA, vs nonmodified sEPCR-PC. Note that PL vesicle and β2GPI staining was also inhibited by the addition of unlabeled alternative antigen (β2GPI or PL, respectively), in line with dual reactive B1 cells (n = 6-9 per group), ∗P < .0001; 1-way ANOVA, compared with saline-treated animals.
Clinically used heparin does not suppress aPL development in SLE–like autoimmune disease. (A) Anti-CL titers observed over 1 year in a single-center cohort of 46 patients without antithrombotic therapy and under heparin (n = 8) or vitamin K antagonist (VKA) (n = 16) therapy. (B) Serum anti-CL or anti-β2GPI titers in MRL-lpr mice treated for 19 days with NAPc2 or heparin; n = 4 per group, ∗P < .002; 1-way ANOVA. (C) Representative flow cytometry analysis of B1 cells reactive with PL vesicles in the blood of mice treated for 19 days with NAPc2 or heparin. (D) Quantification of CD19+CD43+CD27+ B1 cells reactive with PL vesicle+ or β2GPI+ at day 19 of treatment. Specificity of B1-cell reactivity was demonstrated by competition with the pathogenic target for aPL, sEPCR-LBPA, vs nonmodified sEPCR-PC. Note that PL vesicle and β2GPI staining was also inhibited by the addition of unlabeled alternative antigen (β2GPI or PL, respectively), in line with dual reactive B1 cells (n = 6-9 per group), ∗P < .0001; 1-way ANOVA, compared with saline-treated animals.
Discussion
In this study, we show that TF plays a crucial role not only in the pathogenic effects of aPL but also in the development of autoreactive B1 cells in latent viral infection and autoimmune disease. We demonstrate in preclinical proof-of-concept experiments that specific blockade of the TF coagulation initiation complex with the nematode-derived inhibitor, NAPc2 prevents the prothrombotic effects of aPL and attenuates the aPL–induced proinflammatory activation of monocytes. The stabilization of the TF initiation complex by NAPc2 not simply inhibits aPL signaling globally but rather preserves the induction of monocyte IFN responses relevant for antimicrobial host defense. This unique biased antagonistic mechanism of action can explain the previously demonstrated beneficial effects of NAPc2 in attenuating inflammation, whereas preserving antiviral immune defense in lethal Ebola infection in primates.38
Infection with the single-stranded RNA severe acute respiratory syndrome coronavirus 2 is associated with the development of prothrombotic aPL and the appearance of PL-reactive B1 cell in the blood of patients with severe acute COVID-19.20 We, here, demonstrate that infection with the DNA virus mCMV distinctly causes a delayed development of aPL that react with both autoantigens, EPCR-LBPA and β2GPI. The development of aPL in mCMV-infected mice is prevented in EPCRC/S mice defective in LBPA lipid presentation10 or mice lacking the TF cytoplasmic domain, which supports aPL–induced endosomal ROS production.19 Consistently, functional inhibition of TF by NAPc2 not only attenuates aPL–induced endosomal ROS production in monocytes and IFNα secretion in DCs but also the development of aPL. These data provides initial evidence that TF signaling contributes to the development of autoimmune pathologies in persistent viral infections and suggests a potentially beneficial strategy for therapeutic intervention.
TF inhibition by NAPc2 also effectively prevents aPL development in a relevant preclinical model of SLE, implicating TF signaling as a common pathway linking autoimmune and viral pathologies. In both disease models, PL-reactive B1 cells are found in the blood and disappear after pharmacological intervention with NAPc2. Circulating B1 cells also react with the autoantigen β2GPI. Importantly, B1-cell binding of PL vesicles and β2GPI is specifically abolished by competition with EPCR-LBPA. In addition, unlabeled autoantigens crosscompete the B1-cell staining by the other, indicating that the majority of these circulating B1 cells have dual reactivity, previously demonstrated for human aPL.10,46
Therapeutic anticoagulation in APS aims to prevent thromboembolic events but typically fails to attenuate aPL antibody titers. Immunotherapy also has limited effects on aPL antibody titers in contrast to hydroxychloroquine60 that interferes with NADPH-dependent endosomal proinflammatory aPL signaling.61 The challenges in antithrombotic therapy is furthermore highlighted in patients with triple-positive APS who experienced more arterial thromboembolic complications in a randomized trial with oral FXa inhibitors vs vitamin K–antagonist,62 emphasizing on the need for improved therapies. Here, we show that anticoagulation with heparin is ineffective in suppressing the development of circulating autoreactive B1 cells. In contrast, NAPc2 suppresses the appearance of aPL and PL-reactive B1 cells in blood and the peritoneal cavity, a major location for B1 cell in the body. Although NAPc2 has no effect on B1 cells in the bone marrow, NAPc2 increased CD5 expression in peritoneal B1 cells in SLE mice. This finding suggests that innate immune cell targeting by NAPc2 may counteract B1-cell activation and rebalance CD5-dependent regulation of autoimmune pathology.
We have previously shown that specific targeting of the autoantigen EPCR-LBPA attenuates the progression of SLE-like autoimmune pathology.10 Engagement of EPCR-LBPA on DCs sustains a paracrine amplification loop that expands PL-reactive B1 cells and ultimately persistent autoimmune antibody production. Specific targeting of TF in SLE-prone mice also attenuates systemic signs of autoimmune disease and suppresses a proinflammatory gene signature in isolated splenic DCs. Thus, the demonstrated suppression of B1 cell activation leading to aPL production with a clinically well-tolerated TF antagonist44 provides a rationale for therapeutic intervention in patients with severe APS and may have broader therapeutic benefits in the prevention of end organ damage in autoimmune diseases.
Acknowledgments
The authors thank P. Wilgenbus, S. Reyda, and G. Carlino for technical assistance and managing the mouse colonies.
This study was supported by the German Research Foundation (DFG Project Number 318346496, SFB1292/2 TP02 to W.R., TP21 to S.M., TP13 to H.S., and TP11 to N.L.) and (MU4233/1-1 to N.M.-C.), the Humboldt Foundation of Germany (Humboldt Professorship to W.R.), the German Ministry for Education and Technology (Cluster4future curATime to W.R. and N.M.-C.), the German Center for Cardiovascular Research (shared expertise 81X2100161 to N.H. and W.R.), and National Institutes of Health, National Heart, Lung, and Blood Institute grant P01-HL139420 (S.K.). N.L. is a member of the DFG–funded Cluster of Excellence Immunosensation (EXC2151) at the University of Bonn.
Authorship
Contribution: N.M.-C. designed, performed, and analyzed experiments and wrote the manuscript; K.G., T.S.N., M.M., S.M., H.S., K.S., J.R., N.L., and J.W.-M. designed, performed, and analyzed experiments; J.P., J.B., and N.H. provided bioinformatic analysis; S.K., L.T., and K.J.L. provided crucial reagents and expertise; and W.R. conceptualized and directed the study and wrote the manuscript.
Conflict-of-interest disclosure: W.R. is a consultant for ARCA Biopharma. W.R., N.M.-C., K.L., and J.W.-M. are listed as inventors on intellectual properties for the therapeutic use of NAPc2. The remaining authors declare no competing financial interests.
Correspondence: Wolfram Ruf, Center for Thrombosis and Hemostasis, University Medical Center of the Johannes Gutenberg University Mainz, Langenbeckstr 1, 55131 Mainz, Germany;.
References
Author notes
Sequencing data for DCs and monocytes are available at the Gene Expression Omnibus (accession numbers GSE252397 and GSE252972, respectively). All other data and protocols are available on request from the corresponding author, Wolfram Ruf (ruf@uni-mainz.de).
The online version of this article contains a data supplement.
There is a Blood Commentary on this article in this issue.
The publication costs of this article were defrayed in part by page charge payment. Therefore, and solely to indicate this fact, this article is hereby marked “advertisement” in accordance with 18 USC section 1734.

This feature is available to Subscribers Only
Sign In or Create an Account Close Modal