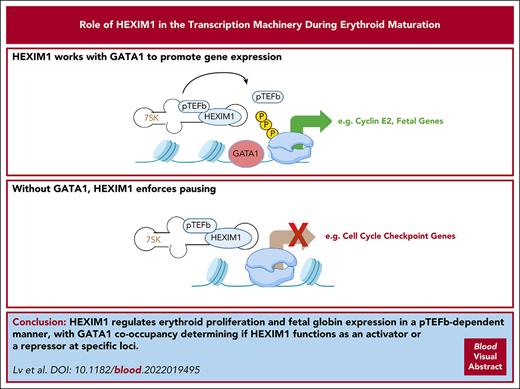
HEXIM1 regulates erythroid proliferation and fetal globin expression in a positive transcription factor β–dependent manner.
GATA1 co-occupancy determines whether HEXIM1 functions as an activator or a repressor at specific loci.
Visual Abstract
Regulation of RNA polymerase II (RNAPII) activity is an essential process that governs gene expression; however, its contribution to the fundamental process of erythropoiesis remains unclear. hexamethylene bis-acetamide inducible 1 (HEXIM1) regulates RNAPII activity by controlling the location and activity of positive transcription factor β. We identified a key role for HEXIM1 in controlling erythroid gene expression and function, with overexpression of HEXIM1 promoting erythroid proliferation and fetal globin expression. HEXIM1 regulated erythroid proliferation by enforcing RNAPII pausing at cell cycle check point genes and increasing RNAPII occupancy at genes that promote cycle progression. Genome-wide profiling of HEXIM1 revealed that it was increased at both repressed and activated genes. Surprisingly, there were also genome-wide changes in the distribution of GATA-binding factor 1 (GATA1) and RNAPII. The most dramatic changes occurred at the β-globin loci, where there was loss of RNAPII and GATA1 at β-globin and gain of these factors at γ-globin. This resulted in increased expression of fetal globin, and BGLT3, a long noncoding RNA in the β-globin locus that regulates fetal globin expression. GATA1 was a key determinant of the ability of HEXIM1 to repress or activate gene expression. Genes that gained both HEXIM1 and GATA1 had increased RNAPII and increased gene expression, whereas genes that gained HEXIM1 but lost GATA1 had an increase in RNAPII pausing and decreased expression. Together, our findings reveal a central role for universal transcription machinery in regulating key aspects of erythropoiesis, including cell cycle progression and fetal gene expression, which could be exploited for therapeutic benefit.
Introduction
Erythropoiesis is the specialized process by which mature red blood cells are made from committed progenitor cells. Effective erythropoiesis requires the coordinated effort of transcriptional and epigenetic regulators as well as precise regulation of RNA polymerase II (RNAPII) levels and activity.1-3 After transcription initiation, RNAPII transcribes 30 to 50 base pairs and becomes phosphorylated on serine 5 of its C-terminus, leading to promoter proximal pausing.4 Phosphorylation of serine 2 on the C-terminal domain of RNAPII by positive transcription elongation factor β (pTEFb) is necessary for RNAPII to resume active transcription elongation.5-7 pTEFb is a dimer composed of cyclin-dependent kinase 9 (CDK9) and cyclin T1 (CCNT1) or CCNT2. HEXIM1 is a well-known regular of pTEFb, and its interaction with pTEFb can have both positive and negative effects on transcription. HEXIM1 was first described as a negative regulator of transcription because HEXIM1 binds to pTEFb in the context of the 7SK small nuclear ribonucleoprotein (snRNP) complex and sequesters it, rendering it inactive. Phosphorylation of HEXIM1 leads to the release of pTEFb from the 7SK–snRNP complex, which facilitates RNAPII pause release.8-11 Although sequestration of pTEFb by HEXIM1 can negatively regulate transcription, the HEXIM1–7SK snRNP can also be targeted to specific genes, making pTEFb available for on-site, efficient activation of RNAPII in response to cellular signals.12-16 Decreased HEXIM1 levels are associated with poor expansion and decreased viability of erythroid progenitors, indicating that HEXIM1 is essential for erythropoiesis.1 Overexpression (OE) of HEXIM1 is associated with enhanced erythroid proliferation, as well as increased expression of GATA1 target genes,1 although the mechanisms underlying these observations are not well understood.
GATA1 is a well-established pioneer transcription factor and, as such, can recognize its consensus sequence even when that sequence is bound into relatively closed chromatin.17-19 GATA1 interacts directly with the basal transcription machinery and is essential for high level expression of erythroid-associated genes, including the globins.20 During embryonic and fetal development, GATA1 is essential for the development of all 3 waves of erythropoiesis (primitive, fetal definitive, and adult definitive), each of which has a distinct gene expression program.21-24 Notably, the expression of hemoglobin is developmentally regulated, and reactivation of fetal hemoglobin is a therapeutic target for the β-globinopathies (as previously reviewed25). The factors that enable GATA1 to establish distinct erythroid transcriptomes at different developmental stages remain incompletely defined.
Here, we demonstrate that HEXIM1 regulates erythroid cell cycle progression by enforcing pausing at cell cycle checkpoint genes and increasing recruitment of RNAPII to genes that promote cell cycle progression. We further demonstrate that HEXIM1 OE facilitates the expression of γ-globin. Together, our findings reveal a central role for universal transcription machinery in regulating key aspects of erythropoiesis, including cell cycle progression and globin gene expression.
Methods
Cell culture
Human umbilical cord blood-derived erythroid progenitor-2 (HUDEP-2) cells were obtained from RIKEN BioResource Center. HUDEP-2 cells were subjected to expansion and maturation as previously described.26 Approximately 500 000 cells were collected for cleavage under targets and release using nuclease (CUT&RUN) analysis. Human CD34+ cells were provided by the Yale Cooperative Center of Excellence in Hematology, and cultured using a semisynchronous culture system, as described previously.1,27 For colony forming assays, 300 cells were plated in methylcellulose-based media and maintained in normoxic conditions (37°C; 5% CO2) for 14 days before quantification.
Generation of stable cell lines
To generate the HEXIM1 OE cell lines, complementary DNA for wild type (WT) HEXIM1 or HEXIM1 harboring the Y271A substitution was cloned into pReceiver-Lv165 OE constructs (GeneCopoeia). The virus was derived and transfected into polyclonal HUDEP-2 cells, as previously described.1 All transduction experiments were performed in parallel at passage numbers of <9. HEXIM1+/− cell lines were constructed as previously described.1,26 CD34+ cells were transduced in the expansion media for colony forming assays, and 1 day after CD36 selection for all other experiments.
CUT&RUN
CUT&RUN assays were performed using the Epicypher CUTANA kit, following the manufacturer’s instructions. The antibodies used are listed in supplemental Table 1, available on the Blood website. Libraries were prepared using NEBNext Ultra II DNA Library Prep kit and sequenced on an Illumina NovaSeq platform in 150–base pair paired-end sequencing mode. CUT&RUN assays on GATA1 were modified based on the previously published library preparation protocol designed for transcription factors.28 All experiments were done in triplicate.
Bioinformatic analyses
Data sets included in this study are listed in supplemental Table 2. Packages and algorithms used in this study have been summarized in supplemental Table 3.
Please see supplemental Material for additional details on methods and bioinformatic analyses.
Results
HEXIM1 OE promotes erythroid proliferation in a pTEFb-dependent manner
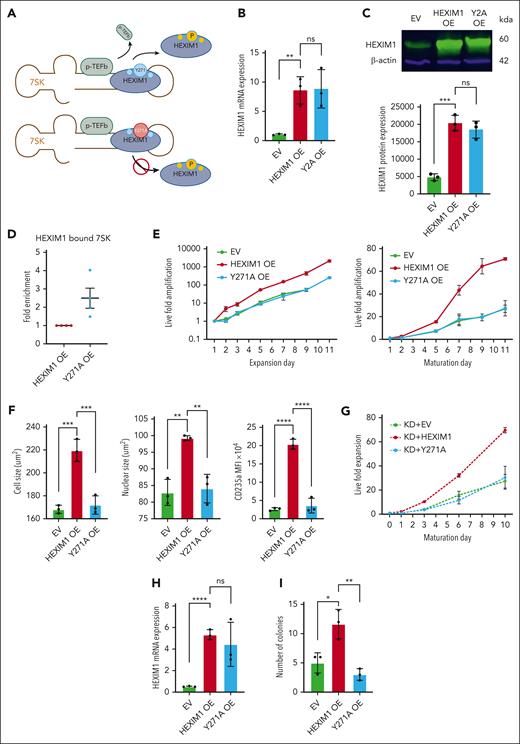
HUDEP-2 cells are an erythroid cell line that proliferate as erythroid precursors and are capable of terminal erythroid maturation.29 HUDEP-2 cells were transduced with WT HEXIM1 or empty vector (EV) control (Figure 1A-C). Consistent with previous studies,1 OE of WT HEXIM1 increased the proliferation of HUDEP-2 cells during both expansion and maturation phases (Figure 1E). The point mutation Y271A impairs the ability of HEXIM1 to be phosphorylated and, thereby, prevents the release of pTEFb from the 7SK ribonucleoprotein complex (as previously reported30; and shown in Figure 1D). This mutation modestly decreased the nuclear localization of CDK9 but did not alter CDK9 or CCNT1 levels (supplemental Figure 1A-B). We transduced HUDEP-2 cells with HEXIM1 Y271A, and it was expressed at similar levels to WT HEXIM1 in the OE cell lines (Figure 1B-C). The Y271A mutation abrogated the ability of HEXIM1 to promote proliferation during both expansion and maturation phases (Figure 1E; supplemental Figure 1C). Imaging flow cytometric analyses demonstrated that WT HEXIM1 OE resulted in a significant increase in both cell and nuclear size as well as glycophorin A (CD235a) expression compared with EV. The Y271A point mutation prevented these changes (Figure 1F). Heterozygous disruption of HEXIM1 using CRISPR–CRISPR-associated protein 9 genome editing resulted in poor expansion of HUDEP-2 cells.1 The OE of WT HEXIM1, but not HEXIM1 Y271A, allowed for robust expansion of HEXIM1 heterozygous HUDEP-2 cells (Figure 1G), suggesting that the effect is dependent on efficient release of pTEFb by HEXIM1.
HEXIM1 promotes erythroid proliferation and survival. (A) Diagram of the 7SK complex and pTEFb with WT HEXIM1 (top) and HEXIM1 Y271A (bottom). Phosphorylation of WT HEXIM1 results in dissociation of HEIXM1 from the 7SK complex and release of pTEFb. The Y271A mutation prevents phosphorylation at a key residue, impairing HEXIM1 dissociation and pTEFb release. (B) HEXIM1 messenger RNA (mRNA) levels in HUDEP-2 cells transduced with EV, HEXIM1 OE, or Y271A OE. Data are presented relative to 18S ribosomal RNA. (C) HEXIM1 protein levels in HUDEP-2 cells transduced with EV, HEXIM1 OE, or Y271A OE. A representative western blot (top) and quantitation (bottom) are shown. (D) RNA immunoprecipitation assay for HEXIM1 WT and the Y271A mutant, confirming increased affinity of the Y271A mutant for the 7SK complex. (E) Live fold expansion of HEXIM1 WT, Y271A, and EV transduced cells in expansion media (left) and maturation media (right). (F) Imaging flow cytometric analyses of HEXIM1 WT, Y271A, and EV cell lines measuring cell size (left), nuclear size (middle), and CD235a expression (right). (G) Live fold expansion of HEXIM1 heterozygous cells transduced with EV, HEXIM1 WT, or Y271A in maturation media. (H) HEXIM1 messenger RNA levels in CD34+ hematopoietic stem and progenitor cells transduced with EV, HEXIM1 WT, or Y271A. Data are presented relative to 18S ribosomal RNA. (I) Erythroid colony-forming ability (burst-forming unit erythroid, and colony-forming unit erythroid) after transduction with EV, HEXIM1 WT, or HEXIM1 Y271A. For all experiments, n = minimum of 3 replicates; ∗P < .05; ∗∗P < .005; ∗∗∗P < .0005; ∗∗∗∗P < .00005.
HEXIM1 promotes erythroid proliferation and survival. (A) Diagram of the 7SK complex and pTEFb with WT HEXIM1 (top) and HEXIM1 Y271A (bottom). Phosphorylation of WT HEXIM1 results in dissociation of HEIXM1 from the 7SK complex and release of pTEFb. The Y271A mutation prevents phosphorylation at a key residue, impairing HEXIM1 dissociation and pTEFb release. (B) HEXIM1 messenger RNA (mRNA) levels in HUDEP-2 cells transduced with EV, HEXIM1 OE, or Y271A OE. Data are presented relative to 18S ribosomal RNA. (C) HEXIM1 protein levels in HUDEP-2 cells transduced with EV, HEXIM1 OE, or Y271A OE. A representative western blot (top) and quantitation (bottom) are shown. (D) RNA immunoprecipitation assay for HEXIM1 WT and the Y271A mutant, confirming increased affinity of the Y271A mutant for the 7SK complex. (E) Live fold expansion of HEXIM1 WT, Y271A, and EV transduced cells in expansion media (left) and maturation media (right). (F) Imaging flow cytometric analyses of HEXIM1 WT, Y271A, and EV cell lines measuring cell size (left), nuclear size (middle), and CD235a expression (right). (G) Live fold expansion of HEXIM1 heterozygous cells transduced with EV, HEXIM1 WT, or Y271A in maturation media. (H) HEXIM1 messenger RNA levels in CD34+ hematopoietic stem and progenitor cells transduced with EV, HEXIM1 WT, or Y271A. Data are presented relative to 18S ribosomal RNA. (I) Erythroid colony-forming ability (burst-forming unit erythroid, and colony-forming unit erythroid) after transduction with EV, HEXIM1 WT, or HEXIM1 Y271A. For all experiments, n = minimum of 3 replicates; ∗P < .05; ∗∗P < .005; ∗∗∗P < .0005; ∗∗∗∗P < .00005.
In primary erythroid progenitors, HEXIM1 expression peaks at approximately the basophilic stage of erythroblast maturation (supplemental Figure 2; and as previously reported24,31). Similar to the effect in HUDEP-2 cells, HEXIM1 promotes the proliferation of primary CD34+-derived erythroid progenitors.1 Furthermore, WT HEXIM1 OE in CD34+ hematopoietic stem and progenitor cells, but not HEXIM1 Y271A or EV, promoted erythroid colony-forming ability (Figure 1H-I).
HEXIM1 promotes the expression of GATA1 target genes, including γ-globin
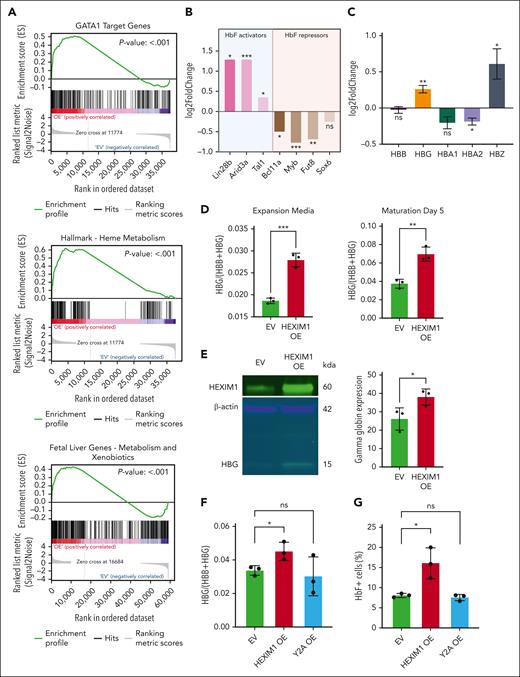
Genes differentially expressed in HUDEP-2 cells after HEXIM1 OE were enriched for the gene sets GATA1 target genes, HIF1α target genes, and hemoglobin metabolic process (P < .001; Figure 2A; supplemental Figure 3). HUDEP-2 cells express β-globin and are used as a model of adult definitive erythropoiesis.29 HEXIM1 OE in HUDEP-2 cells resulted in increased expression of several genes typically expressed at high levels in fetal but not adult cells, including ARID3A and LIN28B. These changes were accompanied by lower levels of BCL11A and MYB, which are typically expressed at higher levels in adult compared with fetal erythroid cells (Figure 2B-C), and the gene set fetal liver genes (P < .001; Figure 2A) was significantly enriched after WT HEXIM1 OE.
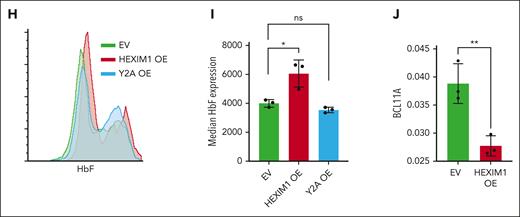
Hexim1 OE promotes fetal globin expression. (A) Selected top enriched gene sets from gene set enrichment analysis including GATA1 target genes, heme metabolism, and fetal liver genes. (B) Expression changes of known regulators of γ production (Lin28b, Arid3a, Tal1, Bcl11a, Myb, Fut8, and Sox6) via RNA sequencing from Murphy et al.1 (C) RNA expression changes of globin genes in HUDEP-2 in HEXIM1 OE cell lines compared with EV controls via RNA sequencing from Murphy et al.1 (D) Ratio of γ-globin to total β-globin transcripts in HUDEP-2 cells in expansion media (left) and at maturation day 5 (right). (E) Western blot of γ-globin levels in HUDEP-2 cells at maturation day 10 in HEXIM1 OE and EV cell lines. A representative western blot (left) and quantification (right) are shown. (F) RNA expression of γ-globin in CD36+ primary erythroblasts. Data are presented relative to 18S ribosomal RNA. (G) Quantification of F-cells in EV, HEXIM1 OE, and Y2A OE lines by fluorescence-activated cell sorting analysis in CD36+ primary erythroblasts. (H) Histogram showing distribution of cells expressing different HbF levels. (I) Median HbF expression of the F-cell population. (J) Bcl11a expression in CD36+ primary erythroblasts in indicated cell lines. Data are presented relative to 18S ribosomal RNA. n = minimum of 3 replicates; ∗P < .05; ∗∗P < .005; ∗∗∗P < .0005. ns, not significant.
Hexim1 OE promotes fetal globin expression. (A) Selected top enriched gene sets from gene set enrichment analysis including GATA1 target genes, heme metabolism, and fetal liver genes. (B) Expression changes of known regulators of γ production (Lin28b, Arid3a, Tal1, Bcl11a, Myb, Fut8, and Sox6) via RNA sequencing from Murphy et al.1 (C) RNA expression changes of globin genes in HUDEP-2 in HEXIM1 OE cell lines compared with EV controls via RNA sequencing from Murphy et al.1 (D) Ratio of γ-globin to total β-globin transcripts in HUDEP-2 cells in expansion media (left) and at maturation day 5 (right). (E) Western blot of γ-globin levels in HUDEP-2 cells at maturation day 10 in HEXIM1 OE and EV cell lines. A representative western blot (left) and quantification (right) are shown. (F) RNA expression of γ-globin in CD36+ primary erythroblasts. Data are presented relative to 18S ribosomal RNA. (G) Quantification of F-cells in EV, HEXIM1 OE, and Y2A OE lines by fluorescence-activated cell sorting analysis in CD36+ primary erythroblasts. (H) Histogram showing distribution of cells expressing different HbF levels. (I) Median HbF expression of the F-cell population. (J) Bcl11a expression in CD36+ primary erythroblasts in indicated cell lines. Data are presented relative to 18S ribosomal RNA. n = minimum of 3 replicates; ∗P < .05; ∗∗P < .005; ∗∗∗P < .0005. ns, not significant.
Because many of these genes regulate fetal globin expression, we evaluated γ-globin expression after HEXIM1 OE, identifying elevated expression of γ-globin RNA and protein in both HUDEP-2 cells and CD36+ primary erythroblasts (Figure 2C-F; supplemental Figure 4A-D). We also observed an increase in ζ-globin, consistent with the reported induction of ζ-globin after downregulation of BCL11A (Figure 2C).32 γ-globin expression in Y271A OE cell lines was similar to that in the EV control (Figure 2F-H; supplemental Figure 4E-G). Because fetal hemoglobin (HbF) is generally distributed in a heterocellular manner, we adopted flow cytometry using an HbF-specific antibody to profile the subset of erythroid cells expressing fetal hemoglobin (F-cells). In both HUDEP-2 cells and CD36+ erythroblasts, transduction of WT HEXIM1 increased the percentage of F-cells (Figure 2G-H; supplemental Figure 4B-C) and increased the median level of HbF expression in the F-cells compared with that of the EV or HEXIM1 Y271A (Figure 2I; supplemental Figure 4G-H). HEXIM1 OE in CD36+ erythroblasts also resulted in decreased BCL11A levels (Figure 2J).
pTEFb inhibition rescues the phenotype of HEXIM1 OE
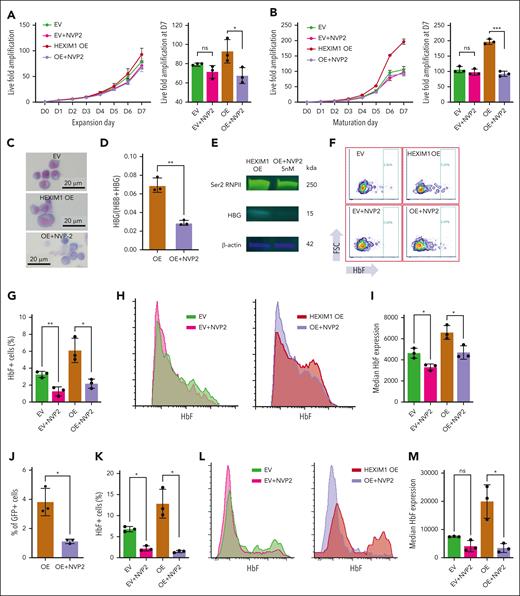
To further test the hypothesis that the effect of HEXIM1 OE is dependent on its ability to release active pTEFb, we used NVP2, a highly selective inhibitor of CDK9.33 Dose response curves demonstrated that HUDEP-2 cells are exquisitely sensitive to treatment with NVP2 (supplemental Figure 5A-D). Although the acute myeloid leukemia cell line MV4-11 can tolerate 75 nM NVP2 without affecting proliferation,34 HUDEP-2 cells had decreased growth at low levels of NVP2 (10 nM; supplemental Figure 5B,D). Treatment of HUDEP-2 cells with 5 nM of NVP2 did not affect expansion or viability of EV HUDEP-2 cells; however, it abrogated the proliferative advantage of HEXIM1 OE cells (Figure 3A-B; supplemental Figure 5E-F). In addition, the morphology of the NVP2-treated HEXIM1 OE cell lines resembled that of the EV control (Figure 3C). NVP2 treatment of HEXIM1 OE HUDEP-2 cells decreased levels of both serine 2–phosphorylated RNAPII and γ-globin (Figure 3D-E; supplemental Figure 5G). NVP2 treatment also decreased the number of F-cells (Figure 3F-H) and the median HbF levels (Figure 3I), supporting that CDK9 activity is necessary for the HEXIM1 OE phenotype.
HEXIM1 OE phenotype is dependent on pTEFb activity. (A-B) Growth curves of HEXIM1 OE and EV cell lines and live fold amplification on day 7 in (A) expansion and (B) maturation media with and without NVP2 treatment. (C) Cytospins on maturation day 10 in EV, HEXIM1 OE, and HEXIM1 OE plus NVP2. (D) γ-globin expression in HEXIM1 OE via quantitative polymerase chain reaction with and without NVP2 treatment. Data are presented relative to 18S ribosomal RNA. (E) Levels of serine-2 (Ser2) RNAPII and (hemoglobin subunit gamma (HBG) in HEXIM1 OE cells with and without NVP2 treatment. (F) HbF-expressing HUDEP-2 cells at maturation day 5 in the indicated cell lines with and without NVP2 treatment via FACS analysis. (G) Quantification of F-cell percentage in the indicated cell lines with and without NVP2 treatment. (H) Distribution of HbF expression level in the indicated cell lines with and without NVP2 treatment. (I) Quantification of the median HbF expression level in the HbF+ population in the indicated cell lines with and without NVP2 treatment. (J) Proportion of green fluorescent protein–positive (GFP+) HEXIM1 OE cells after 2 days of treatment with either NVP2 or dimethyl sulfoxide (DMSO). The number of GFP+ HEXIM1 OE cells was identical before treatment. (K) Proportion of F-cells in GFP+ HEXIM1 OE primary erythroblasts treated with NVP2 or DMSO. (L) Distribution of HbF expression level in the indicated cell lines with and without NVP2 treatment. (M) Median HbF expression levels in GFP+ EV or HEXIM1 OE primary erythroblasts with and without NVP2 treatment. n = minimum of 3 replicates. ∗P < .05; ∗∗P < .005; ∗∗∗P < .0005.
HEXIM1 OE phenotype is dependent on pTEFb activity. (A-B) Growth curves of HEXIM1 OE and EV cell lines and live fold amplification on day 7 in (A) expansion and (B) maturation media with and without NVP2 treatment. (C) Cytospins on maturation day 10 in EV, HEXIM1 OE, and HEXIM1 OE plus NVP2. (D) γ-globin expression in HEXIM1 OE via quantitative polymerase chain reaction with and without NVP2 treatment. Data are presented relative to 18S ribosomal RNA. (E) Levels of serine-2 (Ser2) RNAPII and (hemoglobin subunit gamma (HBG) in HEXIM1 OE cells with and without NVP2 treatment. (F) HbF-expressing HUDEP-2 cells at maturation day 5 in the indicated cell lines with and without NVP2 treatment via FACS analysis. (G) Quantification of F-cell percentage in the indicated cell lines with and without NVP2 treatment. (H) Distribution of HbF expression level in the indicated cell lines with and without NVP2 treatment. (I) Quantification of the median HbF expression level in the HbF+ population in the indicated cell lines with and without NVP2 treatment. (J) Proportion of green fluorescent protein–positive (GFP+) HEXIM1 OE cells after 2 days of treatment with either NVP2 or dimethyl sulfoxide (DMSO). The number of GFP+ HEXIM1 OE cells was identical before treatment. (K) Proportion of F-cells in GFP+ HEXIM1 OE primary erythroblasts treated with NVP2 or DMSO. (L) Distribution of HbF expression level in the indicated cell lines with and without NVP2 treatment. (M) Median HbF expression levels in GFP+ EV or HEXIM1 OE primary erythroblasts with and without NVP2 treatment. n = minimum of 3 replicates. ∗P < .05; ∗∗P < .005; ∗∗∗P < .0005.
To determine whether pTEFb activity is important for the HEXIM1 phenotype in primary cells, CD36-selected cells transduced with WT HEXIM1 were treated with dimethyl sulfoxide or NVP2. After 2 days in erythroid culture there was significantly fewer green fluorescent protein–positive cells in the NVP2 group than in the dimethyl sulfoxide group, indicating that NVP2 abrogated the proliferative advantage associated with HEXIM1 OE (Figure 3J). NVP2 treatment of CD36+ erythroid cells transduced with HEXIM1 also decreased the number of F-cells, as well as the median level of HbF expression in the F-cell population (Figure 3K-M), indicating that the requirement for CDK9 activity to promote γ-globin expression in the context of HEXIM1 OE is not limited to a transformed erythroid cell line.
HEXIM1 regulates erythroid gene expression by controlling RNAPII activity
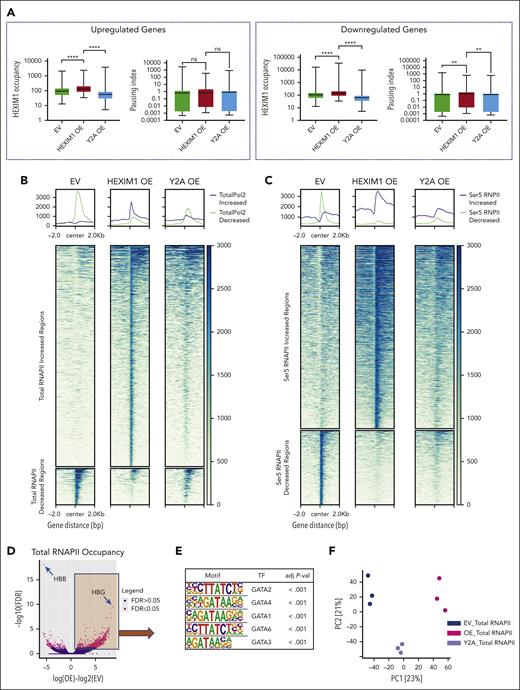
Next, we used CUT&RUN35 to profile HEXIM1 and total and serine 5–phosphorylated RNAPII in HUDEP-2 cells transduced with WT HEXIM1, HEXIM1 Y271A, and EV, and assay for transposase-accessible chromatin with sequencing to profile chromatin accessibility. HEXIM1 was located primarily at promoter regions (supplemental Figure 6A) and was highly correlated with RNAPII occupancy and open chromatin; this correlation increased after HEXIM1 OE (supplemental Figure 6B). Somewhat unexpectedly, HEXIM1 OE cells had increased levels of HEXIM1 at all expressed genes, regardless of whether they were upregulated or downregulated after OE of WT HEXIM1 (Figure 4A; supplemental Figure 6C).
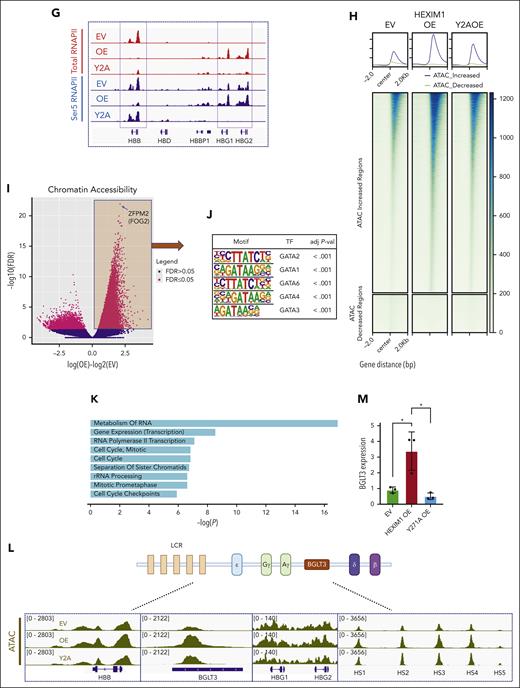
HEXIM1 regulates erythroid gene expression. (A) HEXIM1 occupancy and pausing index (PI) in genes that are upregulated or downregulated in HEXIM1 OE cells. (B-C) Heat maps showing regions that have differential (B) total and (C) serine-5 (Ser5) RNAPII occupancy in EV, HEXIM1 WT OE, and Y271A OE cell lines. (D) Volcano plot of differential total RNAPII occupancy in HEXIM1 OE cells compared with EV controls. (E) Top 5 motifs enriched for genomic regions that significantly gained RNAPII occupancy in HEXIM1 OE lines compared with EV controls. (F) Principal component (PC) analysis plot for total RNAPII in EV, HEXIM1 OE, and Y2A OE cell lines. (G) RNAPII occupancy at the β-globin loci in indicated cell lines. (H) Heat map of differential chromatin accessibility in indicated cell lines. (I) Volcano plot of differential chromatin accessibility in HEXIM1 OE cells. (J) Top 5 motifs enriched for genomic regions that become more accessible in HEXIM1 OE cell lines. (K) Gene ontology categories enriched for regions that become more accessible in HEXIM1 OE cell lines. (L) Chromatin accessibility at the β-globin loci in indicated cell lines. (M) BGLT3 RNA expression in indicated cell lines via quantitative polymerase chain reaction. Data are presented relative to 18S ribosomal RNA. ATAC, assay for transposase-accessible chromatin; LCR, locus control region.
HEXIM1 regulates erythroid gene expression. (A) HEXIM1 occupancy and pausing index (PI) in genes that are upregulated or downregulated in HEXIM1 OE cells. (B-C) Heat maps showing regions that have differential (B) total and (C) serine-5 (Ser5) RNAPII occupancy in EV, HEXIM1 WT OE, and Y271A OE cell lines. (D) Volcano plot of differential total RNAPII occupancy in HEXIM1 OE cells compared with EV controls. (E) Top 5 motifs enriched for genomic regions that significantly gained RNAPII occupancy in HEXIM1 OE lines compared with EV controls. (F) Principal component (PC) analysis plot for total RNAPII in EV, HEXIM1 OE, and Y2A OE cell lines. (G) RNAPII occupancy at the β-globin loci in indicated cell lines. (H) Heat map of differential chromatin accessibility in indicated cell lines. (I) Volcano plot of differential chromatin accessibility in HEXIM1 OE cells. (J) Top 5 motifs enriched for genomic regions that become more accessible in HEXIM1 OE cell lines. (K) Gene ontology categories enriched for regions that become more accessible in HEXIM1 OE cell lines. (L) Chromatin accessibility at the β-globin loci in indicated cell lines. (M) BGLT3 RNA expression in indicated cell lines via quantitative polymerase chain reaction. Data are presented relative to 18S ribosomal RNA. ATAC, assay for transposase-accessible chromatin; LCR, locus control region.
Next, we interrogated the pausing index (PI), which is a ratio of RNAPII levels at the promoter to levels in the gene body.36 There was a significant increase in the PI at genes that are expressed at lower levels in HEXIM1 OE cell lines compared with EV control (Figure 4A). Genes more highly expressed in HEXIM OE cells also gained HEXIM1 occupancy; however, those genes had increased RNAPII occupancy over both the promoter and the gene body, and their PI was unchanged (Figure 4A; supplemental Figure 6D). Because changes in RNAPII pausing did not explain the changes in gene expression at upregulated genes, we sought to further investigate how RNAPII activity is regulated after HEXIM1 OE. Using differential binding analyses, we identified a number of regions that gained RNAPII occupancy (Figure 4B-D) in HEXIM1 OE cells compared with that in the EV control. The top 7 enriched motifs identified at regions that gained RNAPII were GATA1 motifs (Figure 4E; supplemental Figure 7A), whereas regions that lost RNAPII occupancy were enriched for GATA and Krueppel-like factor (KLF) motifs (supplemental Figure 7B). Gene ontogeny analyses of these regions was significant for pathways relating to metabolism, and ribosome function (supplemental Figure 7C-D). Many, but not all, of the changes in RNAPII occupancy were attenuated with the Y271A mutant (Figure 4B-C). Notably, the principal component analysis plot showed 3 distinctive populations separated based on genotype (Figure 4F), with the Y271A cells positioned between the EV and HEXIM1 OE, suggesting that there may be both pTEFb-dependent and -independent effects of HEXIM1 OE on RNAPII occupancy.
The largest change in RNAPII occupancy after HEXIM1 OE was at the β-globin locus, at which RNAPII occupancy was significantly decreased at the β-globin gene and increased at the γ-globin gene. This change was not observed in the HEXIM1 Y271A mutant cell line, suggesting that it is pTEFb dependent (Figure 4G). Interestingly, a similar increase of RNAPII occupancy was seen at ζ-globin, accompanied by a decrease at α-globin (supplemental Figure 8). We also identified increased RNAPII occupancy at other developmentally regulated genes after HEXIM1 OE, including LIN28b, and ARID3a (supplemental Figure 7E). These changes were not present in the HUDEP-2 cells transduced with Y271A HEXIM1. Together, these data suggest that HEXIM1 regulates erythroid gene expression in a context-dependent manner, promoting pausing at some genes and facilitating RNAPII occupancy and increased gene expression at others.
HEXIM1 OE leads to increased chromatin accessibly at BGLT3, a long noncoding RNA that regulates γ-globin expression
Next, we interrogated changes in chromatin accessibility after HEXIM1 OE (Figure 4I-L; supplemental Figure 9A-C). Many more regions gained chromatin accessibility than those that lost it after HEXIM1 OE (Figure 4H-I). GATA1 motifs were significantly enriched in the regions of increased chromatin accessibility, representing 6 of the top 10 motifs identified (Figure 4J; supplemental Figure 9C). In contrast, motifs for the forkhead-box family of transcription factors were enriched in the regions that lost accessibility, and GATA1 was not present in the top 20 enriched motifs (supplemental Figure 9C). Gene ontogeny analyses of regions that gained accessibility was significant for pathways related to transcription and cell cycle control (Figure 4K). Notably, HEXIM1 OE was associated with increased chromatin accessibility at BGLT3, a noncoding RNA located in the β-globin locus, as well as increased BGTL3 expression (Figure 4L-M). Transcription of this noncoding RNA has been shown to increase γ-globin expression,37 consistent with the increased fetal globin expression observed after HEXIM1 OE. The changes in chromatin accessibility and BGLT3 expression were attenuated in the Y271A mutant (Figure 4L-M).
HEXIM1 controls erythroid cell cycle progression by regulating both RNAPII pausing and recruitment
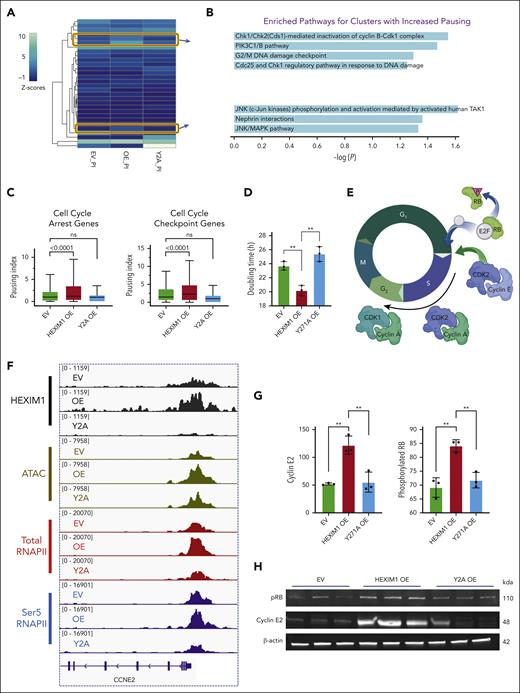
To determine the genes that become more or less paused after HEXIM1 OE, we performed unsupervised k-means clustering on the PI (Figure 5A). At the majority of regions, the PI was similar in all 3 cell lines; however, we identified 2 sets of genes with drastic increase of PI compared with EV or HEXIM1 Y271A. Pathway analyses of these genes revealed enrichment for cell cycle–related pathways (Figure 5A-B). Next, we interrogated the PI over pathways relevant to cell cycle control. Genes included in the MSigDB gene sets “cell cycle checkpoint” and “cell cycle arrest” had significantly more HEXIM1 (supplemental Figure 10A-B) and a higher PI (Figure 5C) in HEXIM1 OE cells than the EV or Y271A OE cell lines, consistent with the enhanced proliferation (Figure 1E) and decreased doubling time (Figure 5D) of HEXIM1 OE cells.
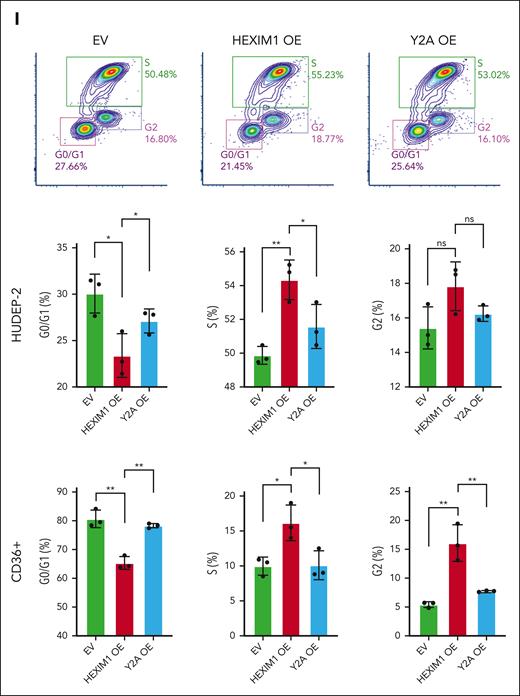
HEXIM1 OE regulates erythroid cell cycle progression by promoting both RNAPII pausing and recruitment. (A) Heat map of paused genes in EV, HEXIM1 OE, and Y271A OE cell lines; values represent z score of the average PI in the corresponding cell line; unsupervised k-means clustering was performed to acquire clusters of genes with different pausing status in each line. (B) Enriched pathways for the clusters of genes with a higher PI in HEXIM1 OE cell lines. (C) PI of gene sets cell cycle arrest genes” and cell cycle checkpoint genes. (D) Doubling time of EV, HEXIM1 OE, and Y2A OE HUDEP-2 cells. (E) Scheme of key regulators of S-phase entry. (F) Changes of chromatin accessibility, HEXIM1, and RNAPII occupancy at CCNE2 via ATAC sequencing and CUT&RUN. (G-H) Representative western blot (G) and quantification (H) of key regulators of G1/S phase progression; additional regulators are shown in supplemental Figure 10E. (I) Cell cycle analyses in HUDEP-2 and CD36+ selected primary erythroblasts via 5-bromo-2-deoxyuridine staining. n = minimum of 3 replicates; ∗P < .05; ∗∗P < .005.
HEXIM1 OE regulates erythroid cell cycle progression by promoting both RNAPII pausing and recruitment. (A) Heat map of paused genes in EV, HEXIM1 OE, and Y271A OE cell lines; values represent z score of the average PI in the corresponding cell line; unsupervised k-means clustering was performed to acquire clusters of genes with different pausing status in each line. (B) Enriched pathways for the clusters of genes with a higher PI in HEXIM1 OE cell lines. (C) PI of gene sets cell cycle arrest genes” and cell cycle checkpoint genes. (D) Doubling time of EV, HEXIM1 OE, and Y2A OE HUDEP-2 cells. (E) Scheme of key regulators of S-phase entry. (F) Changes of chromatin accessibility, HEXIM1, and RNAPII occupancy at CCNE2 via ATAC sequencing and CUT&RUN. (G-H) Representative western blot (G) and quantification (H) of key regulators of G1/S phase progression; additional regulators are shown in supplemental Figure 10E. (I) Cell cycle analyses in HUDEP-2 and CD36+ selected primary erythroblasts via 5-bromo-2-deoxyuridine staining. n = minimum of 3 replicates; ∗P < .05; ∗∗P < .005.
We also noted several cell cycle regulators that gained HEXIM1 occupancy but did not have an increase in pausing after HEXIM1 OE. CCNE2, which promotes transition from G1 to S phase (Figure 5E), was the genomic region that had the most significant gain in HEXIM1 (supplemental Figure 10C). CCNE2 also gained chromatin accessibility and RNAPII occupancy without a change in the PI (Figure 5F; supplemental Figure 10D), and its expression was significantly increased after HEXIM1 OE (Figure 5G-H). The increase in CCNE2 was accompanied by higher levels of phosphorylated retinoblastoma protein (RB) indicating increased G1/S progression (Figure 5G-H). CDK2 and CCNA2 can also interact with CCNE2, but they did not have changes of GATA1 levels or RNAPII activity, and the level of these factors was similar in all cell lines (supplemental Figure 10E-F). GATA1 and RNAPII levels were also similar at CCND3, which regulates the number of cell divisions that erythroid precursors undergo during terminal differentiation.38
Next, we assessed the cell cycle using 5-bromo-2-deoxyuridine incorporation. HEXIM1 OE in HUDEP-2 cells or CD36+ primary erythroid cells resulted in a higher percentage of cells in S phase and a lower number of cells in G0/G1 than EV controls or HEXIM1 Y271A cells (Figure 5I). These data suggest that HEXIM1 levels and RNAPII activity are important regulators of erythroid cell cycle progression, and that HEXIM1 regulates erythroid cell cycle progression both by promoting RNAPII recruitment at genes that facilitate cell cycle progression and by increasing RNAPII pausing at genes that inhibit cell cycle progression.
HEXIM1 OE leads to redistribution of GATA1 occupancy at the β-globin locus
Next, we sought to understand the mechanisms by which HEXIM1 enforces RNAPII pausing in some contexts but promotes RNAPII recruitment in others. Because GATA1 motifs were highly enriched at sites of increased RNAPII occupancy and chromatin accessibility, we used CUT&RUN35 to profile GATA1 occupancy in the WT HEXIM1 OE, Y271A, and EV cell lines (Figure 6A-C). As expected, GATA was the most common motif identified at GATA1 peaks (Figure 6D; supplemental Figure 11E). GATA1 was highly correlated with regions of open chromatin and RNAPII (supplemental Figure 11D) and was more highly correlated with RNAPII than T cell acute lymphocytic leukemia 1 (TAL1) or KLF1 (supplemental Figure 12A), which are other essential erythroid transcription factors.
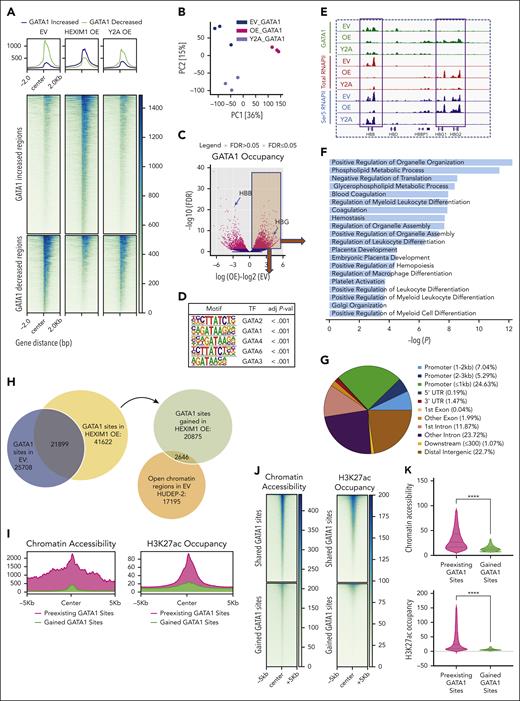
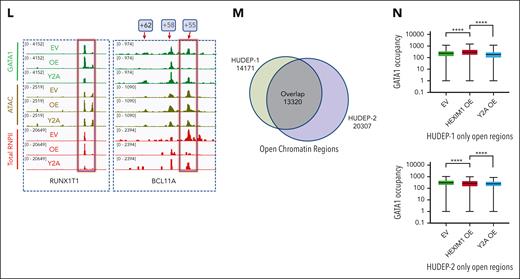
HEXIM1 OE results in redistribution of GATA1 occupancy. (A) Heat map of differential GATA1 occupancy in EV, HEXIM1 OE, and Y271A OE lines. (B) PC analysis plot based on GATA1 occupancy in EV, HEXIM1 OE, and Y271A OE cell lines. (C) Volcano plot of differential GATA1 occupancy in EV and HEXIM1 OE cells. (D) Motif analysis of GATA1 binding sites gained in HEXIM1 OE cells. (E) GATA1, Ser5, and total RNAPII occupancy at the β-globin locus in indicated cell lines. (F) Gene ontology terms enriched for genomic regions that gained GATA1 in HEXIM1 OE cells. (G) Genomic annotation of gained GATA1 binding sites. (H) Venn diagram showing overlap of GATA1 occupancy in HEXIM1 OE and EV lines (left), and chromatin accessibility at GATA1 sites gained in HEXIM1 OE lines (right). (I) Chromatin accessibility levels in WT HUDEP-2 cells at previously established and gained GATA1 sites (left) and H3K27ac occupancy in WT HUDEP-2 cells at previously established and gained GATA1 sites (right). (J) Heat maps showing chromatin accessibility and H3K27ac at gained and shared GATA1 sites in WT HUDEP-2 cells. (K) Quantification of chromatin accessibility (top) and H3K27ac occupancy (bottom) at shared and gained GATA1 sites. (L) Examples of RUNXT1, which gained GATA1 occupancy, chromatin accessibility, and RNAPII occupancy at the promoter region; and BCL11a, which lost both GATA1 and RNAPII occupancy at the well-established +55 enhancer region. (M) Venn diagrams showing the open chromatin regions in HUDEP-1 and HUDEP-2 cell lines. (N) GATA1 occupancy at the HUDEP-1 or HUDEP-2 only open chromatin regions in the EV, HEXIM1 OE, and Y271A OE cell lines. HBB, hemoglobin subunit beta; HBG, hemoglobin subunit gamma; UTR, untranslated region.
HEXIM1 OE results in redistribution of GATA1 occupancy. (A) Heat map of differential GATA1 occupancy in EV, HEXIM1 OE, and Y271A OE lines. (B) PC analysis plot based on GATA1 occupancy in EV, HEXIM1 OE, and Y271A OE cell lines. (C) Volcano plot of differential GATA1 occupancy in EV and HEXIM1 OE cells. (D) Motif analysis of GATA1 binding sites gained in HEXIM1 OE cells. (E) GATA1, Ser5, and total RNAPII occupancy at the β-globin locus in indicated cell lines. (F) Gene ontology terms enriched for genomic regions that gained GATA1 in HEXIM1 OE cells. (G) Genomic annotation of gained GATA1 binding sites. (H) Venn diagram showing overlap of GATA1 occupancy in HEXIM1 OE and EV lines (left), and chromatin accessibility at GATA1 sites gained in HEXIM1 OE lines (right). (I) Chromatin accessibility levels in WT HUDEP-2 cells at previously established and gained GATA1 sites (left) and H3K27ac occupancy in WT HUDEP-2 cells at previously established and gained GATA1 sites (right). (J) Heat maps showing chromatin accessibility and H3K27ac at gained and shared GATA1 sites in WT HUDEP-2 cells. (K) Quantification of chromatin accessibility (top) and H3K27ac occupancy (bottom) at shared and gained GATA1 sites. (L) Examples of RUNXT1, which gained GATA1 occupancy, chromatin accessibility, and RNAPII occupancy at the promoter region; and BCL11a, which lost both GATA1 and RNAPII occupancy at the well-established +55 enhancer region. (M) Venn diagrams showing the open chromatin regions in HUDEP-1 and HUDEP-2 cell lines. (N) GATA1 occupancy at the HUDEP-1 or HUDEP-2 only open chromatin regions in the EV, HEXIM1 OE, and Y271A OE cell lines. HBB, hemoglobin subunit beta; HBG, hemoglobin subunit gamma; UTR, untranslated region.
Similar to RNAPII and chromatin accessibility, more regions gained than lost GATA1 enrichment after HEXIM1 OE, and many of these changes were attenuated with the Y271A mutation (Figure 6A,C). Principal component analyses again demonstrated that the Y271A cell line clustered independently of the EV or HEXIM1 OE cell lines, indicating that HEXIM1 could have both pTEFb-dependent and -independent effects on GATA1 occupancy (Figure 6B). Although the genomic distribution of GATA1 was altered in HEXIM1 OE, the expression of GATA1 RNA and level of GATA1 protein was unchanged (supplemental Figure 11A-B). Similar to the impact of HEXIM1 OE on RNAPII, there was a dramatic change in GATA1 occupancy in the β-globin locus, with GATA1 decreasing at the β-globin gene and increasing at γ-globin (Figure 6E). Pathway analyses of regions that gained GATA1 occupancy were significantly enriched for metabolism and myeloid differentiation (Figure 6F).
Differential GATA1 peaks were located at promoters as well as introns and distal intergenic regions that were likely enhancers (Figure 6G; supplemental Figure 11C-D). The majority of the GATA1 sites gained in HEXIM1 OE cells occurred at regions that lacked the enhancer mark H3K27Ac in untransduced cells and had low levels chromatin accessibility and RNAPII occupancy in EV cells (Figure 6H-K). These regions gained chromatin accessibility and RNAPII occupancy in cells transduced with WT HEXIM1 (Figures 6L and 7B). The changes in GATA1, RNAPII occupancy, and chromatin accessibility were attenuated Y271A OE cells, indicating that at many loci pTEFb activity is important for the gains in RNAPII and GATA1 occupancy and changes in chromatin structure that occur after HEXIM1 OE (Figure 6A,L). In contrast, RNAPII and chromatin accessibility over regions of TAL1 and KLF1 occupancy were similar in all cell lines (supplemental Figure 12B-C), suggesting that HEXIM1 may not modulate the activity of all erythroid transcription factors.
Many other developmentally regulated genes also gained sites of GATA1 occupancy after HEXIM1 OE, including RUNXT1 and pyruvate dehydrogenase kinase (PDK) (Figure 6L; supplemental Figure 11F). Intriguingly, there was a significant loss of both GATA1 and RNAPII occupancy at the well-characterized +55 BCL11A enhancer (Figure 6L) after HEXIM1 OE, consistent with the lower BCL11a expression.39,40 HUDEP-1 cells express γ-globin and are used a model of fetal erythropoiesis. We compared chromatin accessibility in HUDEP-1 and HUDEP-2 cells to identify unique open chromatin regions, which represent putative regulatory elements specific to either fetal or adult erythroid cells (Figure 6M). The open chromatin regions exclusive to fetal cells gained GATA1 after OE of WT HEXIM1 but not HEXIM1 Y271A, whereas the regions exclusive to adult cells had decreased GATA1 occupancy after HEXIM1 OE but not HEXIM1 Y271A (Figure 6N).
Changes in GATA1 occupancy determine whether HEXIM1 promotes RNAPII occupancy or enforces RNAPII pausing
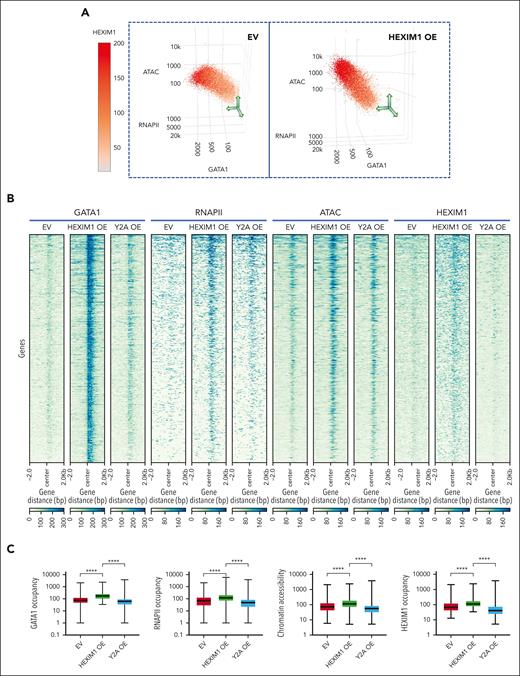
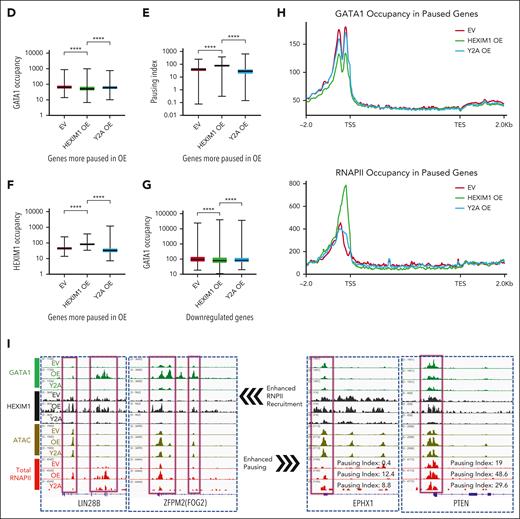
To further investigate the relationship between GATA1 activity and HEXIM1 function, we first created a 3-dimensional correlation plot between HEXIM1, GATA1, RNAPII occupancy, and chromatin accessibility, revealing that HEXIM1 preferably localizes within regions of GATA1 and RNAPII co-occupancy, and accessible chromatin, suggesting its association with active transcription (Figure 7A). We then assessed HEXIM1 levels at the regions that gained GATA1 after HEXIM1 OE. Strikingly, regions that gained GATA1 also gained HEXIM1, RNAPII, and chromatin accessibility (Figure 7B-C,I). Together, these data suggest that HEXIM1 enhances RNAPII occupancy at regions that gain GATA1 after HEXIM1 OE.
Changes in GATA1 occupancy determine whether HEXIM1 promotes RNAPII recruitment or enforces RNAPII pausing. (A) Three-dimensional correlation plot between HEXIM1, GATA1, RNAPII occupancy, and chromatin accessibility. Each dot represents a gene; the red color gradient represents HEXIM1 occupancy; x-axis represents GATA1 occupancy, y-axis represents RNAPII occupancy, and z-axis represents chromatin accessibility. (B) Heat map showing gained GATA1 sites also gained RNAPII and HEXIM1 occupancy and chromatin accessibility in HEXIM1 OE cells. (C) Quantification of changes in GATA1, RNAPII, HEXIM1 occupancy, and chromatin accessibility at gained GATA1 sites. (D-F) GATA1, HEXIM1 occupancy, and PI at genes for which the PI increases more than twofold in the indicated cell lines. (G) GATA1 occupancy at downregulated genes in the indicated cell lines. (H) Profiles of GATA1 and RNAPII occupancy at paused genes. At paused genes there is loss of GATA1 (top). There is also increased ser5 RNAPII at the promoter and decreased ser5 RNAPII in the gene body (bottom), resulting in an increased PI. (I) Examples of enhanced RNAPII recruitment facilitated by increased GATA1 occupancy (left), and enhanced pausing facilitated by decreased GATA1 (right).
Changes in GATA1 occupancy determine whether HEXIM1 promotes RNAPII recruitment or enforces RNAPII pausing. (A) Three-dimensional correlation plot between HEXIM1, GATA1, RNAPII occupancy, and chromatin accessibility. Each dot represents a gene; the red color gradient represents HEXIM1 occupancy; x-axis represents GATA1 occupancy, y-axis represents RNAPII occupancy, and z-axis represents chromatin accessibility. (B) Heat map showing gained GATA1 sites also gained RNAPII and HEXIM1 occupancy and chromatin accessibility in HEXIM1 OE cells. (C) Quantification of changes in GATA1, RNAPII, HEXIM1 occupancy, and chromatin accessibility at gained GATA1 sites. (D-F) GATA1, HEXIM1 occupancy, and PI at genes for which the PI increases more than twofold in the indicated cell lines. (G) GATA1 occupancy at downregulated genes in the indicated cell lines. (H) Profiles of GATA1 and RNAPII occupancy at paused genes. At paused genes there is loss of GATA1 (top). There is also increased ser5 RNAPII at the promoter and decreased ser5 RNAPII in the gene body (bottom), resulting in an increased PI. (I) Examples of enhanced RNAPII recruitment facilitated by increased GATA1 occupancy (left), and enhanced pausing facilitated by decreased GATA1 (right).
Genes that become more paused in HEXIM1 OE cells (more than twofold increase in PI) also gain HEXIM1 but have a dramatic loss of GATA1 (Figure 7D-F,H). Genes downregulated in HEXIM1 OE compared with in EV controls also lost GATA1 (Figures 7G-I and 4A), further suggesting that HEXIM1 promotes RNAPII pausing at regions of low GATA1 occupancy. GATA1 phosphorylation can alter its activity and binding affinity,41-44 and pTEFb has additional phosphorylation targets apart from RNAPII.45,46 We therefore interrogated the possibility that pTEFb directly phosphorylates GATA1 and found that phosphorylated GATA1 levels were similar in all conditions (supplemental Figure 13). Together, these data support a model in which the interplay between GATA1 and HEXIM1 is important for HEXIM1 function, and determines whether it enforces pausing or facilitates RNAPII occupancy and enhances gene expression.
Discussion
Our data demonstrate that HEXIM1 plays a key role in regulating erythroid proliferation and can both promote and repress gene expression. Increased expression of HEXIM1-target genes was associated with GATA1 occupancy and increased RNAPII at the promoter and gene body. The rate of transcription is a balance between initiation, pausing, elongation, and termination, with pause release often acting as the rate-limiting step.47 Increasing the efficiency of pause release, therefore, allows more RNAPII to be recruited to the gene during the transcription cycle, increasing the total amount of RNAPII over the gene without changing the PI. Conversely, loss of GATA1 at HEXIM1-target genes was associated with an increase in the PI and transcriptional repression.
GATA1 is a master transcriptional regulator required for erythropoiesis.21-23,48,49 HEXIM1 OE resulted in a redistribution of GATA1 and RNAPII to a group of loci that are typically occupied by these factors in fetal but not adult erythropoiesis in a pTEFb-dependent manner. pTEFb is a key regulator of RNAPII activity and an important determinant of cellular proliferation and differentiation.50-52 We speculate that differences in pTEFb activity may underlie some differences in fetal vs adult erythropoiesis. The regulation of pTEFb activity is complex, and the factors that regulate pTEFb activity in fetal and adult erythroid cells are not yet well defined. Studies examining the levels and genomic distribution of pTEFb and the factors that regulate its activity, including HEXIM1, in stage-matched sets of fetal and adult erythroid cells are likely to provide important insights into the mechanisms that control developmental gene expression patterns.
The average adult generates 2.5 million red cells every second to avoid the development of anemia as senescent cells are removed from circulation.53 This impressive output must be augmented to respond to anemic or hypoxic stress, a process called stress erythropoiesis. During fetal development, high rates of red cell production are necessary to support rapid growth. There are several parallels between fetal and stress erythropoiesis, including rapid proliferation, increased cell size, and elevated levels of γ-globin expression.54,55 HEXIM1 OE is also characterized by increased cell size, proliferation, and γ-globin expression. These phenotypes were dependent on the ability of HEXIM1 to effectively deliver pTEFb to target genes, because expression of a mutant HEXIM1 (HEXIM1 Y271A) with decreased ability to release pTEFb did not result in a similar phenotype. Furthermore, treatment of HEXIM1 OE cell lines with the CDK9 inhibitor NVP2 rescued both the proliferative advantage and gene expression changes associated with HEXIM1 OE. Release of pTEFb from HEXIM1 and the 7SK complex is mediated by phosphorylation; however, the factors that phosphorylate HEXIM1 in erythroid cells are unknown. Both stress erythropoiesis and fetal erythropoiesis are driven by high levels of erythropoietin,56 making it tempting to further speculate that erythropoietin signaling contributes to HEXIM1 phosphorylation and pTEFb release.
Together, these results highlight the importance of the pathways regulating the basal transcription machinery during erythroid maturation and demonstrate that a fundamental step of the universal transcription machinery can selectively affect the activity of a lineage-specific transcription factor. Further elucidation of this pathway, both during normal erythropoiesis and in the setting of erythroid stress or fetal erythropoiesis, is likely to provide important insights into the regulation of erythropoiesis that could be exploited for therapeutic benefit.
Acknowledgments
This study was supported by the National Institutes of Health (NIH), National Institute of Diabetes and Digestive Kidney Diseases grants DK104920 and DK124777 (L.A.S.) and NIH, National Heart, Lung, and Blood Institute grant HL144436 (L.B.).
Authorship
Contribution: X.L., K.M., and M.G. designed and conducted experiments, analyzed data, and wrote the manuscript; Z.M. and N.R. designed and conducted experiments; Y.N. provided HUDEP-2 cells; L.B., P.G.G., J.P., and N.M., interpreted data and wrote the manuscript; and L.A.S. designed experiments, interpreted data, and wrote the manuscript.
Conflict-of-interest disclosure: The authors declare no competing financial interests.
Correspondence: Laurie A. Steiner, University of Rochester Medical Center, Department of Pediatrics, Center for RNA Biology, University of Rochester, 601 Elmwood Ave, Box 651, Rochester, NY 14534; email: laurie_steiner@urmc.rochester.edu.
References
Author notes
All data have been deposited in the Gene Expression Omnibus database (accession number GSE213220).
The online version of this article contains a data supplement.
There is a Blood Commentary on this article in this issue.
The publication costs of this article were defrayed in part by page charge payment. Therefore, and solely to indicate this fact, this article is hereby marked “advertisement” in accordance with 18 USC section 1734.

This feature is available to Subscribers Only
Sign In or Create an Account Close Modal