

Key Points
Inhibition of translation initiation prevents CLL growth in vitro and in vivo, through targeting the MYC oncogene.
PHBs directly interact with the translation initiation machinery, filling a gap in the understanding of the crucial roles of these proteins.

Abstract
Dysregulation of messenger RNA (mRNA) translation, including preferential translation of mRNA with complex 5′ untranslated regions such as the MYC oncogene, is recognized as an important mechanism in cancer. Here, we show that both human and murine chronic lymphocytic leukemia (CLL) cells display a high translation rate, which is inhibited by the synthetic flavagline FL3, a prohibitin (PHB)-binding drug. A multiomics analysis performed in samples from patients with CLL and cell lines treated with FL3 revealed the decreased translation of the MYC oncogene and of proteins involved in cell cycle and metabolism. Furthermore, inhibiting translation induced a proliferation arrest and a rewiring of MYC-driven metabolism. Interestingly, contrary to other models, the RAS-RAF-(PHBs)-MAPK pathway is neither impaired by FL3 nor implicated in translation regulation in CLL cells. Here, we rather show that PHBs are directly associated with the eukaryotic initiation factor (eIF)4F translation complex and are targeted by FL3. Knockdown of PHBs resembled FL3 treatment. Importantly, inhibition of translation controlled CLL development in vivo, either alone or combined with immunotherapy. Finally, high expression of translation initiation–related genes and PHBs genes correlated with poor survival and unfavorable clinical parameters in patients with CLL. Overall, we demonstrated that translation inhibition is a valuable strategy to control CLL development by blocking the translation of several oncogenic pathways including MYC. We also unraveled a new and direct role of PHBs in translation initiation, thus creating new therapeutic opportunities for patients with CLL.
Introduction
In human chronic lymphocytic leukemia (CLL), the lymph node microenvironment sustains the proliferation of leukemic cells through different stimuli, such as the activation of B-cell receptor (BCR),1 or Toll-like receptors (TLRs).2 Targeting their downstream signaling led to a major breakthrough in the standard of care in CLL.3 The oncogene MYC represents another interesting target in CLL, because MYC aberrations are detected in CLL cells and associated with Richter transformation, a rare but aggressive complication of CLL.4-6 In addition, its expression is upregulated in the lymph node microenvironment,7-9 especially at the translational level.10
Recently, translation initiation was recognized as an Achilles’ heel of cancer cells. Indeed, increase in global translation rate and aberrant translation of specific oncogenic transcripts seems to be a common feature for a large variety of tumors.11,12 Interestingly, translation is also a nexus of resistance to several kinase inhibitors.13 Particularly in CLL, several reports demonstrated a dysregulation of translation, either through mutations in ribosomal proteins14-17 or through activation of translation by microenvironment-mediated stimuli.10,18 In addition, ZAP-70 expression also contributes to aberrant translation through direct interaction with ribosomal proteins.19 The pathways and mechanisms leading to increased translation are not fully understood yet. Some studies demonstrated the efficacy of inhibiting translation in CLL, using different types of translation inhibitors.20-22 However, there is still a debate on the mechanisms of action of the different molecules used, and only little evidence of their efficacy in vivo.
Here, we investigated translation in CLL and its inhibition. We used the translation inhibitor FL3, which has previously shown antitumor activity both in vitro and in vivo.13,23,24 This molecule, from the flavagline family, was shown to bind prohibitins (PHBs).25 These scaffold proteins are found in several cellular sublocalizations that dictate their activity.26 At the membrane, they are required for the RAF activation by RAS in a large variety of cancers,27 leading to the phosphorylation of eukaryotic initiation factor 4E (eIF4E) through the MAPK pathway, and ultimately resulting in increased translation. By binding to PHBs, FL3 was shown to prevent the activation of RAF and therefore decreases translation.28
In the present paper, we showed that aberrant translation is indeed a feature of human and murine CLL. We demonstrated that inhibition of translation in CLL targets the MYC oncogene, leading to decreased proliferative capacities and reversion of metabolic rewiring. Finally, we identified PHBs as direct interactors of the eIF4F machinery and as crucial factors for translation in CLL cells.
Methods
Animal experiments
All experiments involving laboratory animals were conducted in a pathogen-free animal facility with the approval of the Luxembourg Ministry for Agriculture. Mice were treated in accordance with European guidelines. C57BL/6 mice were purchased from Janvier Labs. Eμ-TCL1 mice (called TCL1) were kindly given by Carlo Croce and John Byrd.29 CLL progression was monitored by determining the percentage of CD5+CD19+ CLL cells in the peripheral blood using flow cytometry.
Patient samples
All experiments involving human samples were conducted in accordance with the declaration of Helsinki, approved by the institutional review board (Jules Bordet Institute Ethics Committee) or the Luxembourg Comité National d’Ethique et de Recherche. Samples were collected from patients with CLL after written informed consent. For the cohort of 144 patients used, all patients had a CD19+CD5+CD23+ phenotype and a Catovsky score of 4/5 or 5/5. All tested prognostic factors were proven to be significant predictors of treatment-free survival (TFS) and overall survival (OS), indicating that our cohort is representative of a CLL population (supplemental Table 1, available on the Blood website).
Translation is increased in CLL cells and can be inhibited by FL3. (A) Preranked gene set enrichment analysis (GSEA) from public data sets indicating an enrichment in translation in CLL cells compared with healthy B cells in human (NCBI Gene Expression Omnibus, GSE67640, GSEA, left panel; and EIF4A2 and EIF4G2 gene expression in healthy donor [HD] B cells vs CLL cells, middle panels), and in mouse (GSE175564, TCL1 cells compared with C57BL/6 B cells, right panel). (B) Western-blot analysis of phospho-eIF4E, eIF4E, eIF4A, eIF4G, and HSC70 proteins in B cells from HDs and patients with CLL. (C) Schematic representation of the OPP incorporation assay to evaluate translation rate. (D-F) Determination of translation rate by OPP assay in B cells from HDs and patients with CLL (D, n = 3), in normal B cells and CLL cells from patients with CLL (E, n = 5) and in T- and B-cell subsets from the spleen of sick recipient mice, after transfer of Eμ-TCL1 splenocytes (F, n = 5). Left panel: representative plots; right panel: quantification. (G-I) Determination of translation rate by OPP assay in patients’ CLL cells activated (Activ.) or not (Rest.) with CpG ODN-2006, and treated with dimethyl sulfoxide (DMSO) or 100 nM FL3 for 16 hours (left panel: representative plots; right panel: quantification; n = 21) (G), and in MEC-1 (H) or TCL1-355 (I) cells treated with DMSO or FL3 for 3 hours (0-50 nM) (left panel: representative plots; right panel: quantification; n = 3). (J) Schematic representation of proximity ligation assay (PLA) and determination of translation rate, based on PLA detection of eIF4E/eIF4G interaction, in patient CLL cells activated or not with CpG ODN-2006 and treated with DMSO or 100 nM FL3 for 3 hours (Rest.:858 cells, Activ.: 695 cells, and Activ.+FL3: 357 cells). (K) Schematic representation of polysome profiling, representative plot, and translation efficiency in MEC-1 cells treated with DMSO or 50 nM FL3 for 24 hours.


Multiomics analysis revealed that inhibition of translation affects proteins involved in translation, cell cycle regulation, MYC and other oncogenic pathways. (A) Schematic representation of pulsed SILAC assay. (B) Volcano plot showing differentially translated proteins (DTP) in CpG ODN-2006–activated cells from patients with CLL treated with DMSO or 100 nM of FL3 for 16 hours, with false discovery rate of <0.2 and log2–fold change of >1 (n = 5). (C) Volcano plot showing DTP between MEC-1 treated with DMSO or 50 nM of FL3 for 8 hours, with false discovery rate of <0.05 and log2–fold change of >1. (n = 3). (D) Heatmap depicting the ontology terms enriched in proteins with decreased translation in CpG ODN-2006–activated patient CLL cells, MEC-1 cells, and OSU-CLL cells treated with FL3. (E) Heatmap depicting the upstream factors that regulate the expression of proteins with decreased translation in CpG ODN-2006–activated patient CLL cells, MEC-1 cells, and OSU-CLL cells treated with FL3. (F) Heatmap showing the expression of DTP from selected pathways (identified in panels D-E) in samples from patients with CLL. (G-H) GSEA plots obtained from gene expression data generated from MEC-1 (G) and TCL1-355 cells (H) treated with DMSO or 50 nM FL3 for 24 hours. (I) Transcription factor enrichment analysis (top10) for differentially expressed genes downregulated by FL3. (J) Western-blot analysis of MYC proteins in patient CLL cells activated (Activ.) or not (Rest.) with CpG ODN-2006 and treated with DMSO or FL3 for 24 hours, and in MEC-1 and OSU-CLL cell lines treated for 3h. (K) Myc mRNA levels in cell lines treated with DMSO or 50 nM FL3 for 3 hours by quantitative reverse transcription polymerase chain reaction (qRT-PCR) (n = 3). (L) Myc mRNA ratio of expression in polysome vs subpolysome fractions of cells treated with DMSO or 50 nM FL3 for 24 hours. (M) Heatmap showing GSEA normalized enrichment scores (NES) from polysome profiling RNA sequencing. ∗P < .05, ∗∗P < .01, ∗∗∗P < .001.


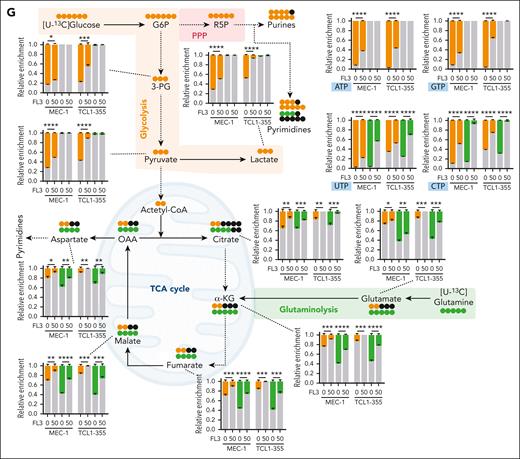
Targeting of MYC translation is associated with decreased proliferative capacities, and reversion of metabolic rewiring. (A) Viability of peripheral blood mononuclear cells from HDs, cells from patients with CLL, MEC-1 cells, and primary Eμ-TCL1 splenocytes treated for 72 hours with FL3 (0-500 nM) assessed by CCK8 assay. (B) Viability of sorted CD19+ B cells from HDs and patients with CLL, treated with FL3 (0-100 nM) for 48 hours (n = 3, Apotracker green and 7AAD staining). (C) Growth of MEC-1 cells treated with FL3 (0-50 nM) for 4 days (n = 3). (D) Growth of MEC-1 cells after drug withdrawal. The cells were treated (red, then green after withdrawal) with 50 nM FL3 or DMSO (blue) for 96 hours, before being washed and resuspended at 0.1 × 10⁶ cells per mL without the drug at day 0. The growth was assessed for 5 days after drug withdrawal. (E) Percentage of apoptotic cells after 3, 24, or 48 hours of treatment with FL3 (0-50 nM) in MEC-1 cells determined by Apotracker green and propidium iodide (PI) staining. (F) Determination of the proliferation of MEC-1 cells based on carboxyfluorescein succinimidyl ester assay (left panel: representative plot, right panel: quantification, n = 3). (G) Metabolomic isotopologue analysis of MEC-1 and TCL1-355 cells treated with DMSO or 50 nM FL3 for 24 hours in the presence of [U-13C]-glucose (orange) and [U-13C]-glutamine (green). Relative metabolic fluxes are indicated with gray for the unlabeled fraction, in orange or green for the labeled fractions (n = 3). ∗P < .05, ∗∗P < .01, ∗∗∗P < .001, ∗∗∗∗P < .0001.

PHBs interact directly with the eIF4F translation initiation machinery, and FL3 binding disrupts this complex. (A) Western-blot analysis of p-RAF1, RAF1, p-ERK1/2, ERK1/2, p-eIF4E, and eIF4E proteins in patient CLL cells activated or not (resting) with anti-immunoglobulin M, and treated with DMSO or 100 nM FL3 for 3 hours, and MEC-1 and TCL1-355 cells treated with 50 nM FL3 for 3 hours. (B-D) MEC-1 cells treated with MNK1/2 inhibitor eFT-508 (0-10 μM) for 24 hours were analyzed by western blot for p-eIF4E and eIF4E levels (B), for proliferation (C), and protein synthesis (D, OPP assay), n = 3. (E-F) Western-blot analysis of p-4E-BP1 and 4E-BP1 (E) and PLA detection of eIF4E/4E-BP1 interaction (DMSO: 583 cells; FL3: 612 cells; n = 3) (F) in MEC-1 cells treated with DMSO or 50 nM FL3 for 3 hours. (G) Schematic representation of DARTS assay (upper panel). PHB and PHB2 stability in presence of pronase in MEC-1 cells treated with DMSO or 100 nM FL3 for 3 hours. Middle panels: % of PHB or PHB2 remaining at different concentrations of pronase, n = 3; lower panel: representative western blot. (H) Western-blot analysis of PHB and PHB2 proteins in HDs and patient CLL cells. (I) PHB gene expression in HD B cells vs CLL cells from patients with CLL (GSE67640 data set). (J) Western-blot analysis of eIF4E and PHB proteins after immunoprecipitation of eIF4E in MEC-1 cells. (K) Western-blot analysis of His-tag, HA-tag, and Myc-tag after immunoprecipitation of His-tag and HA-tag in HEK-293T cells overexpressing His-eIF4G, HA-eIF4E, and Myc-PHB. (L-M) PLA detection of eIF4E/PHB or eIF4G/PHB interactions in cells from patients with CLL that were activated or not with CpG ODN-2006 and treated with DMSO or 100 nM FL3 for 16 hours (K), and MEC-1 cells treated with 50 nM FL3 for 3 hours (left panel: representative image; right panel: quantification; L, upper: Rest.: 1147 cells, Activ.: 1223 cells, Activ+FL3: 1097 cells; L, lower: Rest.: 1297 cells, Activ.: 1195 cells, Activ+FL3: 1155 cells; M, upper: DMSO: 419 cells, FL3: 411; M, lower: DMSO: 53, FL3: 52; n = 3). (N) Schematic representation of NanoBRET assay and BRET ratio measured in HEK-293T cells transfected with increasing amounts of plasmids encoding PHBs fused with the nanoluciferase (NLF) and either eIF4E or HT fused with the NG. ∗P < .05, ∗∗∗P < .001, ∗∗∗∗P < .0001. ND, not digested.


Silencing of PHBs inhibits translation and replicates the effects of FL3 treatment. MEC-1 cells were transfected with plasmids encoding short hairpin RNA (shRNA) against Scramble (shCtrl), PHB (shPHB), and PHB2 (shPHB2) and analyzed 72 to 96 hours after transfection. (A) Gene expression measured by qRT-PCR (72 hours, n = 3). (B) Determination of translation rate (OPP assay, 72 hours, n = 3). (C) PLA detection of eIF4E/eIF4G interaction (72 hours; shCtrl: 117 cells; shPHB: 127 cells; and shPHB2: 92 cells; n = 3). (D) Growth of cells up to 96 hours after transfection (n = 4). (E) Determination of proliferation (carboxyfluorescein succinimidyl ester assay, 96 hours, n = 3). (F) Western-blot analysis of MYC protein (72 hours). (G) Metabolomic isotopologue analysis of cells (72 hours, tracers incubated after 48 hours) in the presence of [U-13C]-glucose (orange) and [U-13C]-glutamine (green). Relative metabolic fluxes are indicated with gray for the unlabeled fraction, in orange or green for the labeled fractions. ∗P < .05, ∗∗P < .01, ∗∗∗P < .001, ∗∗∗∗P < .0001.


FL3 alone, or in combination with immunotherapy, controls CLL development in vivo. (A-B) Percentage (A) and number (B) of CD19+CD5+ CLL cells in the peripheral blood (PB) of C57BL/6 mice after adoptive transfer of splenocytes from a sick Eμ-TCL1 mouse, and treated with vehicle (n = 9) or FL3 (n = 8). (C) Survival of mice from panels A-B. (D) Percentage of CLL cells (CD19+CD5+), B cells (CD19+CD5−), CD8+ T cells (CD3+CD8+), CD4+ T cells (CD3+CD4+), and Tregs (CD4+FOXP3+) in the spleen of mice treated with vehicle or FL3, 17 days after adoptive transfer of splenocytes from a sick Eμ-TCL1 mouse (n = 5). (E) Determination of the translation rate in cells from panel D. (F) Determination of the translation rate in PD-L1high or PD-L1low CD19+CD5+ CLL cells from the spleen of C57BL/6 mice after TCL1 adoptive transfer (n = 4). (G-H) Percentage of CLL cells in the blood at the indicated time points (G) and the spleen at euthanasia (H) of C57BL/6 mice after adoptive transfer of splenocytes from a sick Eμ-TCL1 mouse, and treated with vehicle, FL3, anti-PD1 antibody, or the combination FL3/anti-PD1. ∗P < .05, ∗∗P < .01, ∗∗∗P < .001, ∗∗∗∗P < .0001.
FL3 alone, or in combination with immunotherapy, controls CLL development in vivo. (A-B) Percentage (A) and number (B) of CD19+CD5+ CLL cells in the peripheral blood (PB) of C57BL/6 mice after adoptive transfer of splenocytes from a sick Eμ-TCL1 mouse, and treated with vehicle (n = 9) or FL3 (n = 8). (C) Survival of mice from panels A-B. (D) Percentage of CLL cells (CD19+CD5+), B cells (CD19+CD5−), CD8+ T cells (CD3+CD8+), CD4+ T cells (CD3+CD4+), and Tregs (CD4+FOXP3+) in the spleen of mice treated with vehicle or FL3, 17 days after adoptive transfer of splenocytes from a sick Eμ-TCL1 mouse (n = 5). (E) Determination of the translation rate in cells from panel D. (F) Determination of the translation rate in PD-L1high or PD-L1low CD19+CD5+ CLL cells from the spleen of C57BL/6 mice after TCL1 adoptive transfer (n = 4). (G-H) Percentage of CLL cells in the blood at the indicated time points (G) and the spleen at euthanasia (H) of C57BL/6 mice after adoptive transfer of splenocytes from a sick Eμ-TCL1 mouse, and treated with vehicle, FL3, anti-PD1 antibody, or the combination FL3/anti-PD1. ∗P < .05, ∗∗P < .01, ∗∗∗P < .001, ∗∗∗∗P < .0001.

Expression of translation-related genes correlates with disease progression and poor survival in patients with CLL. Gene expression analysis was performed by qRT-PCR for 8 genes involved in translation in a cohort of 144 patients with CLL. The relationship between gene expression and survival was evaluated by Cox univariate regression analysis. Gene expression in clinical groups was evaluated by differential expression analysis for single genes or by logistic regression (LR) analysis for multiple genes. (A,E) Calculated HRs >1 (red dots, P value <.05) indicate an increased risk for patients with high single-gene expression in term of OS (A) and TFS (E). (B,F) Relation between high or low eIF4E2 gene expression and OS (B) or TFS (F). Low and high groups are of identical size (n = 72). (C) Relationship between high or low combined 8-gene expression and OS. (D) Calculated HRs >1 (red dots, P value <.05) indicate an increased risk for patients with high multiple gene expression in term of OS. (G) Standardized expression of single genes in groups of patients based on prognostic markers (CytoG unfav.: cytogenetics unfavorable; group size indicated in each panel). (H-I) Relation between high or low eIF4E2 gene expression and OS in patients with IGHVUM or LPL+ CLL (H), and TFS in patients with Binet A CLL (I). ∗P < .05, ∗∗P < .01, ∗∗∗P < .001.
Expression of translation-related genes correlates with disease progression and poor survival in patients with CLL. Gene expression analysis was performed by qRT-PCR for 8 genes involved in translation in a cohort of 144 patients with CLL. The relationship between gene expression and survival was evaluated by Cox univariate regression analysis. Gene expression in clinical groups was evaluated by differential expression analysis for single genes or by logistic regression (LR) analysis for multiple genes. (A,E) Calculated HRs >1 (red dots, P value <.05) indicate an increased risk for patients with high single-gene expression in term of OS (A) and TFS (E). (B,F) Relation between high or low eIF4E2 gene expression and OS (B) or TFS (F). Low and high groups are of identical size (n = 72). (C) Relationship between high or low combined 8-gene expression and OS. (D) Calculated HRs >1 (red dots, P value <.05) indicate an increased risk for patients with high multiple gene expression in term of OS. (G) Standardized expression of single genes in groups of patients based on prognostic markers (CytoG unfav.: cytogenetics unfavorable; group size indicated in each panel). (H-I) Relation between high or low eIF4E2 gene expression and OS in patients with IGHVUM or LPL+ CLL (H), and TFS in patients with Binet A CLL (I). ∗P < .05, ∗∗P < .01, ∗∗∗P < .001.
OPP protein synthesis assay
O-propargyl-puromycin (OPP, Bioconnect) was added into cell culture at a final concentration of 20 μM for 30 minutes. The viability staining was performed at 4°C for 30 minutes with a Zombie Fixable Viability kit (BioLegend). The cells were fixed for 15 minutes at room temperature with 3.7% paraformaldehyde, and permeabilized with 0.5% Triton X-100 in phosphate-buffered saline for 15 minutes at room temperature. The detection of the OPP was performed per the manufacturer’s protocol, using the Click-iT technology (Life Technologies). The cells were further subjected to antibody staining and analyzed by flow cytometry.
Pulsed SILAC assay
The stable isotope labeling by amino acids in cell culture (SILAC) labeling medium used was the following: RPMI 1640 for SILAC (Thermofisher) containing 10% of dialyzed serum, 1% of penicillin/streptomycin, unlabeled leucine, and either “heavy” amino acids [0.398 mM L-(13C6,15N4)-arginine and 0.798 mM L-(13C6,15N2)-lysine] or “medium-heavy” amino acids [0.398 mM L-(13C6)-arginine and 0.798 mM L-(D4)-lysine]. MEC-1 or OSU-CLL cells (10 × 106) were resuspended at a concentration of 0.6 × 10⁶ cells per mL, and treated as indicated for 8 hours. Cells (20 × 106) from patients with CLL were resuspended at a concentration of 10 × 106 cells per mL, and treated as indicated for 16 hours. At the end of the labeling, the cells were washed 3 times in cold phosphate-buffered saline and snap frozen, before proceeding to protein extraction and to mass spectrometry analysis.
The detailed material and methods can be found as supplemental Information.
Results
Translation is increased in CLL cells and can be inhibited by FL3
First, using publicly available gene expression data sets, we showed that translation-related genes are upregulated in leukemic B cells compared with healthy B cells, in both human and mice, resulting in a functional enrichment in translation (Figure 1A). We also observed increased levels of proteins responsible for translation initiation in CLL cells from patients (Figure 1B). Therefore, we quantified translation by OPP incorporation (Figure 1C) and confirmed that protein translation is increased in CLL cells compared with B cells from healthy donors and from patients with CLL (Figure 1D-E). To investigate whether an increased translation is also a feature observed in a murine model of CLL, we analyzed the translation rate in different cell populations from the spleen of mice with leukemia. We observed a higher translation rate in CLL cells (CD19+CD5+) compared with normal B cells (CD19+CD5−) and with both CD8+ and CD4+ T lymphocytes. Interestingly, FOXP3+ regulatory T cells (Tregs) also showed a higher translation rate compared with other T cells (Figure 1F). Next, to verify that TLR and BCR activation induce translation, we treated CLL cells with the TLR9-agonist Class B CpG ODN-2006 or with an anti-immunoglobulin M antibody. Indeed, the cellular activation increased translation, as attested by increased OPP incorporation (Figure 1G; supplemental Figure 1A). In addition, we showed that treatment of patient samples with the synthetic flavagline FL3 decreased translation (Figure 1G; supplemental Figure 1A). Accordingly, in human (MEC-1, OSU-CLL, HG-3, WA-OSEL, and PGA-1) and murine (TCL1-355)30 CLL cell lines, incubation with FL3 led to a significant decrease in translation, starting from 6 nM FL3, after only 3 hours of treatment (Figure 1H-I; supplemental Figure 1B-F). The reduction in translation after FL3 treatment was also confirmed by measuring the incorporation of the methionine analog L-propargylglycine (supplemental Figure 1G). Active translation is characterized by the interaction between the translation initiation factors eIF4E and eIF4G, which can be detected by proximity ligation assay (Figure 1J). Indeed, we observed an increased interaction between eIF4E and eIF4G in activated CLL cells from patients and CLL cell lines, which was decreased upon FL3 treatment (Figure 1J; supplemental Figure 1H-I). Finally, the effect of FL3 on translation was analyzed by polysome profiling. We observed a decreased polysome peak amplitude and an accumulation of RNA in subpolysome fractions, demonstrating a significant reduction in translation efficiency (Figure 1K; supplemental Figure 1J). Altogether, these results confirm the relevance of studying translation in CLL, and demonstrates that FL3 can efficiently inhibit translation in human and murine CLL cells.
Multiomics analysis revealed that inhibition of translation affects proteins involved in translation, cell cycle regulation, MYC, and other oncogenic pathways
Because flavaglines were shown to reprogram the translational landscape rather than completely inhibit protein translation,31 we wanted to understand more precisely the effect of FL3 in CLL cells. For this purpose, we performed pulsed SILAC assay on 5 patient samples and CLL cell lines (Figure 2A). First, we confirmed the increase in protein synthesis after activation in CLL cells from patients, representing 16% of the detected proteins (supplemental Figure 2A-B; supplemental Table 2). This includes proteins involved in translation and activating signaling pathways (supplemental Figure 2C). In resting samples, FL3 treatment led to decreased protein synthesis for 17% of the detected proteins (supplemental Figure 2B-D; supplemental Table 2). However, the effect was more striking when CLL cells were activated and treated with FL3, with 31% of the detected proteins showing a decrease in their translation rate (Figure 2B; supplemental Figure 2B-E; supplemental Table 2). Treatment of MEC-1 and OSU-CLL cell lines led to a similar effect (51% and 30%, respectively, of the detected proteins) (Figure 2C; supplemental Figure 2B-F; supplemental Table 3). The ontology analysis revealed that FL3 treatment affected common pathways in patient samples and cell lines, including proteins involved in translation and cell cycle regulation (Figure 2D; supplemental Figure 2G). In addition, proteins regulated by several known oncogenes in CLL, such as the targets of MYC and NFκB, displayed a decreased synthesis (Figure 2E-F). Thus, our pulsed SILAC experiments suggest a decreased MYC activity in FL3-treated cells. Translation of MYC is reportedly increased upon CLL stimulation, contributing to leukemia development and proggression.18 RNA sequencing followed by gene set enrichment analysis confirmed the repression of translation-related genes and MYC target genes in FL3-treated cells (Figure 2G-H; supplemental Figure 2H; supplemental Table 4). Furthermore, transcription factor enrichment analysis confirmed the involvement of MYC/MAX in the regulation of these repressed genes by FL3 (Figure 2I). Ontology analysis indicated that deregulated MYC target genes were mainly involved in metabolism-related biological processes (supplemental Figure 2I-J). We thus hypothesized that FL3 could directly inhibit MYC translation (undetectable in pulsed SILAC assay). Indeed, treatment with FL3 resulted in a rapid loss of the MYC protein (Figure 2J; supplemental Figure 2K), whereas its messenger RNA (mRNA) level was increased (Figure 2K). In addition, FL3 led to decreased levels of other oncogenes, such as ETS-1 (supplemental Figure 2L-M). Finally, polysome profiling confirmed the lower abundance of Myc transcripts in the polysome fraction of both human and murine cells treated with FL3 (Figure 2L; supplemental Table 4), confirming the reduction in MYC translation. Preranked gene set enrichment analysis indicated that FL3 predominantly repressed translation of genes involved in metabolism (glycolysis, fatty acid metabolism, and oxidative phosphorylation; Figure 2M).
Altogether, these data show that FL3 specifically inhibits the translation of proteins involved in translation, cell cycle regulation, and MYC oncogenic pathways.
Targeting of MYC translation is associated with decreased proliferative capacities, and reversion of metabolic rewiring
Based on the aforementioned results, we decided to investigate the biological consequences of inhibiting translation. First, we measured cell viability of CLL cells, healthy peripheral blood mononuclear cells, MEC-1 and Eμ-TCL1 primary murine cells (Figure 3A; supplemental Figure 3A). Interestingly, healthy peripheral blood mononuclear cells were less sensitive to FL3 compared with patient leukemic cells (50% inhibitory concentration at 72 hours: 118.2 and 11.7 nM, respectively). In addition, FL3 induced more cell death in CLL cells from patients than in B cells from healthy donors at the same dose (Figure 3B), confirming the therapeutic window for treating CLL with inhibitors of translation. Cell growth of human and murine CLL cell lines was strongly impaired by very low doses of FL3 (from 6 nM, Figure 3C; supplemental Figure 3B). Drug withdrawal experiments indicated that 4 days of treatment were necessary for total impairment of cell recovery (Figure 3D; supplemental Figure 3C). We also showed a limited effect of FL3 on apoptosis at an early time point, appearing only for higher doses and after 48 hours of treatment (Figure 3E; supplemental Figure 3D). On the contrary, carboxyfluorescein succinimidyl ester assay revealed a block of proliferation even with low FL3 doses (Figure 3F; supplemental Figure 3E). However, no difference in cell cycle phase distribution was observed, indicating a complete block of the cell cycle rather than the inhibition of a specific phase (supplemental Figure 3F). The decreased expression of several targets involved in cell proliferation (CDK4, BIRC5, and MCL1) in cells treated with FL3 was validated at protein level (supplemental Figure 3G).
Data in Figure 2 strongly suggest impairment of cell metabolism as majority of the MYC target genes, which show decreased transcription/translation, are associated with metabolic pathways. We performed stable isotope tracing using [U-13C]-glucose and [U-13C]-glutamine (Figure 3G). After [U-13C]-glucose tracing (depicted in orange), we observed a reduction in glycolytic flux and pyruvate dehydrogenase (PDH) flux (Figure 3G; supplemental Figure 3H). The pentose phosphate pathway and purine/pyrimidine synthesis were also affected by FL3 (Figure 3G), contributing to the block in proliferation observed in previous experiments. In addition, the production of lactate from pyruvate is decreased in FL3-treated cells (Figure 3G), because lactate dehydrogenase-A, the enzyme catalyzing this reaction and target of MYC, was also decreased (supplemental Figure 3G). [U-13C]-glutamine tracing (in green), revealed that FL3 inhibits glutaminolysis, in line with the role of MYC in this context.32,33 In addition, the tricarboxylic acid cycle activity was markedly reduced (Figure 3G; supplemental Figure 3I). As expected, after translation inhibition, we observed an accumulation of proteinogenic amino acids after FL3 treatment (supplemental Figure 3J). To confirm the involvement of MYC in the metabolic reprogramming observed upon FL3 treatment, we used specific inhibitors (10058-F4 and 10074-G5) that block MYC transcriptional activity. We validated their efficacy in our cells (supplemental Figure 3K) and repeated the metabolic tracing. MYC inhibition led to similar metabolic changes to those after FL3 treatment, except for glycolysis (supplemental Figure 3L-M). This suggests that FL3-mediated metabolism rewiring is mainly owing to MYC inhibition but other proteins may also contribute partially to this effect.
In conclusion, through the targeting of MYC and other factors, FL3 treatment leads to the arrest of the proliferative capacities of CLL cells and results in major changes in cellular metabolism.
PHBs interact directly with the eIF4F translation initiation machinery, and FL3 binding disrupts this complex
Next, we investigated FL3’s mechanism of action in CLL cells. Through its binding to PHBs, FL3 was shown to block RAS-RAF-MAPK pathway activation.27,34 In CLL cells from patients, activation led to increased phosphorylation of RAF1, extracellular signal-regulated kinase (ERK)1/2, and eIF4E (Figure 4A; supplemental Figure 4A). Surprisingly, the phosphorylation of RAF1 and ERK1/2 was further increased upon FL3 treatment, whereas eIF4E phosphorylation was decreased (Figure 4A; supplemental Figure 4A-B), demonstrating that translation inhibition was not caused by the impairment of RAF1-ERK1/2 signaling. To understand whether the decrease in eIF4E phosphorylation is responsible for the phenotype observed in FL3-treated cells, we used the MAP kinase–interacting kinases (MNK) inhibitors eFT-508 (Tomivosertib) and CGP57380, because MNK1/2 are the main kinases that phosphorylate eIF4E.35 Treatment with inhibitors completely abolished eIF4E phosphorylation without affecting cell growth and translation rate (Figure 4B-D; supplemental Figure 4C-H), showing that eIF4E phosphorylation status is not responsible for the decreased translation observed upon FL3 treatment. In addition, phosphorylation of MNK is not affected by FL3 treatment (supplemental Figure 4I). 4E-BP1 is a major repressor of translation by complexing with eIF4E.36 Phosphorylation of 4E-BP1 upon activation of the mTORC1 pathway leads to decreased interaction with eIF4E, promoting translation initiation.37 We observed that p-4E-BP1 and 4E-BP1 protein levels were unaffected by FL3, and the interaction between eIF4E and 4E-BP1 was even slightly decreased upon FL3 treatment (Figure 4E-F; supplemental Figure 4J-K). Cap-binding assay indicated that FL3 does not impair eIF4E binding to the cap but strongly reduces the ability of eIF4G to interact with cap-bound eIF4E, with no effect on 4E-BP1 (supplemental Figure 4L). These data suggest a direct targeting of the eIF4F translation initiation complex by FL3, rather than deregulation of upstream signaling pathways.
Using drug affinity responsive target stability (DARTS) assay, we confirmed that FL3 binds to PHBs in CLL cells (Figure 4G), but not to eIF4A (supplemental Figure 4M), which was shown to be the target of other flavaglines such as rocaglamide A (RocA) or silvestrol.23,26,38 In addition, we tested whether other molecules targeting PHBs, not related to flavaglines, such as IN44 and fluorizoline, were associated with a defect in translation. Indeed, treatment of CLL cells with IN44 and fluorizoline at sublethal doses was associated with a decreased translation rate (supplemental Figure 4N-O). Altogether, these data point to a direct role of PHBs in the translation initiation machinery. In addition, we quantified PHB levels in patient cells and observed that PHBs are more abundant in CLL cells than in healthy donor B cells, both at mRNA and protein levels (Figure 4H-I).
Considering all these results, we hypothesized that PHBs interact with the translation initiation machinery. By immunoprecipitation of the endogenous eIF4E protein in MEC-1 cells, and of the tagged version of eIF4E and eIF4G in transfected HEK-293T cells, we showed their interaction with PHB (Figure 4J-K). Using a proximity ligation assay, we demonstrated the cytoplasmic interaction of PHB and PHB2 with eIF4E, eIF4G, and eIF4A in CLL cells from patients and MEC-1 cells (Figure 4L-M; supplemental Figure 4P-T). Interestingly, these interactions increased upon activation, and decreased upon treatment with FL3. To understand the stoichiometry of these interactions, we performed NanoBRET experiments (Figure 4N). Bioluminescence resonance energy transfer (BRET) ratios were measured in HEK-293T cells transfected with plasmids encoding PHB fused with the nanoluciferase and either eIF4E or HaloTag (HT, control) fused with the NeonGreen (NG), in N- or C-terminal. The higher ratio observed when using PHB(nanoluciferase) and eIF4E(NG), compared with HT(NG), indicates that PHB and eIF4E indeed interact (supplemental Figure 4U). The plateau reached when using increasing amounts of NG-eIF4E, and the linear curve when using the NG-HT control, confirmed the specificity of the observed interaction (Figure 4N). These experiments proved the interaction of PHB with the eIF4F complex.
Finally, we used the other flavaglines RocA and silvestrol, known to destabilize the eIF4F complex by binding to eIF4A. Both molecules decreased translation rate and cell proliferation, similar to FL3 treatment; however, they induced much higher rates of apoptosis (supplemental Figure 4V-X). In addition, they led to decreased phosphorylation of eIF4E, without affecting the RAF/ERK pathway (supplemental Figure 4Y), which is comparable with FL3 treatment. The similarity between FL3 and RocA/silvestrol confirms that FL3 also destabilizes the eIF4F complex but through binding to PHBs instead of eIF4A.
Silencing of PHBs inhibits translation and replicates the effects of FL3 treatment
The interaction of PHBs with the members of the translation initiation machinery strongly suggests a direct role of PHBs in translation. To validate this hypothesis, we knocked down (KD) PHBs using short hairpin RNA against either PHB or PHB2, as validated at the mRNA and protein levels (Figure 5A; supplemental Figure 5A-C). First, we investigated translation and protein interactions and we could confirm that PHBs KD decreased translation rate in CLL cells, reduced the formation of the eIF4E/eIF4G complex, and inhibited eIF4E phosphorylation (Figure 5B-C; supplemental Figure 5D-E). In addition, PHBs KD was associated with a decrease in cell growth and proliferation (Figure 5D-E), but not inducing cell death (supplemental Figure 5F). KD of PHBs was also associated with a decrease in MYC expression and activity (Figure 5F; supplemental Figure 5G). Finally, we repeated the targeted metabolomics analysis with glucose or glutamine tracing in PHBs KD cells. We observed an impact of the KD similar to treatment with FL3, as exemplified by a reduction in glycolysis and the tricarboxylic acid cycle, a decreased synthesis of purines and pyrimidines (Figure 5G), and an accumulation of proteinogenic amino acid (supplemental Figure 5H). In conclusion, KD of PHBs replicated all the effects observed with FL3. Altogether, using different experimental strategies, we demonstrated, to the best of our kowledge, for the first time, a direct role for PHBs in translation.
FL3 alone, or in combination with immunotherapy, controls CLL development in vivo
Next, we tested the efficiency of translation inhibition to control CLL development in vivo. For this, we performed adoptive transfer of Eμ-TCL1 splenocytes into C57BL/6 mice and treated recipient mice with FL3 or vehicle. The analysis of CD19+CD5+ CLL cells in the peripheral blood indicated that FL3 treatment significantly controlled the development of the disease (Figure 6A-B). This correlated with an increased survival of the mice (median survival of 62 days in FL3-treated mice vs 48 days in vehicle-treated mice, Figure 6C). In a second independent cohort, we analyzed the splenocytes after 15 days of treatment. The percentage of CLL cells in the spleen was again significantly decreased (Figure 5D), confirming the efficiency of FL3 to control CLL progression in vivo. FL3 treatment inhibited the translation rate in the CLL cells in vivo but had no effect on nonleukemic B cells (CD19+CD5−, Figure 6E). Interestingly, the high translation rate of Tregs was inhibited by FL3 treatment in vivo, whereas their percentage was significantly reduced (Figure 6D-E). In addition, CLL cells expressing high levels of the inhibitory immune checkpoint PD-L1 displayed a higher translation rate (Figure 6F). Finally, we observed that combining FL3 with anti–programmed cell death protein 1 (PD1) therapy resulted in a better outcome in vivo (Figure 6G-H). Altogether, these data indicate that FL3 is effective in vivo by targeting the malignant cells, but also probably by removing the brakes on cell-mediated antitumor immunity.
Expression of translation-related genes correlates with disease progression and poor survival in patients with CLL
To validate the importance of translation in CLL, we quantified the expression of 6 genes from the translation-initiation machinery (eIF4E1, eIF4E2, eIF4G1, eIF4G2, eIF4A1, and eIF4A2) along with PHB and PHB2 by reverse transcription quantitative polymerase chain reaction in a cohort of patients with CLL (N = 144). First, using Cox regression analysis, we identified eIF4E2 and eIF4G2 expression as predictors of OS (hazard ratio [HR] >1 and P value <.05), a high expression was related with poor OS (Figure 7A-B, median survival of 174 vs 397 months, supplemental Figure 6A). When combining these genes, the 8-gene translation signature was also linked to OS (Figure 7C) and higher HRs were obtained when combining 2 genes (Figure 7D, HR >1.5). We made similar observations when analyzing the TFS. We identified that eIF4G2, eIF4E2, eIF4A1, and PHB2 transcript expression, as well as the translation gene signature and multiple gene combinations, was related with TFS in these patients (Figure 7E-F; supplemental Figure 6B-D). We then analyzed the expression of single or multiple genes in groups of patients segregated by the classical prognostic parameters. Single-gene analysis confirmed the increased expression of eIF4E1, eIF4E2, eIF4G1, eIF4G2, PHB, and PHB2 in unfavorable groups (eg, ZAP70+ vs ZAP70−) and subgroups (eg, IGHVM LPL+ vs IGHVUM LPL−) (Figure 7G; supplemental Figure 6E), whereas logistic regression identified differentially expressed gene signatures (supplemental Figure 6F). Within groups of patients, the level of expression of eIF4E2 was linked to OS and TFS (Figure 7H-I; supplemental Figure 6G). Altogether, our data confirmed the relevance of translation in CLL because the expression of selected genes is related to survival and clinical parameters.
Discussion
Although often overlooked in favor of transcriptional alterations, the relevance of translation defects in cancer has been long established. Such importance can be illustrated by the tight association between ribosomopathies and cancer susceptibility.39 In addition, increased expression of several translation initiation factors has been described in a large variety of neoplasms.11 This overexpression can be associated with either overall increase in translation or with alteration of specific mRNA translation. Here, we showed through gene expression analysis, that translation-related genes are upregulated in leukemic B cells compared with healthy B cells, in both humans and mice, which correlate with a higher translation rate observed in CLL cells. In addition to patient samples, Epstein-Barr virus–infected human cell lines40 were used in this study for functional and gene expression studies. Being aware that they might not fully represent CLL cells, we validated all key experiments with patient samples and with the new murine cell line TCL1-355. This corroborates the interest of targeting translation in this neoplasm. Activation signals converge to upregulation of translation, and inhibiting this common end point appears to be more promising compared with targeting different pathways independently. In addition, oncogenes are more susceptible to dysregulation of translation, owing to the complex 5′ structure found in the mRNAs of these genes. Our multiomics analysis demonstrated that translation inhibition affects the translation of the oncogene MYC, which is associated with decreased proliferation capacity and a switch in metabolism. Thus, inhibiting translation allows targeting the leukemic process at different levels. MYC translation is highly regulated at the translational level10,41 and previous studies demonstrated that eIF4A inhibition targets MYC translation in CLL.22,42 Here, we show that targeting translation through PHB leads to a similar effect. In addition, we demonstrated that MYC inhibition is responsible for major metabolism reprogramming.
The exact mechanism of action of flavaglines is still under debate. Surprisingly, despite having biological effects in the nanomolar concentration range, the mechanistic studies on flavagline molecules are often conducted in the micromolar concentration range, thus one must be careful when interpreting the data, because increased doses of the drug often lead to off-target effects. The known targets of flavaglines are PHBs,26,43 eIF4A,26,44 and DDX3.19 By binding to eIF4A, flavaglines stimulate the RNA-binding function of eIF4A, which prevents RNA/eIF4A dissociation, and therefore incorporation of free eIF4A in a new eIF4F complex.23,45 Through targeting of PHBs, FL3 was believed to act on translation indirectly, through the inhibition of the RAS-RAF-MAPK pathway, ultimately leading to decrease eIF4E phosphorylation.27,34,43,46,47 By using DARTS analysis, we proved that FL3 targets PHBs in CLL cells. In addition, this study demonstrates that FL3 treatment is not associated with decreased phosphorylation of RAF1 and ERK1/2 in CLL cells. We also showed that in any case the level of eIF4E phosphorylation (downstream of RAF1/ERK signaling) does not account for translation rate or cell proliferation. This might be seen as a contradiction to some reports on the role of eIF4E phosphorylation in cancer48-50; nevertheless, elegant work has demonstrated that defects in eIF4E phosphorylation are not associated with impaired translation nor cell growth.51 The decreased eIF4E phosphorylation rather reflects the dissociation of the translation initiation machinery. Indeed, eIF4E-eIF4G interaction is crucial for MNKs-driven eIF4E phosphorylation.52 Furthermore, we showed that 4E-BP1 is also not affected in FL3-treated cells, demonstrating that the effect of FL3 on translation does not involve upstream pathways.
Therefore, we hypothesized that PHBs are directly involved in translation. We used different approaches to demonstrate the interaction of PHBs with the eIF4F complex. Then, by using short hairpin RNA, we showed that KD of PHBs mirror FL3 treatment. This discovery represents an important breakthrough that provides key biological insights necessary to understand both PHB biology and PHB-targeting drugs. However, many questions remain open. Future work must determine whether the interaction between PHBs and the eIF4F machinery is limited to CLL cells, what factors govern this interaction, and how FL3 impairs it. Finally, whether PHBs are general players in translation or limited to certain circumstances (eg, oncogenic process or hypoxia) remains to be elucidated.
We showed that CLL cells and Tregs have a higher translation rate in vivo compared with normal B cells and conventional CD4+ T cells, respectively. Moreover, inhibition of translation led to an efficient control of the disease after adoptive transfer of Eμ-TCL1 diseased splenocytes. In FL3-treated mice, we observed a decrease in translation rate in the leukemic cells and in CD8+ and CD4+ T lymphocytes and Tregs. Interestingly, the translation rate in nonleukemic B cells was not decreased by FL3 treatment. In addition, only CLL cells and Tregs were negatively affected by translation inhibition, indicating a specific effect of the drug. We recently demonstrated the crucial role of Tregs in the development of CLL,53,54 thus the possibility to target both CLL cells and Tregs appears promising for the therapeutic potential of translation inhibition in CLL. Interestingly, Tregs rely on a noncanonical translation initiation machinery55 and on the ribosome biogenesis factor Nocl4,56 suggesting that FL3 might also be able to target specific translation mechanisms that do not use the canonical factors. In addition, we demonstrated that FL3 treatment in combination with immunotherapies targeting PD1 is more efficient than single therapies. Future studies should compare the advantage of inhibiting translation relative to current treatments. As translation is the nexus of resistance to several therapies,13 the possibility to combine inhibition of translation with standard of care in CLL represents a promising approach, particularly in a malignancy characterized by relapse and refractory disease.
In conclusion, we have highlighted the importance of the deregulation of translation in CLL, unveiled a direct role of PHBs in translation, and demonstrated that translation inhibition is efficient in controlling CLL development in a preclinical model. We also found a correlation between translation-related/PHB gene expression, prognostic markers, and survival in a cohort of patients with CLL. Current therapies targeting downstream of the BCR constituted a major advance in the standard of care in CLL. However, resistance to these therapies remains an important pitfall. The identification of translation as a novel therapeutic target could be key to establishing effective therapeutic strategies for patients with CLL who are at high risk.
Acknowledgments
The authors thank Carlo Croce and John Byrd (Ohio State University, US) for the kind gift of Eμ-TCL1 mouse and the OSU-CLL cell line. The authors also thank the National Cytometry Platform (LIH; Antonio Cosma, Céline Hoffmann, Thomas Cerutti, Fanny Hedin, Mario Gomez) for assistance in flow cytometry and confocal microscopy, the bioinformatics platform (LIH; Reka Toth) for assistance, and the animal facility (LIH) staff, particularly Anais Oudin and Coralie Pulido; the Metabolomics Platform (LIH, Antoine Lesur, François Bernardin) for liquid chromatography mass spectrometry measurements and for providing technical and analytical support; the LUXGEN platform (LIH/LNS; Nathalie Nicot, Pol Hoffmann, Arnaud Muller and Daniel Stieber) for RNA sequencing; and the GIGA genomics facility. The authors also thank Nadia Beaupain, Jean-Marc Plesseria, and Manuel Counson from the Immuno-Pharmacology and Interactomics group (LIH) for their help in the NanoBRET experiments; Vincent Schlesser, Sigrid De Wilde, Laurent Plawny, and Sebastien Rinaldetti from the Centre Hospitalier du Luxembourg for their help in sample collection; and Titiksha Basu, Jil Delmarque, Olinda Pinto, Carmen Lahr, and Audrey Kopp for technical support. Finally, the authors thank Maxmilan Jeyakumar (LIH) for proofreading the manuscript.
This work was supported by grants from the Luxembourg National Research Fund (FNR) and Fondation Cancer to V.K., E.G., C.D., E.M., and J.P. (PRIDE19/14254520/i2TRON, PRIDE15/10675146/CANBIO, PRIDE21/16763386, C20/BM/14582635, and C20/BM/14592342); to A.C. and M.S. (INTER/FNRS/20/15084569); and to J.M. (ATTRACT grant A18/BM/11809970); from FNRS-Télévie to A.L. (7.4502.17, 7.4503.19), E.V. (7.4509.20, 7.4572.22), S.G. (7.4502.19, 7.6604.21), G.P. (7.4501.18, 7.6518.20), I.F.B. (7.4529.19, 7.6603.21), M.W. (7.4508.16, 7.6504.18), A.C. and M.S. (7.8508.22, 7.8504.20 and 7.4593.19); from the Plooschter Projet to J.P. and E.M.; from the Belgian Foundation for Cancer Research to P.C. (No 2020-068); and from the Swedish Children’s Cancer Foundation (PR2021-003), the Swedish Research Council (2015-00162), and Swedish Cancer Society (21 1490) to T.H.
Authorship
Contribution: A.L. designed and performed experiments, analyzed results, and wrote the manuscript; V.K., E.V., S.G., I.F.B., S.P., C.D., M.W., E.G., and G.P. performed experiments and analyzed data; A.B., N.A., N.E.H., and P.C. performed L-propargylglycine assay, polysome profiling and analysis, and provided expertise on translation; P.M. and T.H. performed DARTS assay and analysis; D.P.H. and G.D. performed pulsed SILAC experiments and analysis; S.C. and D.G.E. provided materials and expertise; P.V.N. performed statistical analysis of gene expression data in patients with CLL; M.B. and J.M. performed metabolomics experiments and analyzed data; M.S. and A.C. performed BRET experiments and analyzed data; B.S. provided sample from patients with CLL, complementary DNA from cohort of patients with CLL, patients’ data, and expertise for analyses; L.D. synthetized FL3 and provided his expertise on the molecule; L.Y., J.-H.F., S.C.C., and G.B., provided samples from patients with CLL, and expertise on hemato-oncology; E.M. and J.P. designed and supervised the study, performed bioinformatics analyses, analyzed results, and wrote the final version of the manuscript; and all authors revised the manuscript.
Conflict-of-interest disclosure: The authors declare no competing financial interests.
Correspondence: Etienne Moussay, Luxembourg Institute of Health, 6 rue Nicolas-Ernest Barblé, L-1210 Luxembourg, Luxembourg; e-mail: etienne.moussay@lih.lu; and Jérôme Paggetti, Luxembourg Institute of Health, 6 rue Nicolas-Ernest Barblé, L-1210 Luxembourg, Luxembourg; e-mail: jerome.paggetti@lih.lu.

This feature is available to Subscribers Only
Sign In or Create an Account Close Modal