

Key Points
Heme drives a coordinated functional and metabolic reprogramming of macrophages via suppression of efferocytosis and mitochondrial remodeling.
Macrophage metabolic rewiring by heme scavenging or PGC1α/PPARγ modulation promotes tissue damage and inflammation resolution in SCD.

Abstract
Sickle cell disease (SCD) is hallmarked by an underlying chronic inflammatory condition, which is contributed by heme-activated proinflammatory macrophages. Although previous studies addressed heme ability to stimulate macrophage inflammatory skewing through Toll-like receptor4 (TLR4)/reactive oxygen species signaling, how heme alters cell functional properties remains unexplored. Macrophage-mediated immune cell recruitment and apoptotic cell (AC) clearance are relevant in the context of SCD, in which tissue damage, cell apoptosis, and inflammation occur owing to vaso-occlusive episodes, hypoxia, and ischemic injury. Here we show that heme strongly alters macrophage functional response to AC damage by exacerbating immune cell recruitment and impairing cell efferocytic capacity. In SCD, heme-driven excessive leukocyte influx and defective efferocytosis contribute to exacerbated tissue damage and sustained inflammation. Mechanistically, these events depend on heme-mediated activation of TLR4 signaling and suppression of the transcription factor proliferator-activated receptor γ (PPARγ) and its coactivator peroxisome proliferator-activated receptor γ coactivator 1α (PGC1α). These changes reduce efferocytic receptor expression and promote mitochondrial remodeling, resulting in a coordinated functional and metabolic reprogramming of macrophages. Overall, this results in limited AC engulfment, impaired metabolic shift to mitochondrial fatty acid β-oxidation, and, ultimately, reduced secretion of the antiinflammatory cytokines interleukin-4 (IL-4) and IL-10, with consequent inhibition of continual efferocytosis, resolution of inflammation, and tissue repair. We further demonstrate that impaired phagocytic capacity is recapitulated by macrophage exposure to plasma of patients with SCD and improved by hemopexin-mediated heme scavenging, PPARγ agonists, or IL-4 exposure through functional and metabolic macrophage rewiring. Our data indicate that therapeutic improvement of heme-altered macrophage functional properties via heme scavenging or PGC1α/PPARγ modulation significantly ameliorates tissue damage associated with SCD pathophysiology.
Introduction
Macrophages are key players in the regulation of heme and iron homeostasis. These cells handle high amount of iron derived from hemoglobin (Hb) upon senescent red blood cell phagocytosis and supply iron for erythropoiesis through iron recycling mediated by ferroportin.1-3 In addition, macrophages can directly internalize Hb and heme as complexes with their high-affinity scavengers haptoglobin (Hp) and hemopexin (Hx) through CD163 and CD91, respectively.4 Although scavenger-mediated uptake is a regulated process that limits heme/iron accumulation, the exposure to “free” Hb/heme species leads to heme overload in macrophages.5-7 This scenario occurs when Hp and Hx binding capacity is overwhelmed, locally or systemically, in pathologic conditions associated with hemolysis, either acute (eg, trauma, hemorrhage) or chronic (eg, sickle cell disease [SCD], β-thalassemia).6-17
Macrophage plasticity reflects cell ability to integrate, respond, and adapt to a variety of signals they encounter in the surrounding microenvironment.18 The acquisition of different functional phenotypes allows macrophages to restore homeostasis through regulated inflammatory and antiinflammatory processes. Heme represents a major microenvironmental stimulus upon chronic hemolysis and acts as an alarmin to stimulate macrophage proinflammatory phenotypic switching in SCD.2,17,19-22 According to the simplistic M1/M2 dichotomous nomenclature, heme-activated macrophages resemble classically activated proinflammatory M1 cells,23 characterized by the release of proinflammatory cytokines (eg, interleukin-1β [IL-1β], IL-6, IL-12, IL-23, tumor necrosis factor α [TNFα]) as well as reactive oxygen species (ROS) and reactive nitrogen species, elevated expression of the M1 markers major histocompatibility complex II, CD86, and CD14, and inducible nitric oxide synthase.8,20,24,25 By contrast, alternatively activated anti-inflammatory and immunoregulatory M2 macrophages produce antiinflammatory cytokines (eg, IL-4, IL-10) and show reduced expression of typical M2 markers as the mannose receptor CD206, arginase-1, Ym1, and CD163. In line with its action as a damage-associated molecular pattern, heme, when released extracellularly, elicits macrophage proinflammatory skewing through Toll-like receptor 4 (TLR4) signaling activation and ROS production and initiates a noninfectious inflammatory response aimed to restore homeostasis.19,20,24-28 However, in SCD, chronic heme-induced M1 activation program in macrophages promotes sterile inflammation and aggravates hepatic fibrosis and renal injury, contributing to the inflammatory landscape and organ damage typically associated with this disease.8-10,13,14,17,21,29
While convenient to simply discriminate between inflammatory and antiinflammatory signatures, the M1/M2 paradigm appears inadequate to comprehensively accommodate and reflect the complexity of macrophage functions that stem from the combination of cell origin (circulating vs tissue residents), environmental stimuli (eg, steady state vs inflammation, different organs), and time (eg, development, stages of inflammation, aging) and offers limited information about the functional behavior of macrophages.23,30 Indeed, although previous studies clarified how heme excess shapes the inflammatory response of macrophages, it remains unclear how it affects their functional phenotype. These considerations have prompted us to investigate this aspect, with a focus on macrophage functional response to tissue damage. In SCD, vaso-occlusive crises occurring in the microcirculation reduce tissue oxygenation and often culminate in ischemia-reperfusion events, cell apoptosis, and tissue damage. Thus, macrophage removal of apoptotic cells (ACs) is critical.31-38 Using in vivo and in vitro approaches, we show that heme, although boosting macrophage ability to recruit immune cells, impairs the efferocytic capacity and the ensuing antiinflammatory switch of resident macrophages and recruited monocytes/neutrophils upon hepatic damage. This mechanism is dependent on heme-driven activation of the TLR4 signaling pathway and reduced expression of major metabolic transcription factors, peroxisome proliferator-activated receptor γ coactivator 1α (PGC1α) and proliferator-activated receptor γ (PPARγ), which lead to limited AC recognition, mitochondrial remodeling, and impaired metabolic shift. Finally, we show that heme-mediated defective efferocytosis is relevant for SCD pathophysiology and its amelioration by macrophage functional rewiring through heme scavenging and that PGC1α/PPARγ modulation improves tissue damage resolution, offering potentially valuable therapeutic strategies for patients with SCD.
Methods
In vivo efferocytosis
For efferocytosis assay, sickle mice or heme-treated wild-type (Wt) mice (80 μmol/kg heme, 14 h) were injected intravenously with 1 × 10⁷ CFMDA-labelled apoptotic neutrophils (ACs). After 2 hours, the fluorescein isothiocyanate positive (FITC+) fraction of ex vivo phagocytes that engulfed FITC-labeled ACs was identified by flow cytometry within CD45+ CD11blow F4/80+ Kupffer resident macrophages and CD45+ CD11b+ F4/80+/− recruited phagocytes.
In vitro efferocytosis assay
Bone marrow–derived macrophages (BMDMs) were prepared and treated as previously reported.8 CMFDA-labeled ACs were added to heme-treated BMDMs at a macrophage to ACs ratio of 1:10 for 2 hours at 37°C. BMDMs were washed, detached, and stained with anti-CD11b and F4/80 antibodies. Efferocytes were identified as FITC+ CD11b+ F4/80+ BMDMs by flow cytometry.
Flow cytometry analysis of macrophages and quantitative reverse transcription polymerase chain reaction
Flow cytometry and quantitative reverse transcription polymerase chain reaction have been performed as previously reported.8
Statistical analysis
Results were expressed as mean ± standard error of the mean (SEM). Comparisons between 2 groups were performed with 2-sided Welch t tests and among ≥3 groups with a 1-way analysis of variance (ANOVA) followed by the Bonferroni posttest, using GraphPad Prism v8. A P value <.05 was considered significant.
Results
Heme exacerbates macrophage ability to recruit immune cell in response to apoptotic damage in SCD
To study the impact of heme on macrophage functions, we assessed the response of macrophages to tissue damage in terms of recruitment and efferocytosis/phagocytosis. We mimicked an apoptotic cell damage by injecting intravenously 1 × 10⁷ ACs in mice. At steady state, HbS mice showed a modest decrease in hepatic resident phagocytes, namely CD11blow F480+ Kupffer macrophages (KCs) and increase in recruited phagocytes, namely CD11bhigh F480+/− monocytes/neutrophils. Although the overall hepatic phagocytic population remained unchanged, KCs were significantly reduced, whereas recruited phagocytes, including Ly6C+ inflammatory monocytes, were increased by AC infusion in both HbA and HbS mice, compared with untreated HbA and HbS animals, respectively (Figure 1Ai-v). These alterations were more pronounced in HbS mice compared with control HbA animals (Figure 1Aii-v) and associated with an increased percentage of dead 7AAD+ KCs (Figure 1Avi). These effects were prevented by the administration of the heme scavenger Hx (Figure 1Ai-vi), suggesting heme involvement in the exacerbated response to AC damage in SCD. To directly assess heme role, we injected heme in Wt mice receiving or not receiving AC infusion. Both AC (albeit not significantly) and heme altered the pool of KCs and recruited phagocytes. However, heme cotreatment more drastically decreased the pool of KCs and increased the recruitment of phagocytes compared with the 2 stimuli alone, reflecting the observation in HbS mice (Figure 1Bi-iv; supplemental Figure 1A,B, available online at the Blood website).

Heme exacerbates immune cell recruitment upon apoptotic damage through inflammatory macrophages in sickle cell disease. (A) Percentage of total phagocytes (i), resident and recruited phagocytes (ii,iii), Ly6C+ recruited monocytes (iv), and 7AAD+ dead macrophages (vi); representative flow cytometry plot of CD11blow F4/80+ resident KCs and CD11b+ F4/80+/− recruited phagocytes (v) in the liver of untreated HbA and HbS mice and HbA, HbS, and Hx-treated HbS mice receiving 1 × 10⁷ AC infusion. (B) Percentage of total phagocytes (i), resident and recruited phagocytes (ii,iii), and representative flow cytometry plot of phagocytes (iv) in the liver of untreated and heme-treated Wt mice receiving or not receiving 1 × 10⁷ AC infusion. (C) Number of F4/80int/high monocytes/macrophages, Gr-1+ neutrophils and monocytes, F4/80− Gr-1− lymphocytes recruited to the peritoneum of Wt mice receiving BMDMs untreated (NT) or previously exposed for 15 hours to 5 μM heme bound to 5 μM albumin (Alb) or 5 μM Hx (i) and representative flow cytometry plot (ii). Data shown are average of 3 independent experiments. Values represent mean ± SEM. Statistical analysis was performed by comparing 3 or more groups with 1-way ANOVA followed by Bonferroni posttest. ∗P < .05; ∗∗P < .01; ∗∗∗P < .001; ∗∗∗∗P < .0001.
Heme exacerbates immune cell recruitment upon apoptotic damage through inflammatory macrophages in sickle cell disease. (A) Percentage of total phagocytes (i), resident and recruited phagocytes (ii,iii), Ly6C+ recruited monocytes (iv), and 7AAD+ dead macrophages (vi); representative flow cytometry plot of CD11blow F4/80+ resident KCs and CD11b+ F4/80+/− recruited phagocytes (v) in the liver of untreated HbA and HbS mice and HbA, HbS, and Hx-treated HbS mice receiving 1 × 10⁷ AC infusion. (B) Percentage of total phagocytes (i), resident and recruited phagocytes (ii,iii), and representative flow cytometry plot of phagocytes (iv) in the liver of untreated and heme-treated Wt mice receiving or not receiving 1 × 10⁷ AC infusion. (C) Number of F4/80int/high monocytes/macrophages, Gr-1+ neutrophils and monocytes, F4/80− Gr-1− lymphocytes recruited to the peritoneum of Wt mice receiving BMDMs untreated (NT) or previously exposed for 15 hours to 5 μM heme bound to 5 μM albumin (Alb) or 5 μM Hx (i) and representative flow cytometry plot (ii). Data shown are average of 3 independent experiments. Values represent mean ± SEM. Statistical analysis was performed by comparing 3 or more groups with 1-way ANOVA followed by Bonferroni posttest. ∗P < .05; ∗∗P < .01; ∗∗∗P < .001; ∗∗∗∗P < .0001.
Based on previous findings that heme promotes macrophage proinflammatory switching,8,10,22,25,39 we hypothesized that heme-activated KCs were responsible for the enhanced immune cell recruitment in response to tissue damage. To test this, we assessed the ability of heme-treated macrophages to induce immune cell recruitment in vivo and in vitro. Peritoneal injection of BMDMs pre-exposed in vitro to heme bound to the nonspecific scavenger albumin (Alb) in Wt mice induced in a 2-hour time window a significantly higher recruitment of F4/80int/high monocytes/macrophages, Gr-1+ monocytes/neutrophils, and F4/80−Gr-1− lymphocytes compared with BMDMs left untreated or exposed to heme bound to the high-affinity scavenger Hx (Figure 1C). To determine whether this was dependent on soluble factors released by heme-activated macrophages, we assessed THP-1 monocyte migration towards the conditioned medium of BMDMs in vitro. Medium of heme-Alb–treated BMDMs triggered the recruitment of a higher number of THP-1 monocytes through a Transwell membrane compared with that of untreated as well as heme-Hx–treated BMDMs (supplemental Figure 1C). Overall, these data suggest that heme aggravates the response to apoptotic damage in SCD by stimulating excessive inflammatory cell recruitment through the release of chemoattractants by activated KCs and ultimately triggering macrophage cell death.
Heme impairs efferocytosis by resident and recruited phagocytes in SCD
To study the efferocytic capacity of macrophages40,41 in HbS mice, we monitored the accumulation of FITC-labeled ACs in phagocytes within a 2-hour time window from their IV injection into HbS mice (Figure 2A; supplemental Figure 2A). The percentage of hepatic FITC+ KCs and recruited phagocytes, which actively engulf ACs, and the phagocytic index, which combines FITC+ cell percentage with the amount of engulfed ACs per phagocyte (expressed as FITC mean fluorescent intensity of FITC+ phagocyte), were significantly reduced in HbS compared with HbA mice (Figure 2Bi-iii; supplemental Figure 3A), reflecting a poor efferocytic process. Interestingly, defective efferocytosis in HbS mice was associated with accumulation of annexin V+ apoptotic and 7AAD+ necrotic hepatic parenchymal cells and elevated serum alanine transaminase (ALT)/aspartate aminotransferase levels (Figure 2Aiv,v; supplemental Figure 3B). The atypical cytoplasmic terminal deoxynucleotidyltransferase-mediated dUTP nick end labeling (TUNEL) stain in hepatocytes of HbS mice was indeed a sign of karyorrhexis and karyolysis, indicative of progression from apoptotic to noncleared secondary necrotic hepatocytes42 (Figure 2Av).
Heme suppresses efferocytosis receptors and drives defective efferocytosis in sickle cell disease. (A) Outline of in vivo efferocytosis experiment in HbS mice, receiving or not receiving hemopexin treatment, and Wt mice, treated with 80 μmol/kg heme. (B) Percentage and phagocytic index of engulfing FITC+ resident and recruited phagocytes in the liver of HbA, HbS, and Hx-treated HbS mice receiving 1 × 10⁷ FITC-labeled AC infusion (i-iii). Representative flow cytometry plots of hepatic phagocytes (FITC+ efferocytes are shown in colors: resident in red; recruited in green) (i), and FITC+ hepatic resident and recruited efferocytes (ii,iii) are shown. Phagocytic index (PI) is calculated as (% FITC+ cells) × (FITC+ cell mean fluorescence intensity [MFI]) and expressed as PI fold change to HbA mice. Percentage of annexin V+ apoptotic and 7AAD+ necrotic hepatic parenchymal cells in HbA, HbS, and Hx-treated HbS mice (iv). Representative images of terminal deoxynucleotidyltransferase-mediated dUTP nick end labeling (TUNEL) staining for apoptotic areas and hematoxylin/eosin staining on liver sections from HbA, HbS, and Hx-treated HbS mice and relative quantification (v). (C) Percentage and phagocytic index of engulfing FITC+ resident (i) and recruited (ii) phagocytes in the liver of NT and heme-treated (80 μmol/kg heme) Wt mice receiving 1 × 10⁷ FITC-labeled AC infusion. Representative flow cytometry plot of hepatic phagocytes (FITC+ efferocytes are shown in colors: resident in red, recruited in green) (iii) and FITC+ hepatic resident (i) and recruited (ii) efferocytes. Percentage of 7AAD+ necrotic hepatic parenchymal cells in Wt mice untreated or treated with heme-albumin (15 μmol/kg heme) or heme-hemopexin (15 μmol/kg heme-Hx) (iv) and untreated or heme-treated (80 μmol/kg heme) Wt and TLR4-knockout mice (v). Expression levels of efferocytic receptors (TIM4, CD169, MerTk, CD36, CD206) in hepatic resident macrophages of untreated or heme-treated (80 μmol/kg heme) Wt mice (vi) and, HbA and HbS mice (D), expressed in MFI as fold change to control mice. (E) FITC+ cell percentage and phagocytic index of BMDMs untreated or treated with 5 μM heme-albumin for 14 hours and then exposed to FITC-labeled apoptotic neutrophils (1 BMDM to 10 ACs ratio) for 2 hours. PI is calculated as (% FITC+ cells) × (FITC+ cell MFI) and expressed as PI fold change to untreated BMDMs. Representative flow cytometry plot of FITC+ efferocytic BMDMs is shown (i). Expression levels of efferocytic receptors (CD36, MerTk, CD206, MARCO, CD169) in BMDMs untreated or exposed to apoptotic cells (1 BMDM to 0.5 AC ratio) alone or together with 5 μM heme-albumin (heme) for 14 hours (ii). Data in panels A-D and Eii are representative of 2 independent experiments. Data in panel Ei are average of 3 independent experiments. Values represent mean ± SEM. Statistical analysis was performed by comparing 2 groups with 2-sided Welch t tests and 3 or more groups with a 1-way ANOVA followed by a Bonferroni posttest. ∗P < .05; ∗∗P < .01; ∗∗∗P < .001; ∗∗∗∗P < .0001.
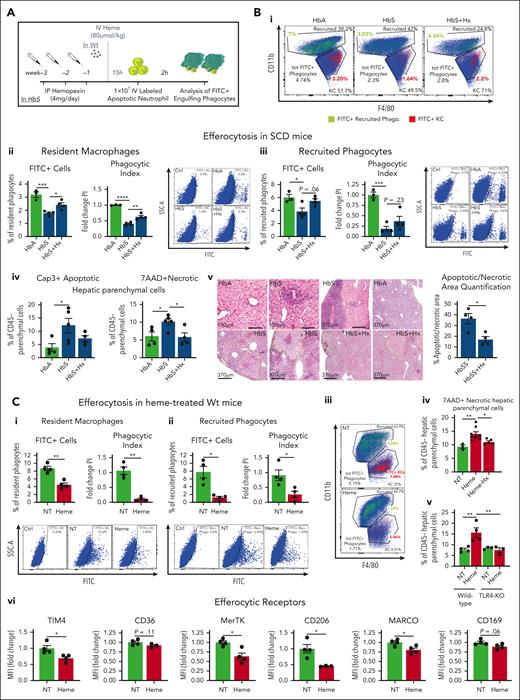
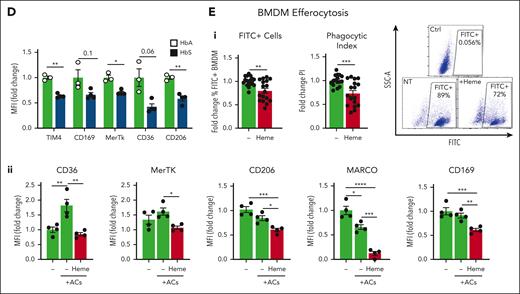
Improved AC clearance in Hx-treated SCD mice indicated that free heme has a role in defective efferocytosis. Thus, we assessed efferocytosis of FITC-labeled ACs by hepatic phagocytes in heme-treated Wt mice (Figure 2A,C). Efferocytosis by KCs was severely reduced in heme-treated mice compared with untreated animals, and recruited monocytes and neutrophils failed to compensate for it (Figure 2Ci-iii; supplemental Figure 3C). This was associated with the accumulation of 7AAD+ necrotic hepatic parenchymal cells, which was prevented by Hx treatment as well as by TLR4 inactivation (Figure 2Civ,v), suggesting a role for heme and its ability to activate TLR4 in aggravating tissue damage through defective efferocytosis. The expression of the efferocytosis receptors TIM4, CD36, MerTk, CD206, MARCO, and CD169 was reduced in KCs of heme-treated Wt mice (Figure 2Cvi), a feature consistently observed in KCs of HbS compared with control HbA mice (Figure 2D). Heme ability to suppress efferocytosis and receptor expression was confirmed in heme-treated BMDMs (Figure 2Ei,ii; supplemental Figures 4, 5A). Furthermore, bacteria phagocytosis, which shares common features with efferocytosis, was similarly suppressed by heme in macrophages in vitro and in vivo (supplemental Figures 6 and 7). The heme moiety, iron, likely contributes to these heme effects (supplemental Figure 8). Finally, the messenger RNA (mRNA) levels of a major nuclear receptor regulating the transcription of efferocytosis receptors, PPARγ,40,43 as well as its coactivator PGC1α, were significantly reduced by heme in BMDMs (Figure 3Ai). Overall, these data demonstrate that hemolysis is a driver of defective efferocytosis in SCD.
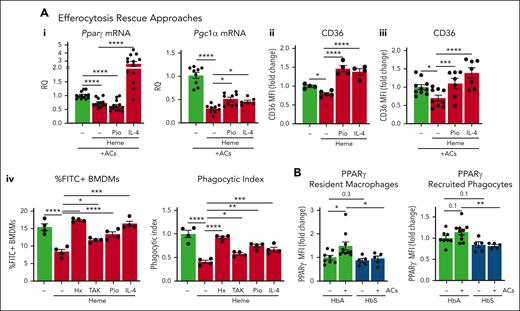
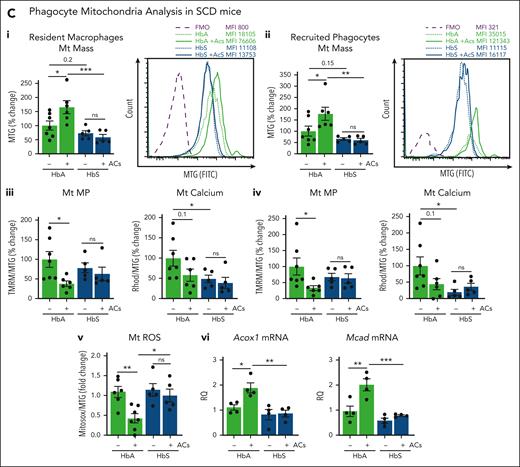
Efferocytosis-driven PPARγ induction and mitochondrial remodeling are impaired in SCD. (A) mRNA levels of PGC1α and PPARγ in BMDMs exposed to ACs (1 BMDM to 0.5 AC ratio) without or with 5 μM heme-albumin (heme), alone or in presence of 1 μΜ pioglitazone (Pio) or 50 ng/ml IL-4 for 14 hours (i). Protein expression levels of the efferocytic receptor CD36 in BMDMs untreated or treated with 5 μM heme-albumin (heme) in presence or absence of 1 μM Pio or 50 ng/mL IL-4, without (ii) or with (iii) AC coexposure (1 BMDM to 0.5 AC ratio) for 14 hours. mRNA levels are expressed in relative quantification (RQ) and protein levels in MFI as fold change to control BMDMs. FITC+ cell percentage and phagocytic index of BMDMs untreated or treated with 5 μM heme-albumin (heme) alone or combined with 5 μM Hx, 400 nM TAK-242 (TAK), 1 μΜ Pio, or 50 ng/mL IL-4 for 14 hours and then exposed to FITC-labeled apoptotic cells (1 BMDM to 10 ACs ratio) for 2 hours (iv). PI is calculated as (% FITC+ cells) × (FITC+ cell MFI) and expressed as PI fold change to untreated BMDMs. (B) Protein expression levels of PPARγ in KCs and recruited phagocytes of HbA and HbS mice, untreated or receiving 2.5 × 10⁷ AC infusion, expressed in MFI as fold change to untreated HbA mice. Data in panels Ai,iii and B are average of 2 independent experiments. Data in panel Aii,iv are representative of 2 independent experiments. (C) Mitochondrial mass monitored by Mitotracker Green (MTG) staining (i,ii), Mt MP by TMRM staining, and mitochondrial calcium by Rhod2 staining (iii,iv) in resident and recruited phagocytes of HbA and HbS mice, untreated or receiving 2.5 × 10⁷ AC infusion. Representative flow cytometry histograms of MTG staining of hepatic resident (i) and recruited (ii) phagocytes are shown. Mt MP and calcium are shown normalized to Mt mass and expressed as MFI percentage change over untreated HbA mice (v,vi). Mitochondrial ROS (Mt ROS) monitored by Mitosox staining (v) and mRNA levels of ACOX1 and MCAD (vi) in KCs of HbA and HbS mice, untreated or receiving 2.5 × 10⁷ AC infusion. Mt ROS are shown normalized to Mt mass as MFI fold change over untreated HbA mice. mRNA levels are expressed in RQ. Data in panel C are average of 2 independent experiments. Values represent mean ± SEM. Statistical analysis was performed by comparing 3 or more groups with a 1-way ANOVA followed by a Bonferroni posttest. ∗P < .05; ∗∗P < .01; ∗∗∗P < .001; ∗∗∗∗P < .0001.
PPARγ/PGC1α suppression and TLR4 signaling pathway are involved in heme-driven defective efferocytosis
To determine the role of PPARγ/PGC1α suppression in heme-impaired efferocytosis, we assessed efferocytosis in BMDMs exposed to heme in presence of the PPARγ agonist Pio and the PPARγ/PGC1α inducer IL-4 (Figure 3A). Both Pio and IL-4 treatment rescued efferocytosis/phagocytosis in heme-treated BMDMs and significantly improved expression/activation of PGC1α, PPARγ, and phagocytic receptors (Figure 3Ai-iv; supplemental Figures 8B, 9).
Heme drives macrophage inflammatory skewing via TLR4 signaling pathway and ROS production.8 To investigate whether these mechanisms were also implicated in heme-suppressed efferocytosis/phagocytosis, we treated BMDMs with heme alone or in presence of the TLR4 inhibitor TAK-242 or the antioxidant N-acetylcysteine. Although N-acetylcysteine did not, TAK-242 significantly improved efferocytosis/phagocytosis in heme-treated BMDMs (Figure 3Aiv; supplemental Figure 10A-C). Finally, heme scavenging rescued efferocytosis/phagocytosis in vitro (Figure 3Aiv; supplemental Figure 10C,D). These results demonstrate that PPARγ/PGC1α suppression and TLR4 signaling activation are involved in heme-impaired efferocytosis.
Heme drives macrophage functional reprogramming through the coordinated suppression of efferocytosis and mitochondrial remodeling
Besides regulating efferocytosis, PGC1α and PPARγ act as major regulators of mitochondrial biogenesis and maintain mitochondrial homeostasis.44,45 To assess whether the mitochondrial compartment was affected by hemolysis, we characterized mitochondria in hepatic phagocytes of HbS mice. KCs and recruited phagocytes showed a trend to reduced PPARγ protein levels, mitochondrial mass, and mitochondrial membrane potential (Mt MP) in HbS compared with HbA mice, at steady state (Figure 3B,Ci,ii). As reported previously43, we found that AC infusion increased mitochondrial mass together with PPARγ expression in phagocytes (see control HbA mice) while decreasing their MP, calcium, and ROS, mechanisms that normally ensure sustained efferocytosis.46,47 However, these changes were abrogated in HbS mice, indicating that hemolysis impairs mitochondrial fitness at steady state and interferes with efferocytosis-induced mitochondrial remodeling (Figure 3B,Ci-v). Finally, Acox1 and Mcad, genes of the peroxisomal/mitochondrial fatty acid β-oxidation (FAO), were upregulated in AC-treated HbA but not HbS mice (Figure 3Cvi).
To prove the direct implication of heme in altered mitochondrial dynamics, we analyzed, both in vivo and in vitro, mitochondria in macrophages exposed to heme alone. Mitochondrial mass was significantly reduced in hepatic resident and recruited phagocytes of heme-treated Wt mice as well as heme-treated BMDMs (Figure 4Ai,Bi,ii; supplemental Figure 11Ai). Although BMDM mitochondrial mass and number were reduced, mitochondrial area and major/minor length were significantly increased by heme treatment, suggesting reduced mitochondrial fission (Figure 4Bi; supplemental Figure 11Aii). Moreover, Mt MP and ROS were elevated in macrophages exposed to heme, both in vivo and in vitro (Figure 4Aii,iii,Biii,iv; supplemental Figure 11B,C), suggesting that oxygen consumption fuels ROS production rather than adenosine triphosphate (ATP) generation in the presence of excess heme and likely contributes to altered Mt MP. Heme-treated BMDMs showed increased mitochondrial calcium levels compared with control cells, indicating mitochondrial calcium retention and misbalance in cytosolic/mitochondrial calcium distribution (Figure 4Bv; supplemental Figure 11Cii). Heme ability to alter mitochondrial dynamics was maintained upon cells coexposure to ACs (supplemental Figure 12) and reproduced by iron exposure (supplemental Figure 11D).

Heme alters mitochondrial mass and dynamics. (A) Mt mass (i), Mt MP (ii), and Mt ROS (iii) monitored by flow cytometry in resident and recruited phagocytes of untreated and heme-treated (80 μmol/kg heme) Wt mice. Mt MP and ROS are shown normalized to Mt mass and expressed as MFI percentage or fold change over untreated Wt mice. Representative flow cytometry histograms of MTG staining of resident and recruited phagocytes are shown (i). (B) Representative confocal microscopy images of MTG-stained BMDMs untreated or treated with 5 μM heme-albumin (heme), alone or combined with 1 μM Pio or 50 ng/mL IL-4 for 14 hours, and relative Mt area and number quantification (i). Mt mass (ii), Mt MP (iii), Mt calcium (iv), and Mt ROS (v) monitored by flow cytometry in BMDMs untreated or treated with 5 μM heme-albumin (heme), alone or combined with 1 μM Pio for 14 hours. Mt MP, calcium, and ROS are shown normalized to Mt mass and expressed as MFI percentage or fold change over untreated BMDMs. Representative flow cytometry histograms of MTG staining of BMDMs are shown (ii). (C) mRNA levels of UCP2, DRP1 (i), CPT1a, ACOX1, VLCAD, and MCAD (ii) in BMDMs exposed to ACs (1 BMDM to 0.5 AC ratio) without or with 5 μM heme-albumin (heme) alone or combined with 1 μM Pio or 50 ng/mL IL-4 for 14 hours. mRNA levels are expressed in RQ. Data are average of 2 independent experiments. Values represent mean ± SEM. Statistical analysis was performed by comparing 3 or more groups with a 1-way ANOVA followed by a Bonferroni posttest. ∗P < .05; ∗∗P < .01; ∗∗∗P < .001; ∗∗∗∗P < .0001.
Heme alters mitochondrial mass and dynamics. (A) Mt mass (i), Mt MP (ii), and Mt ROS (iii) monitored by flow cytometry in resident and recruited phagocytes of untreated and heme-treated (80 μmol/kg heme) Wt mice. Mt MP and ROS are shown normalized to Mt mass and expressed as MFI percentage or fold change over untreated Wt mice. Representative flow cytometry histograms of MTG staining of resident and recruited phagocytes are shown (i). (B) Representative confocal microscopy images of MTG-stained BMDMs untreated or treated with 5 μM heme-albumin (heme), alone or combined with 1 μM Pio or 50 ng/mL IL-4 for 14 hours, and relative Mt area and number quantification (i). Mt mass (ii), Mt MP (iii), Mt calcium (iv), and Mt ROS (v) monitored by flow cytometry in BMDMs untreated or treated with 5 μM heme-albumin (heme), alone or combined with 1 μM Pio for 14 hours. Mt MP, calcium, and ROS are shown normalized to Mt mass and expressed as MFI percentage or fold change over untreated BMDMs. Representative flow cytometry histograms of MTG staining of BMDMs are shown (ii). (C) mRNA levels of UCP2, DRP1 (i), CPT1a, ACOX1, VLCAD, and MCAD (ii) in BMDMs exposed to ACs (1 BMDM to 0.5 AC ratio) without or with 5 μM heme-albumin (heme) alone or combined with 1 μM Pio or 50 ng/mL IL-4 for 14 hours. mRNA levels are expressed in RQ. Data are average of 2 independent experiments. Values represent mean ± SEM. Statistical analysis was performed by comparing 3 or more groups with a 1-way ANOVA followed by a Bonferroni posttest. ∗P < .05; ∗∗P < .01; ∗∗∗P < .001; ∗∗∗∗P < .0001.
Importantly, heme reduced the expression of 2 factors regulating Mt MP and mitochondrial fission and essential for continual efferocytosis, namely, Ucp2 and Drp146,47 (Figure 4Ci), as well as FAO genes, including Cpt1a, Acox1, Vlcad, and Mcad, in AC-treated BMDMs (Figure 4Cii). Mitochondrial alterations and gene suppression were rescued by Pio and IL-4, demonstrating PPARγ/PGC1α implication in heme-driven mitochondrial remodeling (Figure 4B,C; supplemental Figures 11, 12).
Finally, to assess how the combination of heme-driven defective efferocytosis and mitochondrial remodeling interferes with changes in mitochondrial respiration, we monitored the oxygen consumption rate (OCR) in control vs heme-treated BMDMs exposed to ACs. AC exposure caused a significant net increase in BMDM OCR compared with untreated cells (20-25 pmol per min/4 × 104cells), likely through increased FAO of AC lipid membranes. In line with reduced AC uptake, this increase was almost completely abrogated by heme exposure (6-10 pmol per min/4 × 104cells) and rescued by IL-4 cotreatment in BMDMs (Figure 5Ai). Heme-driven OCR reduction was associated with lower ATP production in response to ACs (Figure 5Aii,iii; supplemental Figure 13), indicating that the limited AC cargo uptake accounts for a lack of mitochondrial respiration increase in heme-activated macrophages. Accordingly, ATP production was lower in KCs and recruited phagocytes of steady-state HbS vs HbA mice and was increased by AC infusion in HbA but not HbS mice (Figure 5Aiv; supplemental Figure 14).
Heme induces Warburg effect in macrophages and prevents efferocytosis-driven metabolic switch to FAO and ATP production. (A) OCR increase (i), percentage OCR (ii) and ATP (iii) change in BMDMs untreated or treated with 20 μM heme-albumin (heme) with/without 50 ng/mL IL-4 for 14 hours and then exposed to FITC-labeled ACs (1 BMDM to 10 ACs ratio) for 3 hours. Data are representative of 3 independent experiments. ATP production in KCs and percentage ATP+ KCs in HbA and HbS mice, untreated or receiving 2.5 × 10⁷ AC infusion (iv). Data are average of 2 independent experiments. ATP production is expressed as MFI fold change over control HbA mice. Representative flow cytometry histograms of ATP staining in KCs are shown. Values represent mean ± SEM. Statistical analysis was performed by comparing 2 groups with 2-sided Welch t tests and 3 or more groups with a 1-way ANOVA followed by a Bonferroni posttest. (B,C) Metabolome analysis in KCs of HbS mice, panel B, and BMDMs, panel C. (B) Heatmaps after unsupervised hierarchical clustering of metabolites from isolated KCs of HbA and HbS mice, untreated (i) and receiving 2.5 × 10⁷ AC infusion (iv). Metabolite set enrichment analysis of significantly altered core pathways in KCs of untreated HbA and HbS mice (ii) and HbA mice, untreated or receiving 2.5 × 10⁷ AC infusion (iii). Data are representative of 2 independent experiments. (C) Heatmaps after unsupervised hierarchical clustering of metabolites from BMDMs untreated or exposed to 5 μM heme-albumin, alone (i) or in presence of ACs (ii). Metabolite set enrichment analysis of significantly altered core pathways in BMDMs exposed to ACs in absence or presence of 10 μM heme-albumin (iii) and with Pio (iv) (see relative heatmap and complete analysis in supplemental tables 6-13 and figures 19-29). In the heatmaps, significantly different compounds as determined by a t test are indicated. Data are representative of 3 independent experiments. In pathway enrichment analysis, significantly different pathways as determined by a t test and unadjusted raw or adjusted Holm P values are indicated. Data show a representative experiment. ∗P < .05; ∗∗P < .01; ∗∗∗P < .001; ∗∗∗∗P < .0001.


Overall, these data suggest that heme drives a coordinated functional and metabolic reprogramming of macrophages through efferocytosis suppression and altered mitochondrial dynamics.
Heme promotes macrophage metabolic rewiring and counteracts efferocytosis-induced metabolic adaptation
The observation of limited efferocytosis, mitochondrial FAO, and ATP production in macrophages of HbS mice prompted us to investigated metabolome changes in isolated KCs. Metabolome analysis showed increased Warburg effect and glycolysis, associated with elevated glucose and lactic acid levels and reduced fatty acid (FA) content in KCs of HbS vs HbA mice (Figure 5Bi,ii; supplemental Table 3). AC infusion tended to elevate FA content (eg, stearic, arachidic, palmitic, and oleic acids) and elicited FAO in KCs of HbA but not HbS mice compared with their respective control conditions (Figure 5Biii; supplemental Figures 15,16,17; supplemental Table 4). Thus, KCs from AC-infused HbS mice showed reduced levels of FA and maintained Warburg effect features compared with KCs from AC-infused HbA mice (Figure 5Biv; supplemental Figure 18; supplemental Table 5). Overall, metabolome changes suggest that, although normally macrophages use FA as source of energy, these cells in SCD mainly depend energetically on the metabolism of glucose or other sources (eg, other sugars, amino acids), both at steady state and in the presence of ACs. Increased purine and tyrosine metabolism is also suggestive of pentose phosphate pathway (PPP) engagement, as previously reported.48
To assess the direct implication of heme in these changes, we analyzed the metabolome of heme-treated BMDMs. Metabolomic and pathway enrichment analyses showed that heme drives a metabolic shift from FAO toward glucose consumption through PPP/pyruvate metabolism in heme-treated BMDMs. Heme, alone or in combination with ACs, triggered a significant reduction in FA and lipid content (eg, palmitoyl/steroylglycerol, oleic, nonanoic, heptanoic, and heptadecanoic acids) in BMDMs (Figure 5Ci-iii; supplemental Tables 6 and 7), in line with reduced uptake of lipids, FA, and ACs due to lipid scavenger/efferocytosis receptor suppression and defective efferocytosis. The increase in triacylglycerol biosynthesis in heme-treated BMDMs suggests that intracellular lipids and/or the efferocytic cargo, although limited, fuel lipid storage through triglyceride synthesis rather than lipid catabolism through FAO (Figure 5Ciii). The reduction in lipid metabolites in heme-treated BMDMs was partially rescued by treatment with Hx, the TLR-4 inhibitor TAK-242, and IL-4 (supplemental Figures 19-23; supplemental Tables 8-10). Importantly, efferocytosis rescue by TAK-242, Pio, and IL-4 in heme-treated BMDMs exposed to ACs improved FA and lipid content (supplemental Figures 24-28; supplemental Tables 11-13). Accordingly, pathway enrichment analysis showed increased lipid metabolism, including enhanced FAO, FA biosynthesis, and sphingolipid and glycerolipid metabolism in these cells (Figure 5Civ; supplemental Figure 29). Finally, the reduction of glutamine metabolites (eg, glutamic acid, pyroglutamic acid) in heme-treated BMDMs indicates that glutaminolysis, an M2 macrophage feature that boosts efferocytosis by fueling mitochondrial oxidative phosphorylation (OXPHOS)/ATP generation, is impaired by heme49 (Figure 5Cii; supplemental Figures 24-28; supplemental Tables 11-13). Together, these results show that heme-driven metabolic adaptation in macrophages involves a shift towards glucose consumption through the PPP and pyruvate/lactate metabolism (Warburg effect) and impairs the reliance on mitochondrial FAO and glutamynolysis for energetic demands.
Heme-induced defective efferocytosis prevents macrophage anti-inflammatory rewiring
Whereas heme skews macrophages towards a proinflammatory phenotype, efferocytosis is an anti-inflammatory process, aimed at producing anti-inflammatory cytokines, through mitochondrial FAO of AC-derived lipids, to resolve inflammation and tissue damage.50,51 Here we confirmed heme proinflammatory action, which induced TNFα, IL-6, and IFN-γ and suppressed IL-4 and IL-10, and efferocytosis anti-inflammatory role, which achieved the opposite effect in macrophages (Figure 6Ai; supplemental Figure 30). Importantly, BMDM coexposure to heme and ACs maintained inflammatory cytokines elevated and anti-inflammatory ones suppressed, suggesting that heme, by inhibiting efferocytosis, abrogates AC anti-inflammatory action (Figure 6Ai). Accordingly, TNFα and IFN-γ were elevated in KCs of HbS compared with HbA mice upon AC infusion. IL-4 and IL-10 production was also increased, likely resulting from chronic damage (Figure 6Aii). We suggest that, due to hemolysis, in SCD, macrophage production of pro- and anti-inflammatory cytokines is inappropriately high and low, respectively, resulting in persistent inflammation and lack of tissue damage resolution. Efferocytosis rescue by IL-4 and Pio treatment promoted anti-inflammatory skewing of heme-treated BMDMs, resulting in decreased TNFα, IL-6, and IFN-γ and increased IL-4 and IL-10 (Figure 6Ai). IL-4 therapy in HbS mice receiving AC infusion reduced TNFα and IFN-γ production and slightly decreased IL-4 and IL-10, indicating progressive resolution of inflammation and damage (Figure 6Aii). Pio effect was milder, likely due to suboptimal dosing. Overall, these data indicate that heme-suppressed efferocytosis impairs macrophage anti-inflammatory rewiring, thus sustaining chronic inflammation in SCD.

Macrophage metabolic rewiring counteracts inflammation and improves tissue damage resolution by restoring heme-suppressed AC clearance. (A) Levels of TNFα, IL-6, interferon gamma (IFN-γ), IL-4, and IL-10 monitored by flow cytometry in BMDMs exposed or not to ACs (1 BMDM to 0.5 AC ratio) in presence of 5 μM heme-albumin (heme) without or with 1 μM Pio or 50 ng/mL IL-4 for 6 hours (i). Levels of TNFα, IFN-γ, IL-4, and IL-10 monitored by flow cytometry in KCs of HbA mice and HbS mice untreated or receiving IL-4 or Pio treatment (ii). Protein levels are expressed in MFI as fold change to control BMDMs. (B) Outline of in vivo experiment on hepatotoxicity induced by thioacetamide (TAA) in Wt mice. Parameters were monitored at days 1 and 4 after TAA treatment (i). Percentage of efferocytic ASPGR+ resident and recruited phagocytes (day 1) in the liver of Wt mice untreated or treated with TAA alone (100 mg/kg TAA) or combined with heme (70 μmol/kg heme) or heme/Pio (10 mg/kg per day Pio) (ii). Expression level of efferocytic receptors (TIM4, MerTk, CD36, CD206, MARCO, CD169) in KCs of Wt mice treated with TAA alone or combined with heme or heme/Pio (iii). Percentage of annexin V+ and caspase-3+ apoptotic CD45− hepatic parenchymal cells (iv) and representative images of hematoxylin/eosin staining on liver sections of Wt mice treated with TAA alone or combined with heme or heme/Pio (v). Damaged apoptotic/necrotic areas are highlighted in the pictures by the yellow dashed line. AST activity and antinuclear antibody activity in sera of Wt mice treated with TAA alone or combined with heme or heme/Pio (vi,vii). Protein expression levels are expressed in MFI as fold change to TAA-treated mice. Data show a representative of 2 independent experiments. Values represent mean ± SEM. Statistical analysis was performed by comparing 3 or more groups with a 1-way ANOVA followed by a Bonferroni posttest. ∗P < .05; ∗∗P < .01; ∗∗∗P < .001; ∗∗∗∗P < .0001.
Macrophage metabolic rewiring counteracts inflammation and improves tissue damage resolution by restoring heme-suppressed AC clearance. (A) Levels of TNFα, IL-6, interferon gamma (IFN-γ), IL-4, and IL-10 monitored by flow cytometry in BMDMs exposed or not to ACs (1 BMDM to 0.5 AC ratio) in presence of 5 μM heme-albumin (heme) without or with 1 μM Pio or 50 ng/mL IL-4 for 6 hours (i). Levels of TNFα, IFN-γ, IL-4, and IL-10 monitored by flow cytometry in KCs of HbA mice and HbS mice untreated or receiving IL-4 or Pio treatment (ii). Protein levels are expressed in MFI as fold change to control BMDMs. (B) Outline of in vivo experiment on hepatotoxicity induced by thioacetamide (TAA) in Wt mice. Parameters were monitored at days 1 and 4 after TAA treatment (i). Percentage of efferocytic ASPGR+ resident and recruited phagocytes (day 1) in the liver of Wt mice untreated or treated with TAA alone (100 mg/kg TAA) or combined with heme (70 μmol/kg heme) or heme/Pio (10 mg/kg per day Pio) (ii). Expression level of efferocytic receptors (TIM4, MerTk, CD36, CD206, MARCO, CD169) in KCs of Wt mice treated with TAA alone or combined with heme or heme/Pio (iii). Percentage of annexin V+ and caspase-3+ apoptotic CD45− hepatic parenchymal cells (iv) and representative images of hematoxylin/eosin staining on liver sections of Wt mice treated with TAA alone or combined with heme or heme/Pio (v). Damaged apoptotic/necrotic areas are highlighted in the pictures by the yellow dashed line. AST activity and antinuclear antibody activity in sera of Wt mice treated with TAA alone or combined with heme or heme/Pio (vi,vii). Protein expression levels are expressed in MFI as fold change to TAA-treated mice. Data show a representative of 2 independent experiments. Values represent mean ± SEM. Statistical analysis was performed by comparing 3 or more groups with a 1-way ANOVA followed by a Bonferroni posttest. ∗P < .05; ∗∗P < .01; ∗∗∗P < .001; ∗∗∗∗P < .0001.
Heme-driven defective efferocytosis impairs tissue damage resolution and is rescued by macrophage functional rewiring in SCD
Defective efferocytosis likely prevents tissue damage resolution through tissue accumulation of ACs and progression to secondary necrotic cells. To test heme-impaired efferocytosis contribution to aggravated tissue damage upon hemolytic conditions, we took advantage of a model of hepatotoxicity by injecting in Wt mice thioacetamide (TA) in the presence or absence of heme cotreatment. A group of mice received Pio for 3 days post-TA/heme to stimulate PPARγ activation (Figure 6Ai). TA-induced alterations of phagocyte populations were aggravated by heme and paralleled by a more elevated number of annexin V+ apoptotic phagocytes at day 1 (supplemental Figure 31A,B). Clearance of apoptotic hepatocytes monitored by phagocyte positivity for the hepatocyte-specific asialoglycoprotein receptor (ASPGR) showed that ASPGR+ phagocytes, together with efferocytosis receptor expression, were decreased in mice receiving TA/heme compared with TA alone and improved by Pio treatment (Figure 6Aii,iii). Analysis of annexin V+/caspase 3+ apoptotic parenchymal cells, liver histology, and serum AST/ALT indicated that, whereas at day 1 hepatic damage was comparable across the groups, by day 4 it was resolved in TA-treated and TA/heme/Pio-treated mice but persisted in TA/heme-treated mice (Figure 6Biv-vi; supplemental Figure 31C).
Efferocytosis, while contemporarily repressing the production of inflammatory mediators, ensures the immunologically silent removal of ACs and maintenance of immune tolerance. Heme-impaired efferocytosis was associated with elevated antinuclear antibody levels in the sera of TA/heme-treated mice compared with TA-treated mice, together with reduced IL-4 and IL-10 production by KCs (Figure 6Bvii; supplemental Figure 31D), indicating that uncleared ACs undergoing secondary necrosis drive autoimmunity through the release of self-antigens and prevent inflammation resolution.
We then assessed whether increasing PPARγ/PGC1α levels effectively improves efferocytosis and tissue damage in SCD. IL-4 treatment improved hepatic efferocytic capacity in HbS mice (Figure 7Ai), which was associated with enhanced ATP production, increased efferocytosis receptor expression, and reduced inflammatory cytokine production in KCs, suggesting macrophage phenotypic and functional rewiring (Figures 6Aii, 7Aii,iii). Accumulation of apoptotic/necrotic hepatocytes as well as dead macrophages and serum ALT levels were significantly reduced by IL-4 treatment in HbS mice (Figure 7Aiv,v; supplemental Figure 32). Overall, these results suggest that hemolysis aggravates tissue injury and promotes autoimmunity by impairing damage resolution through inhibition of AC clearance.
![Plasma heme overload in patients with SCD is a driver of defective phagocytosis. (A) Percentage and phagocytic index and representative flow cytometry dot plot of engulfing FITC+ phagocytes (i); percentage ATP+ KCs (ii); representative flow cytometry histograms of CD36, MerTk, and CD206 expression in KCs (iii); percentage of caspase-3+ apoptotic and 7AAD+ necrotic CD45⁻ hepatic parenchymal cells (iv); and serum ALT activity (v) in untreated and IL-4–treated HbS mice receiving 1 × 10⁷ FITC-labeled AC infusion. Data show a representative of 2 independent experiments. (B) FITC+ cell percentage, phagocytic index, and representative flow cytometry plot of BMDMs untreated or treated with 5 μM heme-albumin (heme) and 10% plasma from patients with SCD for 14 hours and then exposed to Escherichia coli bioparticles (pHrodo) for 2 hours (i). Correlation between FITC+ phagocytic cell percentage or phagocytic index and heme or Hx levels in plasma of the correspondent patient with SCD (ii). FITC+ cell percentage, phagocytic index, and representative flow cytometry plot of BMDMs untreated or treated with plasma from patients with SCD in presence or absence of 10 μM Hx plus 10 μM Hp (n = 17) (iii) or 50 ng/mL IL-4 (n = 9) (iv) for 15 hours, followed by exposure to pHrodo E. coli bioparticles for 2 hours. PI is calculated as (% FITC+ cells) × (FITC+ cell MFI) and expressed as PI fold change to untreated BMDMs. FITC+ phagocytic cell percentage changes caused by Hb/heme scavenging or IL-4 treatment are shown for plasma from each patients with SCD. Solid lines correspond to increased phagocytosis (13 patients [iii]; 7 patients [iv] and dashed lines correspond to decreased phagocytosis (4 patients [iii]; 2 patients [iv]) in presence of Hb/heme scavengers or IL-4. Data are average of 3 independent experiments. Values represent mean ± SEM (n = 2/3). Statistical analysis was performed by comparing 2 groups with 2-sided Welch t tests and 3 or more groups with a 1-way ANOVA followed by a Bonferroni posttest. ∗P < .05; ∗∗P < .01.](/view-large/figure/11741021/BLOOD_BLD-2022-018026-gr7.jpg)
Plasma heme overload in patients with SCD is a driver of defective phagocytosis. (A) Percentage and phagocytic index and representative flow cytometry dot plot of engulfing FITC+ phagocytes (i); percentage ATP+ KCs (ii); representative flow cytometry histograms of CD36, MerTk, and CD206 expression in KCs (iii); percentage of caspase-3+ apoptotic and 7AAD+ necrotic CD45⁻ hepatic parenchymal cells (iv); and serum ALT activity (v) in untreated and IL-4–treated HbS mice receiving 1 × 10⁷ FITC-labeled AC infusion. Data show a representative of 2 independent experiments. (B) FITC+ cell percentage, phagocytic index, and representative flow cytometry plot of BMDMs untreated or treated with 5 μM heme-albumin (heme) and 10% plasma from patients with SCD for 14 hours and then exposed to Escherichia coli bioparticles (pHrodo) for 2 hours (i). Correlation between FITC+ phagocytic cell percentage or phagocytic index and heme or Hx levels in plasma of the correspondent patient with SCD (ii). FITC+ cell percentage, phagocytic index, and representative flow cytometry plot of BMDMs untreated or treated with plasma from patients with SCD in presence or absence of 10 μM Hx plus 10 μM Hp (n = 17) (iii) or 50 ng/mL IL-4 (n = 9) (iv) for 15 hours, followed by exposure to pHrodo E. coli bioparticles for 2 hours. PI is calculated as (% FITC+ cells) × (FITC+ cell MFI) and expressed as PI fold change to untreated BMDMs. FITC+ phagocytic cell percentage changes caused by Hb/heme scavenging or IL-4 treatment are shown for plasma from each patients with SCD. Solid lines correspond to increased phagocytosis (13 patients [iii]; 7 patients [iv] and dashed lines correspond to decreased phagocytosis (4 patients [iii]; 2 patients [iv]) in presence of Hb/heme scavengers or IL-4. Data are average of 3 independent experiments. Values represent mean ± SEM (n = 2/3). Statistical analysis was performed by comparing 2 groups with 2-sided Welch t tests and 3 or more groups with a 1-way ANOVA followed by a Bonferroni posttest. ∗P < .05; ∗∗P < .01.
Plasma heme overload in patients with SCD is a driver of defective phagocytosis. (A) Percentage and phagocytic index and representative flow cytometry dot plot of engulfing FITC+ phagocytes (i); percentage ATP+ KCs (ii); representative flow cytometry histograms of CD36, MerTk, and CD206 expression in KCs (iii); percentage of caspase-3+ apoptotic and 7AAD+ necrotic CD45⁻ hepatic parenchymal cells (iv); and serum ALT activity (v) in untreated and IL-4–treated HbS mice receiving 1 × 10⁷ FITC-labeled AC infusion. Data show a representative of 2 independent experiments. (B) FITC+ cell percentage, phagocytic index, and representative flow cytometry plot of BMDMs untreated or treated with 5 μM heme-albumin (heme) and 10% plasma from patients with SCD for 14 hours and then exposed to Escherichia coli bioparticles (pHrodo) for 2 hours (i). Correlation between FITC+ phagocytic cell percentage or phagocytic index and heme or Hx levels in plasma of the correspondent patient with SCD (ii). FITC+ cell percentage, phagocytic index, and representative flow cytometry plot of BMDMs untreated or treated with plasma from patients with SCD in presence or absence of 10 μM Hx plus 10 μM Hp (n = 17) (iii) or 50 ng/mL IL-4 (n = 9) (iv) for 15 hours, followed by exposure to pHrodo E. coli bioparticles for 2 hours. PI is calculated as (% FITC+ cells) × (FITC+ cell MFI) and expressed as PI fold change to untreated BMDMs. FITC+ phagocytic cell percentage changes caused by Hb/heme scavenging or IL-4 treatment are shown for plasma from each patients with SCD. Solid lines correspond to increased phagocytosis (13 patients [iii]; 7 patients [iv] and dashed lines correspond to decreased phagocytosis (4 patients [iii]; 2 patients [iv]) in presence of Hb/heme scavengers or IL-4. Data are average of 3 independent experiments. Values represent mean ± SEM (n = 2/3). Statistical analysis was performed by comparing 2 groups with 2-sided Welch t tests and 3 or more groups with a 1-way ANOVA followed by a Bonferroni posttest. ∗P < .05; ∗∗P < .01.
To explore the pathophysiologic relevance of our findings for human SCD, we asked whether plasma from patients with SCD was capable of suppressing macrophage phagocytosis due to elevated free heme levels. BMDMs exposure to 10% plasma of patients with SCD suppressed cell phagocytic ability similarly to free heme (Figure 7Bi). The percentage of phagocytic BMDMs and phagocytic index correlated inversely with heme levels and positively with Hx levels in the plasma of patients with SCD (Figure 7Bii). Hb/heme scavenging by Hx/Hp as well as IL-4 treatment rescued the reduction of macrophage phagocytosis mediated by the plasma of patients with SCD to levels almost comparable to untreated BMDMs (Figure 7Biii,iv). Taken together, these data confirm that excess heme in the plasma of patients with SCD is a mediator of defective phagocytosis, which is improved by Hx and IL-4 replenishment.
Discussion
In this study, we show that heme profoundly affects macrophage functions, including immune cell recruitment ability, and efferocytic/phagocytic capacity. The underlying molecular mechanisms involve TLR4 signaling and PGC1α/PPARγ suppression, leading to defective AC recognition/uptake, mitochondrial remodeling, and impaired FAO metabolic shift. We further demonstrate that heme-driven alteration of macrophage functional properties is preventable by heme scavengers and rescued by modulators of the PGC1α/PPARγ pathway. Finally, we show that these findings are relevant for SCD pathophysiology, leading to impaired tissue damage resolution, persistent inflammation, and eventually autoimmunity.
The observation that free heme exacerbates the inflammatory response to tissue damage through macrophage-stimulated immune cell recruitment and alters macrophage functional properties extends the knowledge that heme triggers sterile inflammation by inducing macrophage proinflammatory signature in a TLR4- and ROS-dependent manner and adds novel insight into the pathogenic role of hemolysis.8,10,20,25,26,39,52 Here we show that TLR4 activation and the suppression of PGC1α/PPARγ are implicated in heme-driven defective efferocytosis.53-55 PPARγ is a member of the ligand-activated nuclear hormone receptor superfamily, which critically regulates the transcription of genes encoding major efferocytosis/phagocytosis receptors. Moreover, together with its coactivator PGC1α, PPARγ plays critical roles in energy metabolism by regulating mitochondrial homeostasis through the induction of genes involved in mitochondrial biogenesis and respiration.56-59 Furthermore, both PPARγ and PGC1α counteract proinflammatory cytokine production and induce IL-4 expression, contributing to M2 anti-inflammatory macrophage skewing.60-65 In turn, IL-4 itself, by triggering PPARγ ligand production and promoting STAT6 phosphorylation, induces PPARγ activation as well as the transcription of PGC1α/PPARγ and downstream target genes.66,67 Because of these multiple actions, deficient PPARγ/PGC1α signaling impairs macrophage-mediated AC clearance and macrophage anti-inflammatory skewing.51,68 Consistent with these observations, we show that heme-induced PGC1α/PPARγ suppression drives defective efferocytosis, which is rescued by Pio/IL-4–mediated PPARγ activation/upregulation. Because AC engulfment strengthens PPARγ activation by providing lipid ligands derived from ingested ACs and inducing IL-4,69-71 we suggest that heme limits efferocytosis initially through PPARγ downregulation and secondarily through limited PPARγ activation due to the absence of cargo-derived lipid derivatives and reduced autocrine IL-4 production.
Recently, it has been shown that heme drives a unique bioenergetic switch in macrophages, which involves a metabolic reprogramming from OXPHOS toward glucose consumption.48 In heme-treated macrophages, glucose is funneled into the PPP, which is required to efficiently detoxify heme and maintain redox homeostasis. Thus, heme loading drives a glycolytic shift in macrophages while reducing mitochondrial respiration. PPP upregulation occurs in vivo in organ systems central to heme clearance and correlates with heme levels in SCD mice.48 In line with these findings, we show that heme induces a metabolic adaptation driven by significantly altered mitochondrial mass and dynamics and hallmarked by Warburg effect/PPP shunt and reduced cell reliance on mitochondrial FAO, which was confirmed in SCD. Efferocytosis creates a metabolic emergency in the macrophage by dramatically increasing cell metabolic load. To meet the shifting metabolic requirements of efferocytosis, the engulfing macrophage increases mitochondrial biogenesis, FAO, and OXPHOS to metabolize the excess of membrane lipids of ingested ACs.69,72 The metabolic adaptation induced by heme is in line with reduced lipid load in macrophages consequent to defective lipid uptake and efferocytosis and underlies a decreased requirement for lipid catabolism. Indeed, heme-activated macrophages fail to increase mitochondrial respiration and oxygen consumption and produce less ATP when exposed to ACs. Overall, our data suggest that heme induces a coordinated functional and metabolic reprogramming of macrophages. Specifically, mitochondrial remodeling appears as a metabolic adaptation triggered by heme as part of macrophage sterile inflammation activation program, which is hallmarked by limited efferocytic process and reduced FAO requirement.
Mitochondrial dynamics and potential are essential for continual efferocytosis. Uptake of multiple ACs by macrophages requires Drp1-mediated mitochondrial fission, which allows calcium release from mitochondria to cytosol and thus calcium-dependent phagosome formation around secondarily encountered ACs.46 Mitochondrial dynamics are altered in heme-activated macrophages as indicated by Drp1 suppression and increased mitochondrial size/length. Impaired Drp1-mediated fission likely accounts for heme-suppressed continual efferocytosis owing to mitochondrial calcium sequestration. Finally, Ucp2-mediated reduction in Mt MP critically controls phagocyte engulfment capacity.47 Ucp2 decrease and increased Mt MP per mitochondria in heme-activated macrophages suggest an impairment of this mechanism, with negative impact on continual efferocytosis.
M2 anti-inflammatory macrophages commonly adopt a metabolic program fueled by FAs and OXPHOS. Thus, mitochondrial biogenesis, by allowing enhanced OXPHOS, promotes the M2 phenotype and attenuates macrophage-mediated inflammation.67,73-75 Our data suggest that heme impairs mitochondrial biogenesis/dynamics by reducing PGC1α and PPARγ expression, thus preventing macrophage anti-inflammatory skewing. Indeed, macrophages with reduced mitochondrial content show a more pronounced M1 skewing and exhibit an increased sensitivity to inflammatory stimuli as LPS.73 Importantly, efferocytosis has been crucially associated with the production of IL-10, a major mediator of inflammation resolution, through mitochondrial FAO of ACs, electron transport chain, and increased NAD+.50 Here we show that heme-suppressed efferocytosis, likely by preventing mitochondrial respiration increase, results in reduced IL-10 release in response to AC injury. Thus, the presence of hemolysis counteracts the resolution of inflammation and tissue injury upon apoptotic damage in SCD.
Indeed, efferocytosis is a major mechanism to prevent secondary necrosis of ACs, protecting tissues from exposure to inflammatory and immunogenic contents of dying cells and excessive leukocyte influx.51 When efferocytosis fails, these functions are compromised, leading to heightened inflammation, impaired resolution, and development of autoimmunity. MerTk or PPARγ targeting results in impaired efferocytosis and increased production of nuclear autoantibodies and autoimmune diseases.71,76,77 In agreement with this, heme-suppressed efferocytosis stimulates antinuclear antibody production upon hepatotoxicity. Increasing evidence of autoimmunity in patients with SCD suggest the relevance of this mechanism in this pathologic condition.78-80
Overall, our results show that, beyond sterile inflammation, hemolysis is a driver of exacerbated immune cell recruitment, defective efferocytosis, impaired resolution of inflammation, and tissue damage. This has major implications for SCD, in which the restoration of homeostasis after vaso-occlusion–induced ischemic damage is counteracted by the presence of heme excess. Our findings demonstrate that macrophage functional rewiring has therapeutic benefit for the amelioration of tissue damage and inflammation and the prevention of autoimmune diseases in SCD.
Acknowledgments
The authors thank CSL Behring for kindly providing purified human hemopexin and haptoglobin to perform the current studies.
This work was supported by a grant from the National Heart, Lung and Blood Institute of the National Institute of Health (HL149626) and a grant from the National Blood Foundation (NBF 19-08) (F.V.). Metabolomics studies were funded through a Pilot and Feasibility grant (F.V.) from U54DK110858-06 (National Institute of Diabetes and Digestive and Kidney Diseases, National Institutes of Health) in collaboration with the Center for Iron and Heme disorders, University of Utah.
Authorship
Contribution: F.V. designed and supervised the study, analyzed data, wrote the manuscript and prepared the figures; R.S. performed most of the in vitro and in vivo experiments and measurements; A.A. performed experiments to monitor cytokines, efferocytosis/FAO players, and ATP levels and to characterize mitochondria and macrophage metabolome in HbS mice; S.Z.V. performed rescue experiments in vivo and in vitro with IL-4 and plasma of patients with SCD, as well as Seahorse experiments and confocal analyses of mitochondria; Q.P. and J.E.C. performed metabolic studies; D.M., K.Y., and X.A. collected and provided plasma samples from patients with SCD and contributed to manuscript preparation.
Conflict-of-interest disclosure: The authors declare no competing financial interests. F.V. receives research funding from Silence Therapeutics, Vifor Pharma, and PharmaNutra (none of these are relevant to the current project).
Correspondence: Francesca Vinchi, Iron Research Laboratory, LFKRI, New York Blood Center, 310 E 67th St, New York, NY 10065; e-mail: FVinchi@nybc.org.

This feature is available to Subscribers Only
Sign In or Create an Account Close Modal