

Key Points
Autophagy deficiency in macrophages results in systemic parenchymal iron overload.
Erythropoietic macrophages with autophagy deficiency accumulate the iron exporter ferrorportin and have low hepcidin expression.

Abstract
Iron homeostasis depends on both intracellular control through iron-responsive proteins and the systemic level of iron through hepcidin-ferroportin axis. Indeed, the hormone hepcidin downregulates the ferroportin iron exporter to control iron recycling from macrophages and iron uptake from enterocytes. Here, we focused on the role of autophagy in macrophage iron metabolism and systemic iron homeostasis. Mice deficient for autophagy in macrophages (LysM-Atg5−/−) mimicked a primary iron overload phenotype, resulting in high ferroportin expression in both macrophages and enterocytes that correlated with marked parenchymal iron overload. Furthermore, LysM-Atg5−/− mice exhibited increased hematopoietic activity with no sign of anemia but correlating with rather high plasma iron level. Compared with wild-type cells, bone marrow–derived macrophages from LysM-Atg5−/− mice had significantly increased ferroportin expression and decreased iron content, confirming high iron export. In erythrophagocytic macrophages, autophagy regulates hemosiderin storage mechanisms as well as degradation of ferroportin and subsequently its plasma membrane localization and iron export; furthermore, ferroportin colocalization with hepcidin indicates hepcidin autocrine activity. Relatively high hepatic hepcidin expression and decreased hepcidin level in the spleen of LysM-Atg5−/− mice, correlating with low hemosiderin iron storage, as well as in erythrophagocytic Atg5−/− macrophages were evidenced. Therefore, our results highlight the critical role of autophagy in macrophages for iron trafficking and systemic iron homeostasis. We propose that in macrophages, autophagy restricts ferroportin level and iron export, resulting in hepcidin expression with an autocrine-paracrine effect that plays a role in the regulation of ferroportin expression in duodenal enterocytes.
Introduction
In mammals, iron metabolism is achieved through a complex network of specialized proteins responsible for iron uptake, transport, and storage. Most body iron (∼75%) is mobilized in the form of heme in erythrocytes.1 Macrophages recycle iron after phagocytosis of senescent or damaged red blood cells (RBCs) and act as nursing cells to support erythropoiesis2; when iron is present in excess, hepatocytes preferentially accumulate iron.1-4 In addition, dietary iron uptake through duodenal enterocytes plays an essential role in building the postnatal iron stock and satisfying iron demand. The ferroportin iron exporter is mainly found in macrophages and duodenal enterocytes and releases ferrous iron into the blood.5,6 There, after oxidation via ceruloplasmin and hephaestin, transferrin traffics ferric iron, which is subsequently acquired by cells through transferrin receptor 1 (TfR1)–mediated endocytosis.7-9
It is generally accepted that the hepatic peptide hormone hepcidin is the key regulator of systemic iron trafficking through negative control of ferroportin by inducing its degradation.9-11 Hepcidin, which is also expressed at low levels in macrophages and in other cells (eg, heart, brain, and kidney), may exert local tissue-specific functions. Hepcidin transcription is upregulated in response to elevated transferrin saturation, iron stores, and inflammation and is suppressed by hypoxia and erythropoiesis.12-16 Ferroportin is also transcriptionally regulated independently of hepcidin in response to iron, erythrophagocytosis, hypoxia, and inflammation.17-22
After TfR1-mediated endocytosis, iron is released from transferrin by STEAP3 metalloreductase and DMT1 metal transporter.23-26 In cells, only small amounts of reactive ferrous labile iron are readily available for immediate use or export. Indeed, iron is stored in a nontoxic and bioavailable ferric form in H/L ferritin heteropolymer shells.27 Alternatively, high cellular iron levels, mainly erythrophagocytic macrophages and hepatocytes, promote the accumulation of hemosiderin, a lysosomal degradation complex localized within endomembrane structures (siderosomes).3 The release of iron from ferritin primarily relies on ferritinophagy, a selective autophagic process involving the specific cargo molecule nuclear receptor coactivator 4 delivering ferritin to lysosomes.28,29 In the cytosol, ferrous ions are trafficked by binding to iron chaperones of the nuclear ribonucleoprotein family, the poly r(C) binding proteins.30-34 The intracellular iron balance is maintained by the coordinated posttranscriptional regulation of a series of key proteins through cytoplasmic sensors of labile iron, namely iron-regulatory proteins IRP1 and IRP2, which notably inversely regulate TfR1 (ie, iron absorption) and ferritin (ie, iron storage).35
Defects in the hepcidin gene itself or in genes encoding positive regulators of hepcidin (hemojuvelin, HFE, TfR2, and BMPs),9,10,36 or ferroportin mutants unresponsive to hepcidin,37 lead to unrestricted expression of membrane ferroportin, resulting in low iron levels in macrophages and enterocytes, increased serum iron indices, and systemic parenchymal iron overload. A series of gene defects that include DMT1−/−, STEAP3−/−, NCO4−/−, IRP2−/−, and the mutations causing aceruloplasminemia, hypotransferrinemia, and dominant ferroportin disease are characterized by decreased iron mobilization that compromises hematopoiesis but leads to tissue iron overload via compensatory enterocyte iron uptake.29,38-47 The increased liver hepcidin level consistent with elevated iron stores observed in these mouse models fails to limit ferroportin-mediated iron export from macrophages and enterocytes, suggesting the involvement of an additional mechanism independent of liver hepcidin signaling.
We hypothesized that macrophage iron trafficking may play a role in systemic iron homeostasis and questioned autophagy disruption. Autophagy is a mammalian system for delivering intracellular components to lysosomes for degradation or recycling. Under starvation conditions, autophagy is induced to generate nutrients and energy through degradation of macromolecules and organelles, but under nutrient-rich conditions, constitutive autophagy has a protective quality control function to degrade protein aggregates, organelles, and pathogens.48,49 Deletion of 1 of the genes encoding a core autophagy-related protein results in ineffective autophagy and causes either embryonic or neonatal lethality as a result of defects in nutrient supply, recycling, or waste disposal.50 Autophagy-related 5 gene (Atg5) expression in the brain rescues the lethal phenotype of Atg5 deficiency in mice but, despite normal organ histology, results in iron acquisition and growth impairments with anemia and unproper regulation of iron-related gene expression.51 Here, mice with targeted Atg5 deletion in monocyte/granulocyte progenitors (LysM-Atg5−/−) had dysregulated iron trafficking, ferroportin mislocalization, and low hepcidin expression in macrophages. They also had a systemic iron overload phenotype and elevated liver hepcidin levels. Indeed, autophagy in macrophage plays a critical role in intracellular ferroportin turnover, affecting iron distribution through insufficient hepcidin expression and autocrine-paracrine activity.
Materials and methods
Animals
LysM-Atg5−/− mice on C57BL/6J background were generated by crossing Atg5-floxed (Atg5fl/fl) mice52 with lysozyme M cre (LysM cre) transgenic strain.53 Details on animal breeding, care, and management are provided in the data supplement. Genotyping primers and antibody for Atg5 immunodetection are listed in supplemental Table 1.
Hematologic, serum, and iron parameters
Hematologic parameters, serum and iron parameters, and nonheme tissue iron content were analyzed as described previously54,55 and are detailed in the data supplement.
Histology, immunofluorescence, dot blot, protein analysis, and quantitative polymerase chain reaction
Conventional procedures as described in the data supplement were used; primer sequences and antibodies are listed in supplemental Tables 1 and 2.
Flow cytometric analysis
Single-cell suspensions of femoral bone marrow (BM) cells and blood cells were obtained as described previously54 and are detailed in the data supplement. Cell immunostaining and flow cytometric analysis were carried out in accordance with standard procedures (data supplement), and erythroid precursor staining was performed as previously described.56 For the fluorescence-activated cell sorting calcein assay, cells collected in phosphate-buffered saline were incubated for 15 minutes with a 0.2-μM calcein acetoxymethyl ester (Calcein-AM; Sigma Chemicals) probe; fluorescence was detected in the fluorescein isothiocyanate channel.
BM-derived macrophages and treatments
BM-derived macrophage (BMDM) preparation and treatments are described in the data supplement. Opsonized RBCs (oRBCs) were prepared as described by Kovtunovych et al.57
Statistical analysis
GraphPad Prism software was used for statistical analyses, which are detailed in the data supplement.
Results
Autophagy deficiency in myeloid cells results in high erythropoietic activity and mild liver fibrosis
We sought to determine the role of autophagy in iron metabolism, and more specifically in macrophages, by using conditional knockout mice deficient for Atg5 in myeloid macrophage/granulocyte lineage cells (LysM-Atg5−/−). The genotype of floxed mice was confirmed by polymerase chain reaction (supplemental Figure 1A). The birth of LysM-Atg5−/− mice at the expected Mendelian ratio indicated that Atg5 in macrophages was not essential for mouse embryonic development. Immunofluorescence analysis revealed specific Atg5 deletion in macrophages of spleen and liver, as well as in BMDMs, from LysM-Atg5−/− mice (supplemental Figure 1B). Although LysM-Atg5−/− mice maintained on a standard diet developed normally to adulthood, without overt abnormalities (until 18 months), and were fertile, they had reduced body weight compared with age- and sex-matched littermate wild-type (WT) controls (−5.59 ± 1.58 g for both male and female mice; supplemental Figure 1C). LysM-Atg5−/− mice had normal counts of peripheral myeloid blood cells, including monocyte, granulocyte neutrophil, and eosinophil subsets (supplemental Figure 1D).
The livers of LysM-Atg5−/− mice weighed less at 6 to 8 months and showed a noticeably lighter color than those of WT controls (Figure 1A-B), with normal liver histology and similar distribution of Kupffer cells (Figure 1B). Furthermore, low-grade liver fibrosis (Figure 1B) and, in some cases, presence of widely distributed lipid droplets, characteristic of mild steatosis, were revealed in the hepatic parenchyma of LysM-Atg5−/− compared with WT mice (supplemental Figure 2A). No overt signs of liver injury were detected in terms of serum transaminase aspartate aminotransferase (Figure 1C) or alanine aminotransferase (data not shown), inflammatory markers, or cell infiltration (Figure 1A; supplemental Figure 2B).
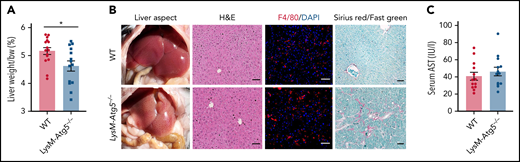
LysM-Atg5−/− mice had normal hepatic histology but mild fibrosis. (A) Histogram of the mean and standard error values with dot plots of liver weight normalized to body weight (bw; n = 14-15 in each group). (B) Representative liver anatomy of LysM-Atg5−/− and WT mice. Immunofluorescence of liver sections stained with a phycoerythrin-conjugated anti-F4/80 antibody (red) and 4′,6-diamidino-2-phenylindole (DAPI; blue) for nuclear staining showing similar Kupffer cell distribution (Leica fluorescence microcopy imaging; original magnification, 20×; scale bars, 20 μm). Liver sections stained with hematoxylin and eosin (H&E) and Sirius red with Fast green counterstaining (NanoZoomer scan imaging; original magnification, 20×; scale bars, 50 μm); Sirius red+ areas of collagen (red) are indicative of mild liver fibrosis in LysM-Atg5−/− mouse livers. Histologic staining panels are representative of LysM-Atg5−/− and WT mice (n = 8 per group). (C) Histogram of the mean and standard error values with dot plots of serum AST levels (n = 12-15 in each group). *P < .05.
LysM-Atg5−/− mice had normal hepatic histology but mild fibrosis. (A) Histogram of the mean and standard error values with dot plots of liver weight normalized to body weight (bw; n = 14-15 in each group). (B) Representative liver anatomy of LysM-Atg5−/− and WT mice. Immunofluorescence of liver sections stained with a phycoerythrin-conjugated anti-F4/80 antibody (red) and 4′,6-diamidino-2-phenylindole (DAPI; blue) for nuclear staining showing similar Kupffer cell distribution (Leica fluorescence microcopy imaging; original magnification, 20×; scale bars, 20 μm). Liver sections stained with hematoxylin and eosin (H&E) and Sirius red with Fast green counterstaining (NanoZoomer scan imaging; original magnification, 20×; scale bars, 50 μm); Sirius red+ areas of collagen (red) are indicative of mild liver fibrosis in LysM-Atg5−/− mouse livers. Histologic staining panels are representative of LysM-Atg5−/− and WT mice (n = 8 per group). (C) Histogram of the mean and standard error values with dot plots of serum AST levels (n = 12-15 in each group). *P < .05.
The spleens of LysM-Atg5−/− mice were darker and larger than those of WT mice (Figure 2A), although with similar distribution of macrophage subpopulations of red pulp (F4/80+) and marginal zone (F4/80− CD11b+; Figure 2B; supplemental Figure 3A). The red pulp reservoir of erythrophagocytic macrophages in LysM-Atg5−/− mice appeared lighter and contained significantly less visible hemosiderin pigment than that in WT controls (Figure 2Ci). Moreover, increased numbers of erythroblastic islands, where erythroid precursors develop, and RBCs, as evidenced by the increased cellularity in the subcapsular red pulp, were clearly identified in the spleens of LysM-Atg5−/− mice. Flow cytometric analysis confirmed extramedullary erythropoietic activity with increased splenic CD71+ Ter-119+ immature erythroid precursors in LysM-Atg5−/− mice (Figure 2Ci; supplemental Figure 3B).

Increased erythropoiesis in LysM-Atg5−/− mice. (A) Representative example of LysM-Atg5−/− and WT mouse spleens and ratios (%) of spleen weight to body weight (bw). Data are presented as histograms of the mean and standard error values, with individual measurements (n = 14-15 in each group). (B) Macrophage localization and cell count. Immunofluorescence with a phycoerythrin-conjugated anti-F4/80 antibody for macrophage staining (red) and 4′,6-diamidino-2-phenylindole (DAPI; blue) for nuclear staining; flow cytometric analysis results depicted as dot plot–type histograms (mean values and standard errors; n = 6) showing the F4/80+/CD11b− macrophage and CD11b+/F4/80− monocyte populations in the spleens of LysM-Atg5−/− and WT mice (Leica fluorescence microcopy imaging; original magnification, 20×; scale bars, 20 μm; gating strategy shown in supplemental Figure 3A). (C) Spleen (i) and BM (ii) histology and blood cell analysis (iii) with flow cytometric plots showing erythroid lineage cells from LysM-Atg5−/− and WT mice. (Ci) Hematoxylin and eosin (H&E)–stained sections of spleen tissue (NanoZoomer scan imaging; original magnification, 5×; scale bars, 200 μm; representative from n = 10 per group). The insets in the spleen panels show enlarged images of the boxed regions (original images, 40×; scale bars, 20 μm) showing brown hemosiderin deposits in WT mice and erythroblastic islands consisting of a central nurse macrophage surrounded by a ring of developing RBC precursors in LysM-Atg5−/− mice. (Cii) H&E-stained bone sections (Leica microcopy imaging; original magnification, 20×; scale bars, 20 μm; representative from n = 3 per group). (Ciii) Peripheral blood smears stained with May-Grunwald-Giemsa stain; arrows indicate hematoxylin blue–stained reticulocytes (NanoZoomer scan imaging; original magnification, 20×; scale bars, 20 μm). Representative flow cytometric plots for spleen, BM, and blood showing erythroid precursors based on CD71 and Ter119 markers used to separate the erythroid progenitors (gating strategy is shown in supplemental Figure 3A). The relative percentages of cells in stages I to IV of erythropoiesis with stage I single-positive CD71+ Ter119− early-stage proerythroblasts (region I), stage II double-positive CD71+ Ter119+ late-stage basophilic erythroblasts (region II), CD71low Ter119+ polychromatic and orthochromatic erythroblasts (regions III and IV), and single-positive CD71− Ter119+ CD11b+ (region IV) in LysM-Atg5−/− and WT mice are indicated (representative histograms of flow cytometry from n = 8-10 per group are shown in supplemental Figure 3B). ****P < 10−4. RP, red pulp; WP, white pulp.
Increased erythropoiesis in LysM-Atg5−/− mice. (A) Representative example of LysM-Atg5−/− and WT mouse spleens and ratios (%) of spleen weight to body weight (bw). Data are presented as histograms of the mean and standard error values, with individual measurements (n = 14-15 in each group). (B) Macrophage localization and cell count. Immunofluorescence with a phycoerythrin-conjugated anti-F4/80 antibody for macrophage staining (red) and 4′,6-diamidino-2-phenylindole (DAPI; blue) for nuclear staining; flow cytometric analysis results depicted as dot plot–type histograms (mean values and standard errors; n = 6) showing the F4/80+/CD11b− macrophage and CD11b+/F4/80− monocyte populations in the spleens of LysM-Atg5−/− and WT mice (Leica fluorescence microcopy imaging; original magnification, 20×; scale bars, 20 μm; gating strategy shown in supplemental Figure 3A). (C) Spleen (i) and BM (ii) histology and blood cell analysis (iii) with flow cytometric plots showing erythroid lineage cells from LysM-Atg5−/− and WT mice. (Ci) Hematoxylin and eosin (H&E)–stained sections of spleen tissue (NanoZoomer scan imaging; original magnification, 5×; scale bars, 200 μm; representative from n = 10 per group). The insets in the spleen panels show enlarged images of the boxed regions (original images, 40×; scale bars, 20 μm) showing brown hemosiderin deposits in WT mice and erythroblastic islands consisting of a central nurse macrophage surrounded by a ring of developing RBC precursors in LysM-Atg5−/− mice. (Cii) H&E-stained bone sections (Leica microcopy imaging; original magnification, 20×; scale bars, 20 μm; representative from n = 3 per group). (Ciii) Peripheral blood smears stained with May-Grunwald-Giemsa stain; arrows indicate hematoxylin blue–stained reticulocytes (NanoZoomer scan imaging; original magnification, 20×; scale bars, 20 μm). Representative flow cytometric plots for spleen, BM, and blood showing erythroid precursors based on CD71 and Ter119 markers used to separate the erythroid progenitors (gating strategy is shown in supplemental Figure 3A). The relative percentages of cells in stages I to IV of erythropoiesis with stage I single-positive CD71+ Ter119− early-stage proerythroblasts (region I), stage II double-positive CD71+ Ter119+ late-stage basophilic erythroblasts (region II), CD71low Ter119+ polychromatic and orthochromatic erythroblasts (regions III and IV), and single-positive CD71− Ter119+ CD11b+ (region IV) in LysM-Atg5−/− and WT mice are indicated (representative histograms of flow cytometry from n = 8-10 per group are shown in supplemental Figure 3B). ****P < 10−4. RP, red pulp; WP, white pulp.
BM of LysM-Atg5−/− mice revealed higher erythropoietic activity with increased cell density and early erythroid precursor population compared with WT controls (Figure 2Cii; supplemental Figure 3B). Results of peripheral RBC indices, blood smears, and flow cytometric analysis documented the absence of RBC abnormalities in terms of number, shape, and size in LysM-Atg5−/− mice, with levels of circulating bilirubin, erythropoietin (Figure 2Ciii; supplemental Figure 3B; Table 1), and BM erythroferrone mRNA (data not shown) similar to those in WT mice. A mild increase in immature RBCs was observed in LysM-Atg5−/− mice compared with WT controls, which usually results from the premature cell release from tissues accompanying high erythropoietic activity. Higher levels of serum iron and moderately higher transferrin saturation were observed in LysM-Atg5−/− compared with WT mice, whereas total iron binding capacity and serum ferritin levels were similar in both mice (Table 1). Thus, Atg5 deficiency in myeloid cells tended to increase iron release into blood and its use for erythropoiesis without signs of anemia.
Peripheral RBC indices and iron parameters
| Genotype | RBCs, 106/mm3 | Hb, g/dL | HCT, % | MCV, fL | Bilirubin, mg/dL | EPO, pg/mL | Serum iron, μg/dL | TIBC, μg/dL | TS, % | SF, pg/mL |
|---|---|---|---|---|---|---|---|---|---|---|
| WT/WT | 8.55 ± 0.97 | 13.62 ± 0.65 | 43.65 ± 2.84 | 46.46 ± 1.10 | 0.28 ± 0.19 | 733.71 ± 256 | 275.9 ± 90.62 | 345 ± 92 | 49.59 ± 8.8 | 119.2 ± 28.5 |
| LysM-Atg5−/− | 9.09 ± 0.61 | 13.90 ± 0.74 | 42.05 ± 2.76 | 46.31 ± 1.09 | 0.2 ± 0.13 | 726 ± 372 | 321.4 ± 115.31 | 322 ± 48 | 57.28 ± 16.8 | 123.6 ± 38.4 |
| P | .66 | .58 | .44 | .91 | .39 | .97 | .0004 | .34 | .0064 | .96 |
EPO, erythropoietin; Hb, hemoglobin; HCT, hematocrit; MCV, mean corpuscular volume; SF, serum ferritin; TIBC, total iron binding capacity; TS, transferrin saturation.
Increased ferroportin plasma membrane expression in macrophages and enterocytes of LysM-Atg5−/− mice with systemic iron overload
A large amount of Perl’s stainable nonheme iron, naturally present in macrophages primarily as hemosiderin, was observed in the spleens of WT mice, whereas LysM-Atg5−/− mice had a severely reduced amount of nonheme ferric iron in macrophages of splenic red pulp (Figure 3A). However, the total splenic iron content rather similar in both mice (Figure 3Bi) indicates higher heme iron in LysM-Atg5−/− mice, correlated with increased erythropoiesis. Furthermore, splenic ferric ferritin content was significantly higher in LysM-Atg5−/− mice than in WT mice, although ferritin expression was similar, thus indicating lower iron in the form of hemosiderin in LysM-Atg5−/− mice. The calcein fluorescence quenching assay indicated higher cytosolic labile iron pool in splenic macrophages (F4/80+CD11b−) and monocytes (F4/80− CD11b+; Figure 3C), as well as BM myeloid CD11b+Ly6C/G+ (supplemental Figure 4Ai) cell subsets, from LysM-Atg5−/− compared with WT mice. Immunofluorescence revealed a marked increase of ferroportin in splenic macrophages from LysM-Atg5−/− mice, with accumulation at the plasma membrane in isolated splenic macrophages (Figure 3D) and nucleated BM cells (supplemental Figure 4Aii) of LysM-Atg5−/− mice. In contrast, splenic macrophages of WT mice showed a predominantly ponctuated intracellular localization of ferroportin and little plasma membrane staining (Figure 3D). Therefore, these results indicated high iron mobilization from macrophages in LysM-Atg5−/− mice, consistent with increased erythropoiesis.
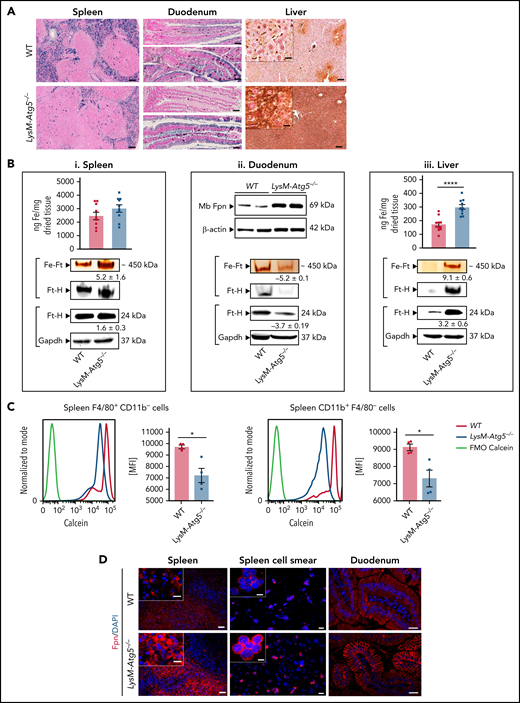
LysM-Atg5−/− mice have splenic and enterocytic iron depletion, ferroportin membrane localization, and body iron overload. (A) Histologic examination of nonheme iron deposits in the spleen, duodenum, and liver in LysM-Atg5−/− and WT mice. Nonheme iron deposition was visualized by Perl’s staining (blue) of spleen and duodenum sections and after DAB enhancement (brown) for liver sections (representative images are shown from n = 12 per group; NanoZoomer scan imaging; original magnification, 10× for spleen and liver and 20× for duodenum; scale bars, 100 μm for spleen and liver and 40 μm for duodenum; enlarged inset images, 40×; scale bars, 20 μm). The duodenum images show the proximal (top) part where food was no longer in transit and the more distal (down) part where food was in transit. Iron was localized in the apical compartment of WT enterocytes in both parts of the duodenum, whereas in LysM-Atg5−/− enterocytes, no iron was seen in the proximal duodenum, but iron was localized in both the apical and basal compartments of the distal duodenum. Enlarged liver images show Kupffer cells stained for iron in WT mice and hepatocyte staining in LysM-Atg5−/− mice. (B) Tissue iron content in the spleen (i top) and liver (iii top) in LysM-Atg5−/− and WT mice, as determined by a ferrozine assay and reported as ng of iron per mg of dried tissue. Data are presented as histograms of the mean and standard error values with dot plots (n = 10 in each group). Representative Fpn immunoblotting from duodenal membrane protein extracts (ii top) from LysM-Atg5−/− and WT mice (n = 2 samples per genotype are shown from 6 mice). Representative staining of ferric iron loaded in ferritin (Fe-Ft) and immunoblotting of ferritin H (Ft-H) in the spleen (i bottom), duodenal (ii bottom), and liver (iii bottom) extracts. For ferric iron–loaded ferritin, 25 ng of native proteins from cytosolic lysates was loaded in each lane of a nondenaturing polyacrylamide gel electrophoresis (PAGE) gel, and after electrophoresis, the gel was directly stained with Perl’s staining solution and enhanced with DAB. The gel was then immunoblotted for Ft-H as a control for the band specificity (representative images from n = 4 experiments are shown). For Ft-H western blot, 25 ng of cytoplasmic extracts was loaded on a denaturing PAGE gel, and glyceraldehyde-3-phosphate dehydrogenase (Gapdh) is shown as the loading control. Densitometric analysis was performed on the immunoblot shown as well as on immunoblots with lysates from 3 additional LysM-Atg5−/− and WT mice; after normalization to Gapdh in each lane, LysM-Atg5−/− results were normalized to the WT control group average. Data are presented as means ± standard errors. (C) Calcein fluorescence quenching assay in spleen cells from LysM-Atg5−/− and WT mice for measurement of the labile iron pool. Immediately after recovery, cells dissociated from the spleen were stained simultaneously with calcein (CA-AM) and anti-mouse PerCP-conjugated CD11b and phycoerythrin-Cy7–conjugated F4/80 antibodies and were then analyzed by flow cytometry. Gates were set on FSC, CD45, and TCRβ. Representative calcein fluorescence profiles of unstained cells (FMO-calcein) and Calcein-AM–stained cells (WT and LysM-Atg5−/−) with respect to cell markers are shown, and histograms with the mean and standard error values from 3 independent experiments are shown as dot plots (from n = 3 independent experiments). (D) Detection of ferroportin by immunofluorescence in spleen tissues, isolated cells from the spleen, and proximal duodenal villi from LysM-Atg5−/− and WT mice. Representative images are composites from ferroportin (red) and 4′,6-diamidino-2-phenylindole (DAPI)-stained nuclei (blue) (n = 4 animals per group; for spleen and spleen cell smear: Leica fluorescence microcopy imaging; original magnification, 20×; scale bars, 20 μm; enlarged inset images, magnification 100×; scale bars, 5 μm; for liver: Zeiss inverted microscopy imaging; original magnification, 20×; scale bars, 20 μm). *P < .05, ****P < 10−4. MFI, mean fluorescence intensity.
LysM-Atg5−/− mice have splenic and enterocytic iron depletion, ferroportin membrane localization, and body iron overload. (A) Histologic examination of nonheme iron deposits in the spleen, duodenum, and liver in LysM-Atg5−/− and WT mice. Nonheme iron deposition was visualized by Perl’s staining (blue) of spleen and duodenum sections and after DAB enhancement (brown) for liver sections (representative images are shown from n = 12 per group; NanoZoomer scan imaging; original magnification, 10× for spleen and liver and 20× for duodenum; scale bars, 100 μm for spleen and liver and 40 μm for duodenum; enlarged inset images, 40×; scale bars, 20 μm). The duodenum images show the proximal (top) part where food was no longer in transit and the more distal (down) part where food was in transit. Iron was localized in the apical compartment of WT enterocytes in both parts of the duodenum, whereas in LysM-Atg5−/− enterocytes, no iron was seen in the proximal duodenum, but iron was localized in both the apical and basal compartments of the distal duodenum. Enlarged liver images show Kupffer cells stained for iron in WT mice and hepatocyte staining in LysM-Atg5−/− mice. (B) Tissue iron content in the spleen (i top) and liver (iii top) in LysM-Atg5−/− and WT mice, as determined by a ferrozine assay and reported as ng of iron per mg of dried tissue. Data are presented as histograms of the mean and standard error values with dot plots (n = 10 in each group). Representative Fpn immunoblotting from duodenal membrane protein extracts (ii top) from LysM-Atg5−/− and WT mice (n = 2 samples per genotype are shown from 6 mice). Representative staining of ferric iron loaded in ferritin (Fe-Ft) and immunoblotting of ferritin H (Ft-H) in the spleen (i bottom), duodenal (ii bottom), and liver (iii bottom) extracts. For ferric iron–loaded ferritin, 25 ng of native proteins from cytosolic lysates was loaded in each lane of a nondenaturing polyacrylamide gel electrophoresis (PAGE) gel, and after electrophoresis, the gel was directly stained with Perl’s staining solution and enhanced with DAB. The gel was then immunoblotted for Ft-H as a control for the band specificity (representative images from n = 4 experiments are shown). For Ft-H western blot, 25 ng of cytoplasmic extracts was loaded on a denaturing PAGE gel, and glyceraldehyde-3-phosphate dehydrogenase (Gapdh) is shown as the loading control. Densitometric analysis was performed on the immunoblot shown as well as on immunoblots with lysates from 3 additional LysM-Atg5−/− and WT mice; after normalization to Gapdh in each lane, LysM-Atg5−/− results were normalized to the WT control group average. Data are presented as means ± standard errors. (C) Calcein fluorescence quenching assay in spleen cells from LysM-Atg5−/− and WT mice for measurement of the labile iron pool. Immediately after recovery, cells dissociated from the spleen were stained simultaneously with calcein (CA-AM) and anti-mouse PerCP-conjugated CD11b and phycoerythrin-Cy7–conjugated F4/80 antibodies and were then analyzed by flow cytometry. Gates were set on FSC, CD45, and TCRβ. Representative calcein fluorescence profiles of unstained cells (FMO-calcein) and Calcein-AM–stained cells (WT and LysM-Atg5−/−) with respect to cell markers are shown, and histograms with the mean and standard error values from 3 independent experiments are shown as dot plots (from n = 3 independent experiments). (D) Detection of ferroportin by immunofluorescence in spleen tissues, isolated cells from the spleen, and proximal duodenal villi from LysM-Atg5−/− and WT mice. Representative images are composites from ferroportin (red) and 4′,6-diamidino-2-phenylindole (DAPI)-stained nuclei (blue) (n = 4 animals per group; for spleen and spleen cell smear: Leica fluorescence microcopy imaging; original magnification, 20×; scale bars, 20 μm; enlarged inset images, magnification 100×; scale bars, 5 μm; for liver: Zeiss inverted microscopy imaging; original magnification, 20×; scale bars, 20 μm). *P < .05, ****P < 10−4. MFI, mean fluorescence intensity.
Because the duodenum and liver are critical for iron homeostasis, we analyzed these tissues in LysM-Atg5−/− mice. The duodenum of LysM-Atg5−/− mice was longer than that of WT mice (37 vs 35 cm for male mice; P = .0012). Unexpectedly, LysM-Atg5−/− mice showed marked duodenal iron absorption, evidenced by a drastic deficiency of nonheme iron deposition in enterocytes of the superior part of the duodenum (Figure 3A). Furthermore, in parts of the duodenum where food was still in transit, nonheme iron was stained in the apical and basal compartments of enterocytes from LysM-Atg5−/− mice, suggesting iron flux to export, whereas enterocytes from WT mice showed iron mostly blocked within the apical compartment (Figure 3A). The iron depletion in the duodena in LysM-Atg5−/− mice correlated with low duodenal level of ferric iron–loaded ferritin and ferritin H expression (Figure 3Bii). High ferroportin protein expression and accumulation along the basolateral plasma membrane of enterocytes and along the intestinal villi of the proximal duodenum were revealed in LysM-Atg5−/− mice, whereas these were barely detectable in WT mice (Figure 3Bii,D).
In the livers of WT mice, nonheme iron staining was observed in Kupffer cells (ie, resident hepatic sinusoidal macrophages) and in the hepatocytes, limited to the portal area of the liver lobules (Figure 3A). In contrast, LysM-Atg5−/− mice had markedly increased nonheme stainable iron deposition in hepatocytes, with a gradient extending from the portal area to the centrilobular area along the blood flow, but sparse staining in Kupffer cells (Figure 3A; supplemental Figure 4B). The hepatic nonheme iron level correlated with the elevated total tissue iron content and ferric ferritin iron content and ferritin H expression levels (Figure 3Biii). In both LysM-Atg5−/− and WT livers, ferroportin was scarcely detected in hepatocytes (supplemental Figure 4B). A full investigation of iron distribution in LysM-Atg5−/− mice showed systemic parenchymal iron accumulation within acinar cells of the exocrine pancreas, convoluted tubules in the renal medulla, cardiac muscle cells, and testicular arteriolar cells, with significantly increased iron content in the kidney and pancreas (supplemental Figure 4C). Thus, Atg5-mediated autophagy deficiency in macrophages results in redistribution of iron stores with increased ferric ferritin, plasma membrane ferroportin expression in enterocytes and macrophages, and elevated iron deposition in parenchymal tissues, indicating high iron uptake, in LysM-Atg5−/− mice compared with WT mice.
Dysregulation of iron homeostasis in LysM-Atg5−/− mice consistent with low hepcidin expression in macrophages
Accumulation of ferroportin at the cell surface membrane of macrophages and the basolateral membrane of enterocytes in LysM-Atg5−/− mice might depend on the expression of hepcidin. Indeed, we showed that the hepatic mRNA level of Hamp1, encoding hepcidin, was increased in LysM-Atg5−/− mice (Figure 4Ai). The expression levels of Id1 and Fga, 2 well-established markers of activation of Smad and Stat, which control the major signaling pathways positively regulating hepcidin expression, showed that Id1 mRNA expression was increased in the livers of LysM-Atg5−/− mice compared with WT mice and correlated with Hamp1 expression, whereas Fga expression was unaffected (Figure 4Ai). However, the ratio of hepcidin mRNA level to hepatic iron content was low (Figure 4Aii). Furthermore, immunodetected hepcidin was increased around the portal veins in the livers of LysM-Atg5−/− mice (Figure 4Aiii). The levels of serum hepcidin in LysM-Atg5−/− mice was higher than in WT mice (Figure 4B).
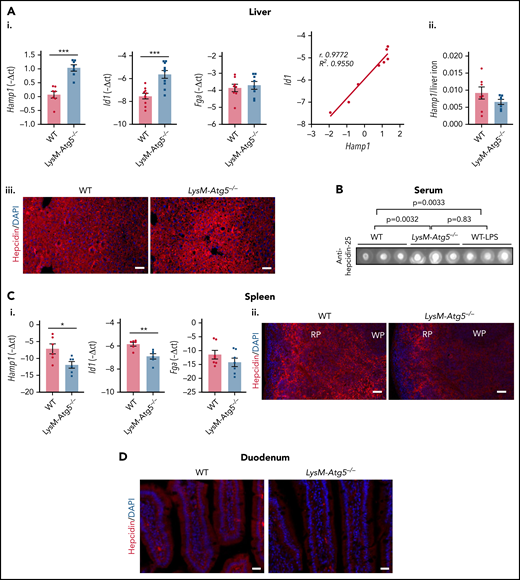
Hamp1 expression in LysM-Atg5−/− mice. (Ai) Liver Hamp1, Id1, and Fga mRNA levels (relative to Gapdh) expressed as −ΔCt values and correlation of Hamp1 and Id1 mRNA levels (n = 8 per group). (Aii) Ratio of liver Hamp1 mRNA levels to hepatic iron content. (Aiii) Detection of hepcidin by immunofluorescence in liver tissue from LysM-Atg5−/− and WT mice. Representative images are composites from hepcidin (red) and 4′,6-diamidino-2-phenylindole (DAPI)–stained nuclei (blue) (n = 4 animals per group; Leica fluorescence microcopy imaging; acquisition time, 3.000 ms; original magnification, 10×; scale bars, 50 μm). (B) Dot blotting of serum hepcidin from LysM-Atg5−/− and WT mice; 5 μL of serum samples were spotted. Three samples per genotype and controls of WT mice stimulated with lipopolysaccharide (LPS; 5 μg/25 g) 24 hours before necropsy are shown (control dot blots of 10% milk and serum from WT mice fed iron-replete, iron-deficient, and iron-rich diets are shown in supplemental Figure 4D; densitometric analysis was performed on n = 6 samples per group, and P values are given). (Ci) Spleen Hamp1, Id1, and Fga mRNA levels (relative to Gapdh) expressed as −ΔCt values (values are the mean of n = 6 experiments). Data are presented as means and standard errors (n = 6 per group). (Cii) Detection of hepcidin by immunofluorescence in spleen from LysM-Atg5−/− and WT mice. Representative images are composites from hepcidin (red) and DAPI-stained nuclei (blue) (n = 4 animals per group; Leica fluorescence microcopy imaging; acquisition time, 100 ms; original magnification, 10×; scale bars, 50 μm). (D) Detection of hepcidin by immunofluorescence in duodenum from LysM-Atg5−/− and WT mice. Representative images are composites from hepcidin (red) and DAPI-stained nuclei (blue) (n = 3 animals per group; Zeiss inverted microscopy imaging; original magnification, 10×; scale bars, 20 μm). Hepcidin protein was detected using a specific rabbit anti–hepcicin-25 antibody.58 *P < .05, **P < .01, ***P < .001. RP, red pulp; WP, white pulp.
Hamp1 expression in LysM-Atg5−/− mice. (Ai) Liver Hamp1, Id1, and Fga mRNA levels (relative to Gapdh) expressed as −ΔCt values and correlation of Hamp1 and Id1 mRNA levels (n = 8 per group). (Aii) Ratio of liver Hamp1 mRNA levels to hepatic iron content. (Aiii) Detection of hepcidin by immunofluorescence in liver tissue from LysM-Atg5−/− and WT mice. Representative images are composites from hepcidin (red) and 4′,6-diamidino-2-phenylindole (DAPI)–stained nuclei (blue) (n = 4 animals per group; Leica fluorescence microcopy imaging; acquisition time, 3.000 ms; original magnification, 10×; scale bars, 50 μm). (B) Dot blotting of serum hepcidin from LysM-Atg5−/− and WT mice; 5 μL of serum samples were spotted. Three samples per genotype and controls of WT mice stimulated with lipopolysaccharide (LPS; 5 μg/25 g) 24 hours before necropsy are shown (control dot blots of 10% milk and serum from WT mice fed iron-replete, iron-deficient, and iron-rich diets are shown in supplemental Figure 4D; densitometric analysis was performed on n = 6 samples per group, and P values are given). (Ci) Spleen Hamp1, Id1, and Fga mRNA levels (relative to Gapdh) expressed as −ΔCt values (values are the mean of n = 6 experiments). Data are presented as means and standard errors (n = 6 per group). (Cii) Detection of hepcidin by immunofluorescence in spleen from LysM-Atg5−/− and WT mice. Representative images are composites from hepcidin (red) and DAPI-stained nuclei (blue) (n = 4 animals per group; Leica fluorescence microcopy imaging; acquisition time, 100 ms; original magnification, 10×; scale bars, 50 μm). (D) Detection of hepcidin by immunofluorescence in duodenum from LysM-Atg5−/− and WT mice. Representative images are composites from hepcidin (red) and DAPI-stained nuclei (blue) (n = 3 animals per group; Zeiss inverted microscopy imaging; original magnification, 10×; scale bars, 20 μm). Hepcidin protein was detected using a specific rabbit anti–hepcicin-25 antibody.58 *P < .05, **P < .01, ***P < .001. RP, red pulp; WP, white pulp.
In the spleens of LysM-Atg5−/− mice, higher ferroportin levels and lower levels of iron than those in WT mice correlated with significantly lower levels of Hamp1 mRNA expression (Figure 4Ci). Furthermore, compared with WT mice, in LysM-Atg5−/− mice, a lower level of hepcidin protein was localized on splenic macrophages and preferentially within the outmost region farthest from blood vessels (Figure 4Ci-ii), where an iron load was also observed in macrophages. In the duodenum, hepcidin spread on the basal membrane of the enterocytes and macrophages of the duodenal mucosa of WT mice, whereas it was scarcely detected in LysM-Atg5−/− mice (Figure 4D). Therefore, despite the increase in hepatic expression of hepcidin with hepatic iron overload, the elevated level of plasma membrane ferroportin in macrophages and enterocytes in LysM-Atg5−/− mice indicated insufficient production of hepcidin in this pathologic condition to restrict membrane ferroportin from macrophages and enterocytes.
Atg5 deficiency in macrophages results in mislocalization of ferroportin and high iron efflux
We next focused on the role of autophagy in macrophage iron uptake, distribution, and sensing. After differentiation, BMDMs were treated with ferric ammonium citrate (FAC), holo-transferrin (holo-TF), or oRBCs. We verified that Atg5−/− and WT BMDMs incubated under all conditions had similar viability, membrane integrity, and cellular activity and mitochondrial dehydrogenase activity (supplemental Figure 5A).
Under all conditions, in addition to the lack of Atg5 expression, Atg5−/− BMDMs accumulated p62/SQSTM1, a widely used autophagy marker the degradation of which in autolysosomes is dependent on autophagy activity (Figure 5Ai). Compared with WT BMDMs, untreated Atg5−/− BMDMs had higher membrane ferroportin levels (Figure 5Ai) and higher basal calcein fluorescence (ie, decrease in the cellular labile iron pool and higher membrane TfR1 levels; Figure 5B; supplemental Figure 5B), indicating higher iron export.
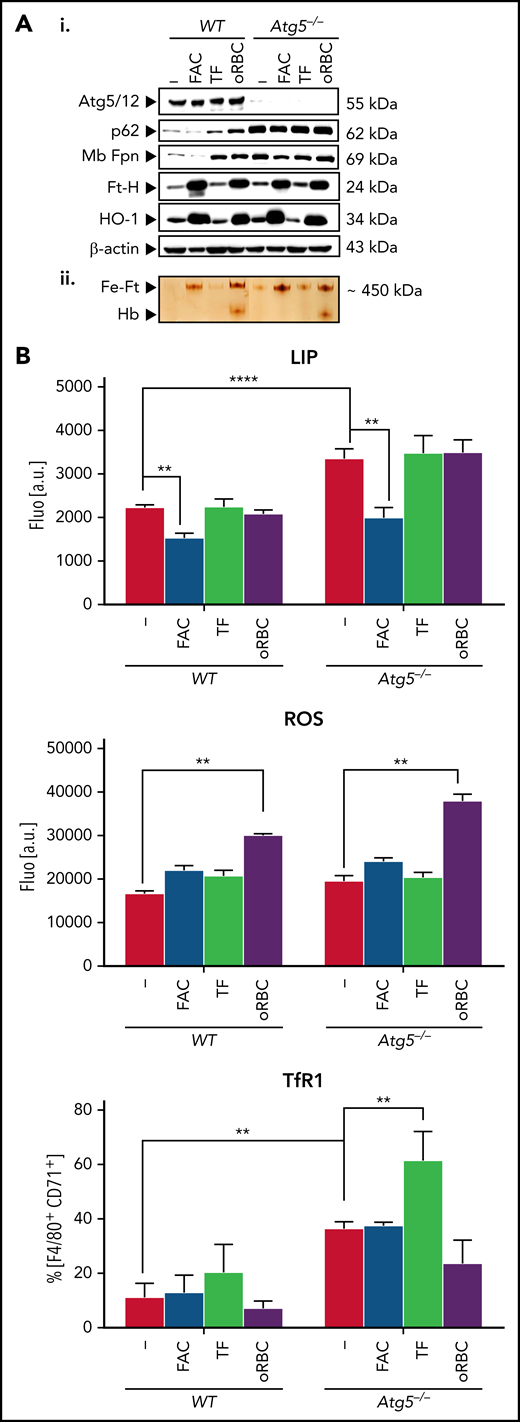
Autophagy-deficient BMDMs can form ferric ferritin and have high ferroportin levels. (A) Protein expression (i) and ferric ferritin (ii) in nontreated or treated BMDMs with FAC, holo-TF, or oRBCs. BMDMs plated (105) onto 96-well plates were treated for 16 hours either with FAC (100 μM), holo-TF (30 μM), or oRBCs (oRBCs to cells, 5:1). (Ai) Immunoblotting of Atg5 (Atg5/Atg12 complex is shown), p62, Fpn, Ft-H, HO-1, and β-actin as the loading controls. (Aii) Staining of ferric iron loaded in ferritin on native polyacrylamide gel electrophoresis (PAGE) gels in BMDMs after the indicated treatments; 25 ng of native proteins from cytosolic lysates was loaded in each lane of a nondenaturing PAGE gel, and after electrophoresis, the gel was directly stained with Perl’s staining solution and enhanced with DAB (representative images from n = 3 experiments are shown; quantitative analysis of the western blots is given in supplemental Table 3). (B) Calcein quenching assay for labile iron pool (LIP) measurement, ROS levels, and membrane TfR1 expression. Cells were plated (105) in 96-well plates and treated for 16 hours with FAC (100 μM), holo-TF (30 μM), or oRBCs (oRBCs to cells, 5:1). For intracellular LIP measurement based on calcein quenching and the ROS assay, after addition of Calcein-AM (calcein quenching assay) or H2DCFDA (ROS assay), fluorescence intensity was measured (representative analysis of n = 3 independent experiments is shown). For calcein, the mean fluorescence intensity of treated cells was normalized to that of untreated control cells. ROS production is represented as the percentage relative to that in untreated control cells. For evaluation of TfR1 membrane expression, cells were incubated with BV510 anti-CD45, phycoerythrin-Cy7 F4/80, and eFluor450 CD71 anti-mouse antibodies and analyzed by flow cytometry.
Autophagy-deficient BMDMs can form ferric ferritin and have high ferroportin levels. (A) Protein expression (i) and ferric ferritin (ii) in nontreated or treated BMDMs with FAC, holo-TF, or oRBCs. BMDMs plated (105) onto 96-well plates were treated for 16 hours either with FAC (100 μM), holo-TF (30 μM), or oRBCs (oRBCs to cells, 5:1). (Ai) Immunoblotting of Atg5 (Atg5/Atg12 complex is shown), p62, Fpn, Ft-H, HO-1, and β-actin as the loading controls. (Aii) Staining of ferric iron loaded in ferritin on native polyacrylamide gel electrophoresis (PAGE) gels in BMDMs after the indicated treatments; 25 ng of native proteins from cytosolic lysates was loaded in each lane of a nondenaturing PAGE gel, and after electrophoresis, the gel was directly stained with Perl’s staining solution and enhanced with DAB (representative images from n = 3 experiments are shown; quantitative analysis of the western blots is given in supplemental Table 3). (B) Calcein quenching assay for labile iron pool (LIP) measurement, ROS levels, and membrane TfR1 expression. Cells were plated (105) in 96-well plates and treated for 16 hours with FAC (100 μM), holo-TF (30 μM), or oRBCs (oRBCs to cells, 5:1). For intracellular LIP measurement based on calcein quenching and the ROS assay, after addition of Calcein-AM (calcein quenching assay) or H2DCFDA (ROS assay), fluorescence intensity was measured (representative analysis of n = 3 independent experiments is shown). For calcein, the mean fluorescence intensity of treated cells was normalized to that of untreated control cells. ROS production is represented as the percentage relative to that in untreated control cells. For evaluation of TfR1 membrane expression, cells were incubated with BV510 anti-CD45, phycoerythrin-Cy7 F4/80, and eFluor450 CD71 anti-mouse antibodies and analyzed by flow cytometry.
Incubation with FAC (16 hours) led to marked calcein quenching (ie, increase in the labile iron pool) in both Atg5−/− and WT BMDMs, whereas the intracellular labile iron pool was barely affected in either cell type after incubation with holo-TF or oRBCs compared with control incubation (Figure 5B). Both WT and Atg5−/− BMDMs incubated with FAC and oRBCs exhibited high ferric ferritin accumulation (Figure 5Aii), concomitant with increased ferritin H and HO-1 expression (Figure 5Ai) as well as ROS levels after oRBCs treatment (Figure 5B); incubation with holo-TF resulted in a modest increase in ferric ferritin levels. Therefore, autophagy deficiency did not impair iron uptake or ferritin iron storage.
The kinetics of BMDMs treated with oRBCs revealed a strong expression of Hif2α and Hmox1 at 2 to 4 hours, indicating heme catabolism concomitant with nonheme iron accumulation, in both WT and Atg5−/− BMDMs (Figures 6A-Ci; supplemental Figure 6Ai). In WT erythrophagocytic BMDMs, after an apparent decrease of p62/SQSTM1 and LC3I (which was likely due to an increase of proteins from RBCs), a decrease in p62/SQSTM1 protein level at 16 to 24 hours and increased conversion of cytosolic LC3I into the lipidated II form were observed, indicating autophagy activation (Figure 6A). In both WT and Atg5−/− macrophages, at early time points (30 minutes to 1 hour), densitometric analysis revealed an increase in ferroportin from membrane protein extracts, whereas ferroportin gene expression markedly increased at later time points (8-16 hours), correlating with high intracellular iron content (Figure 6A-Ci; supplemental Figure 6Ai) and indicating a high amount of ferroportin derived from RBCs. After 8 to 16 hours, ferroportin drastically decreased from membrane protein extracts (Figure 6A) and was localized in perinuclear aggregates, which looked like aggresomes (Figure 6Cii; supplemental Figure 6Aii). In WT macrophages, ferroportin colocalized with Atg5 in cytoplasmic vesicles as soon as at 8 hours, peaking at 16 hours (Figure 6D; supplemental Figure 6B). Furthermore, in Atg5−/− BMDMs, higher levels of ferroportin relocated to the membranes at 24 hours compared with WT cells (Figures 6A-Cii; supplemental Figure 6Aii), indicating impaired degradation of ferroportin through autophagy in Atg5−/− macrophages.
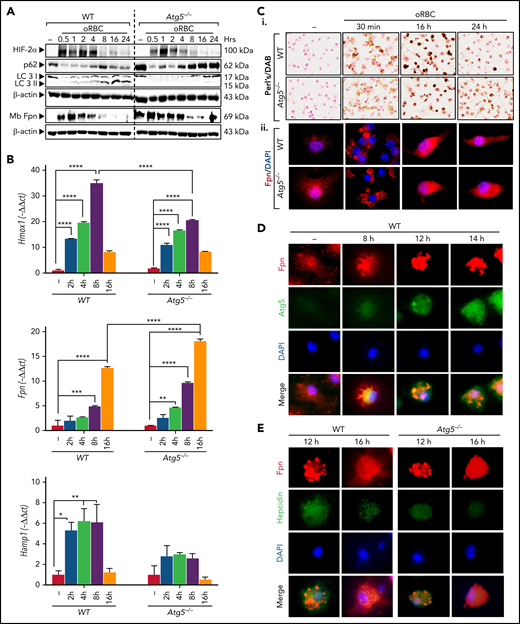
Erythrophagocytosis activates autophagy in BMDMs, and autophagy deficiency in BMDMs abrogates ferroportin degradation. (A) Expression kinetics in BMDMs treated with oRBCs. Atg5−/− and WT BMDMs were incubated with oRBCs (oRBCs to cells, 5:1) for the indicated times. Western blot analysis of Hif2α, p62, and LC3 from total protein extracts and Fpn from membrane extracts, and β-actin as control, in BMDMs from LysM-Atg5−/− and WT mice incubated with oRBCs (oRBCs to cells, 5:1) for the indicated times. After treatment with oRBCs, protein was extracted from BMDMs for western blot analysis (representative analysis of n = 3 independent experiments is shown; quantitative analysis of the western blots is given in supplemental Table 4). (B) Kinetics of Hmox1, Fpn, and Hamp1 mRNA expression in BMDMs treated with oRBCs. Representative mRNA fold changes (relative to Gapdh) expressed as −ΔΔCt values (n = 3 replicates). Data are presented as means and standard errors. (C) Iron loading and ferroportin localization in BMDMs from LysM-Atg5−/− and WT mice treated with oRBCs. (Ci) Representative images of Perl’s/DAB iron–stained BMDMs (NanoZoom scan imaging; original magnification, 40×). BMDMs cultured on slides incubated for the indicated times after treatment with oRBCs (oRBCs to cells, 5:1) were fixed with paraformaldehyde for immunostaining or with methanol for Perl’s staining followed by DAB enhancement. (Cii) Detection of ferroportin by immunofluorescence in BMDMs from LysM-Atg5−/− and WT mice. Images are composites of ferroportin (red) and 4′,6-diamidino-2-phenylindole (DAPI)–stained nuclei (blue) (Leica fluorescence microcopy imaging; original magnification, 100×; representative images shown are from n = 4 independent experiments). (D) Immunofluorescence colocalization of ferroportin in BMDMs from WT mice treated with oRBCs. WT BMDMs were double labeled with a rabbit anti-Fpn antibody and Alexa Fluor 488–conjugated secondary donkey anti-rabbit immunoglobulin G (IgG; red), followed by rabbit anti-Atg5 antibody and TRITC-conjugated goat secondary anti-rabbit IgG (green). Cell nuclei were stained with DAPI (blue). Erythrophagocytosis resulted in colocalization of ferroportin and Atg5 in erythrophagocytic BMDMs at 8 to 16 hours (Leica fluorescence microcopy imaging; original magnification, 40×; representative images shown are from n = 2 independent experiments). (E) Immunofluorescence colocalization of ferroportin and hepcidin in BMDMs from LysM-Atg5−/− and WT mice treated with oRBCs. WT and Atg5−/− BMDMs were double labeled with a rabbit antiferroportin antibody and Alexa Fluor 488–conjugated secondary donkey anti-rabbit IgG (red), followed by rabbit antihepcidin antibody58 and TRITC-conjugated secondary goat anti-rabbit IgG (green). Cell nuclei were stained with DAPI (blue). Erythrophagocytosis resulted in colocalization of ferroportin and hepcidin in WT cells at 12 hours and Atg5−/− cells at 16 hours (Leica fluorescence microcopy imaging; original magnification, 40×; representative images shown are from n = 2 independent experiments). *P < .05, **P < .01, ***P < .001, ****P < 10−4.
Erythrophagocytosis activates autophagy in BMDMs, and autophagy deficiency in BMDMs abrogates ferroportin degradation. (A) Expression kinetics in BMDMs treated with oRBCs. Atg5−/− and WT BMDMs were incubated with oRBCs (oRBCs to cells, 5:1) for the indicated times. Western blot analysis of Hif2α, p62, and LC3 from total protein extracts and Fpn from membrane extracts, and β-actin as control, in BMDMs from LysM-Atg5−/− and WT mice incubated with oRBCs (oRBCs to cells, 5:1) for the indicated times. After treatment with oRBCs, protein was extracted from BMDMs for western blot analysis (representative analysis of n = 3 independent experiments is shown; quantitative analysis of the western blots is given in supplemental Table 4). (B) Kinetics of Hmox1, Fpn, and Hamp1 mRNA expression in BMDMs treated with oRBCs. Representative mRNA fold changes (relative to Gapdh) expressed as −ΔΔCt values (n = 3 replicates). Data are presented as means and standard errors. (C) Iron loading and ferroportin localization in BMDMs from LysM-Atg5−/− and WT mice treated with oRBCs. (Ci) Representative images of Perl’s/DAB iron–stained BMDMs (NanoZoom scan imaging; original magnification, 40×). BMDMs cultured on slides incubated for the indicated times after treatment with oRBCs (oRBCs to cells, 5:1) were fixed with paraformaldehyde for immunostaining or with methanol for Perl’s staining followed by DAB enhancement. (Cii) Detection of ferroportin by immunofluorescence in BMDMs from LysM-Atg5−/− and WT mice. Images are composites of ferroportin (red) and 4′,6-diamidino-2-phenylindole (DAPI)–stained nuclei (blue) (Leica fluorescence microcopy imaging; original magnification, 100×; representative images shown are from n = 4 independent experiments). (D) Immunofluorescence colocalization of ferroportin in BMDMs from WT mice treated with oRBCs. WT BMDMs were double labeled with a rabbit anti-Fpn antibody and Alexa Fluor 488–conjugated secondary donkey anti-rabbit immunoglobulin G (IgG; red), followed by rabbit anti-Atg5 antibody and TRITC-conjugated goat secondary anti-rabbit IgG (green). Cell nuclei were stained with DAPI (blue). Erythrophagocytosis resulted in colocalization of ferroportin and Atg5 in erythrophagocytic BMDMs at 8 to 16 hours (Leica fluorescence microcopy imaging; original magnification, 40×; representative images shown are from n = 2 independent experiments). (E) Immunofluorescence colocalization of ferroportin and hepcidin in BMDMs from LysM-Atg5−/− and WT mice treated with oRBCs. WT and Atg5−/− BMDMs were double labeled with a rabbit antiferroportin antibody and Alexa Fluor 488–conjugated secondary donkey anti-rabbit IgG (red), followed by rabbit antihepcidin antibody58 and TRITC-conjugated secondary goat anti-rabbit IgG (green). Cell nuclei were stained with DAPI (blue). Erythrophagocytosis resulted in colocalization of ferroportin and hepcidin in WT cells at 12 hours and Atg5−/− cells at 16 hours (Leica fluorescence microcopy imaging; original magnification, 40×; representative images shown are from n = 2 independent experiments). *P < .05, **P < .01, ***P < .001, ****P < 10−4.
Hepcidin mRNA expression increased at 2 to 8 hours in WT cells (Figure 6B), but less so in Atg5−/− cells (Figure 6B). Intracellular hepcidin colocalized with ferroportin in the periphery of aggresomes, peaking at 12 hours, at a lower level in Atg5−/− than in WT cells, indicating that hepcidin is involved in autocrine signaling for ferroportin proteasomal degradation (Figure 6E; supplemental Figure 6C). Overall, both proteasomal and autophagy degrade ferroportin in erythrophagocytic macrophages. Furthermore, Fpn mRNA expression at 16 hours may contribute to membrane protein turnover. However, in Atg5−/− macrophages, the lack of functional autophagy and low hepcidin expression impaired ferroportin degradation after erythrophagocytosis, which led to increased plasma membrane ferroportin expression.
Discussion
Here, we focused on the role of autophagy in macrophage iron metabolism. We show that in macrophages, after erythrophagocytosis, the ferroportin from the rich membrane of RBCs59 accumulates in perinuclear aggregates, or aggresome, the holding stations of proteins for autophagy process. Although in WT macrophages the ferroportin is largely degraded, autophagy deficiency in Atg5−/− macrophages compromises intracellular ferroportin degradation, resulting in a high level of ferroportin protein relocalization on the plasma membrane. Cells use 2 main routes for degrading intracellular proteins, the ubiquitin-proteasome and autophagy-lysosome pathways, which are coordinated.60 Notably, protein accumulation in a single juxtanuclear aggresome has been observed in pathologic and nonpathologic situations.61 Disassembly and clearance of aggresomes depend on both proteasomal activity62 and efficient capture into autophagic structures.63-65 It has been shown that turnover of DMT1, the transporter for iron uptake into enterocytes and iron egress from endosomes during the transferrin cycle, as well as TfR1 is controlled through both proteasomal and lysosomal autophagic degradation, and deficiency of degradation impairs iron homeostasis.66-68 Here, our results reveal that in macrophages, erythrophagocytosis activates autophagy, which is then used as the main process for ferroportin protein degradation and turnover, thus controlling the level of iron release, whereas proteasomal protein degradation may be sufficient in cells with low ferroportin turnover.
LysM-Atg5−/− mice had drastically reduced levels of splenic Perl’s stainable ferric iron but relatively high ferric ferritin content. In cells, nonheme iron is stored in ferritin complexes in a manner primarily related to iron concentration. However, over a high iron concentration range, iron-loaded ferritin complexes are converted into hemosiderin complexes, membrane vesicles produced after lysosomal degradation that predominate in macrophages.3,69-71 Therefore, in macrophages of LysM-Atg5−/− mice, autophagy deficiency impairs the shift from fully loaded ferritin to the hemosiderin compartment, leading to an increase in iron mobilization from its storage site72 and thus participating in its cell release.
In WT BMDMs, hepcidin expression increases early after erythrophagocytosis and colocalization with ferroportin indicate that hepcidin would be involved as an autocrine signal for ferroportin degradation. In LysM-Atg5−/− mice, high liver hepcidin correlated with high iron content and low ferroportin in hepatocytes, whereas ferroportin was high in macrophages and enterocytes. Comparison of WT and hepcidin knockout mice73 revealed that the liver hepcidin produced in WT mice degrades hepatocyte ferroportin but is not sufficient to degrade macrophage ferroportin, indicating the primarily autocrine role of hepcidin. At the systemic level, conditional deletion of the essential autophagy gene Atg5 in macrophages led to the accumulation of ferroportin at the plasma membrane in macrophages and, unexpectedly, at the basolateral membrane in absorptive enterocytes, where it plays a major role in iron export to blood. These observations are consistent with the relatively low level of iron in splenic macrophages. The rather high blood iron indices and increased erythropoietic activity in the BM and spleen, without signs of anemic stress, corroborated the uncontrolled iron efflux and iron mobilization for erythropoiesis in LysM-Atg5−/− mice. Furthermore, high iron efflux correlated with systemic parenchymal iron overload, primarily in hepatocytes, and increased hepatic expression of hepcidin. However, the increased hepatic level of hepcidin, as well as serum level, in LysM-Atg5−/− mice failed to limit ferroportin-mediated iron export from macrophages and enterocytes. Mice deficient for autophagy in macrophages are characterized by cellular iron depletion and low hepcidin expression, whereas rather high levels of hepcidin and ferroportin proteins localized to macrophages indicate insufficient hepcidin to degrade the elevated level of membrane ferroportin. It has been shown that elevated liver iron levels modulate hepcidin expression even in mice overexpressing Epo, thus limiting the maximum hepcidin expression level.74 In LysM-Atg5−/− mice, the absence of erythropoietic demand indicates that another signal may be implicated in systemic ferroportin control. We observed that LysM-Atg5−/− mouse spleens had lower levels of hepcidin than WT mouse spleens, conversely to hepatic and serum hepcidin levels, indicating that macrophages contribute to systemic iron regulation (Figure 7).

Schematic figure of key similarities and differences between WT and LysM-Atg5−/− mice. (A) WT mice. Erythrocytes are phagocytosed by macrophages. Macrophages efficiently recycle phagocytosed iron to transferrin in the circulation, and with the help of autophagy (ATG), the excess iron is stored in hemosiderin. A small amount of iron uptake by enterocytes is released from enterocytes; most is stored in ferritin. Tranferrin-bound iron is carried to BM. Iron is incorporated into newly formed erythrocytes within the BM. Hepcidin produced from hepatocytes and macrophages controls cell iron release. (B) LysM-Atg5−/− mice. Erythrocytes are phagocytosed by macrophages. Macrophages efficiently recycle phagocytosed iron to transferrin in the circulation, but without functional ATG, ferroportin from RBCs cannot be sufficiently degraded, and the excess iron cannot be stored in hemosiderin. High iron release from macrophages decreases hepcidin expression. A large amount of iron is released from macrophages and absorbed from enterocytes. Tranferrin-bound iron is carried in excess to BM and extramedullary sites of erythropoiesis. Iron is incorporated into an excess of newly formed erythrocytes. Dashed lines indicate iron transit.
Schematic figure of key similarities and differences between WT and LysM-Atg5−/− mice. (A) WT mice. Erythrocytes are phagocytosed by macrophages. Macrophages efficiently recycle phagocytosed iron to transferrin in the circulation, and with the help of autophagy (ATG), the excess iron is stored in hemosiderin. A small amount of iron uptake by enterocytes is released from enterocytes; most is stored in ferritin. Tranferrin-bound iron is carried to BM. Iron is incorporated into newly formed erythrocytes within the BM. Hepcidin produced from hepatocytes and macrophages controls cell iron release. (B) LysM-Atg5−/− mice. Erythrocytes are phagocytosed by macrophages. Macrophages efficiently recycle phagocytosed iron to transferrin in the circulation, but without functional ATG, ferroportin from RBCs cannot be sufficiently degraded, and the excess iron cannot be stored in hemosiderin. High iron release from macrophages decreases hepcidin expression. A large amount of iron is released from macrophages and absorbed from enterocytes. Tranferrin-bound iron is carried in excess to BM and extramedullary sites of erythropoiesis. Iron is incorporated into an excess of newly formed erythrocytes. Dashed lines indicate iron transit.
Human disorders and knockout mouse models related to iron-modulating proteins have provided important insights into the maintenance of iron homeostasis. Dominant ferroportin disease results in iron accumulation in macrophages, mild anemia with low transferrin saturation but hyperferritinemia, and increased liver iron and hepcidin levels.47,75 In this disease, it has been shown that ferroportin accumulates in intracellular vesicles from erythrophagocytic macrophages and thus has less efficient relocalization to membrane. Furthermore, inhibition of endocytosis leads to complete redistribution of ferroportin on the plasma membrane in WT macrophages.75 Therefore, ferroportin likely traffics between the plasma membrane and endomembrane in WT macrophages, and it has been suggested that ferroportin can localize in hemosiderin structures.76-78 Furthermore, both iron treatment and erythrophagocytosis increase ferroportin transcription and induce ferroportin relocalization to the plasma membrane in WT macrophages.18,78 Macrophages represent an essential compartment for iron homeostasis, and the process of autophagy affects ferroportin trafficking and turnover. Autophagy deficiency in macrophages impairs proper ferroportin degradation and turnover after erythrophagocytosis and increases its relocalization to the plasma membrane, which leads to excess iron release from macrophages, and enterocytes, which triggers increased erythropoiesis and parenchymal iron overload.
A large amount of iron traffics to macrophages, and accumulating data suggest that tissue macrophages are ferrostats that sense and respond to local tissue iron needs, thereby regulating iron availability in the local microenvironment and contributing to systemic iron homeostasis.79 Here, in LysM-Atg5−/− mice, increased membrane ferroportin levels in enterocytes and splenic macrophages were consistent with low expression of hepcidin by macrophages and insufficient expression by hepatocytes. Taken together, our results in mice with autophagy-deficient macrophages provide new insight into the major role of macrophages in iron sensing and systemic iron homeostasis. In macrophages, the lack of ferroportin degradation led to low labile iron content and decreased hepcidin expression. Therefore, we propose that the unrestricted membrane ferroportin expression observed in enterocytes results from autocrine-paracrine regulation of ferroportin by hepcidin expression in widely distributed resident macrophages.
Acknowledgments
The authors thank Valérie Quesniaux and Bernhard Ryffel (Unité Mixte de Recherche 7355, Centre National de la Recherche Scientifique [CNRS], Oléans, France) for helpful discussion. The authors acknowledge David Gosset of the P@CYFIC platform for fluorescent Zeiss microscopy imaging (Center for Molecular Biophysics, Unité Propre de Recherche 4301, CNRS, Orléans, France).
This study was supported by CNRS and University Orléans, Fondation pour la Recherche Médicale (grant EQU202003010405), and European funding in Region Centre-Val de Loire (European Regional Development Fund grants EX005756 and EX010381). M.T. received thesis financial support from Region Centre-Val de Loire.
M.T. is a PhD candidate at Université d'Orléans, France, and this work is submitted in partial fulfillment of the requirement for her thesis.
Authorship
Contribution: M.T. performed most experiments, analyzed data, created the figures, and contributed to writing of the manuscript; I.M. performed experiments; M.L.B. carried out breeding and genetic testing to produce the conditional LysM-Atg5−/− mice; and C.M. designed the research, analyzed data, and wrote the paper.
Conflict-of-interest disclosure: The authors declare no competing financial interests.
Correspondence: Catherine Mura, UMR 7355, 3B rue de la Ferollerie, 45071 Orléans, France; e-mail: catherine.mura@cnrs-orleans.fr.
The online version of this article contains a data supplement.
The publication costs of this article were defrayed in part by page charge payment. Therefore, and solely to indicate this fact, this article is hereby marked “advertisement” in accordance with 18 USC section 1734.

This feature is available to Subscribers Only
Sign In or Create an Account Close Modal