

Key Points
Frequency of activated CD4dimCD8+ T cells is increased in HLH/MAS, regardless of the underlying condition/trigger.
CD4dimCD8+ T-cell frequency distinguishes patients with MAS/sHLH from patients with active sJIA and is associated with MAS/sHLH severity.

Abstract
CD8+ T-cell activation has been demonstrated to distinguish patients with primary and infection-associated hemophagocytic lymphohistiocytosis (HLH) from patients with early sepsis. We evaluated the activation profile of CD8+ T cells in patients with various forms of secondary HLH (sHLH), including macrophage activation syndrome (MAS). Peripheral blood mononuclear cells from children with inactive systemic juvenile idiopathic arthritis (sJIA, n = 17), active sJIA (n = 27), MAS in sJIA (n = 14), infection-associated HLH (n = 7), and with other forms of sHLH (n = 9) were analyzed by flow cytometry. Compared with patients with active sJIA, in patients with MAS and sHLH of different origins, beside a significant increase in the frequency of CD38high/HLA-DR+CD8+ T cells, we found a significant increase in the frequency of CD8+ T cells expressing the CD4 antigen (CD4dimCD8+ T cells). These cells expressed high levels of the activation markers CD38 and HLA-DR, suggesting they were a subset of CD38high/HLA-DR+CD8+ T cells, as well as of the activation/exhaustion markers CD25, PD1, CD95, and interferon-γ. The frequency of CD4dimCD8+ T cells strongly correlated with most of the laboratory parameters of MAS severity and with circulating levels of CXCL9 and interleukin-18. These findings were confirmed in a prospective replication cohort in which no expansion of any particular T-cell receptor Vβ family in CD3+ T cells of patients with sHLH was found. Finally, frequency of CD4dimCD8+, but not of CD38high/HLA-DR+CD8+ T cells, significantly correlated with a clinical severity score, further supporting the involvement of these cells in MAS/sHLH pathogenesis.
Introduction
Hemophagocytic lymphohistiocytosis (HLH) is a clinical syndrome characterized by uncontrolled activation of immune cells, leading to systemic hyperinflammation and multiorgan failure, and is invariably fatal if left untreated.1 HLH is classified into primary and secondary forms.2 Primary HLH (pHLH) is caused by inherited defects in proteins involved in the cytotoxic machinery of natural killer (NK) and cytotoxic T cells. Secondary HLH (sHLH) occurs as a complication of infections, malignancies, immune deficiencies, genetically defined autoinflammatory disorders (eg, CDC42- and NLRC4- associated diseases),3,4 and rheumatic diseases, the latter being referred to as macrophage activation syndrome (MAS).5 Although the contributing mechanisms and triggers underlying primary and secondary HLH are different, all HLH forms share the same clinical features and have common biochemical and immunologic abnormalities.6
In most pHLH animal models, expansion and prolonged activation of CD8+ T cells and excessive interferon γ (IFNγ) production are the main drivers of the disease and its manifestations.7-9 Conversely, although expansion of IFNγ-producing CD8+ lymphocytes has been reported in livers of patients with sHLH and in a lymph node of 1 patient with MAS,10,11 the role of these cells in the pathogenesis of the disease is not clearly established. Indeed, in 2 different murine models of sHLH, CD8+ T cells were minimally activated or dispensable for the development of the disease.12,13 In humans, some indirect observations strongly support a role for T-cell hyperactivation in sHLH, including marked increase in soluble CD25 (mainly released by activated T cells),14 highly elevated levels of the T-cell activating factor interleukin-18 (IL-18),15 and therapeutic efficacy of cyclosporine-A.16
Recently, Chaturvedi et al17 demonstrated that patients with pHLH or with infection-associated secondary HLH (iaHLH) show an expansion of circulating activated CD38high/HLA-DR+CD8+ T cells. The frequency of these cells in peripheral blood reliably distinguished these patients from those with early sepsis.17
Here, we studied the activation profile of CD8+ T cells in patients with different forms of sHLH, including MAS, and evaluated whether it was able to discriminate patients with MAS during systemic juvenile idiopathic arthritis (sJIA) or with other forms of sHLH from patients with autoinflammation, such as active sJIA.
Materials and methods
Patients
Seventy-four patients, 32 females, followed at the Division of Rheumatology of Bambino Gesù Children’s Hospital, were enrolled in the study. At the time of sampling, 17 patients had inactive sJIA, 27 had active sJIA, 14 had MAS in the context of sJIA, 7 had iaHLH, and 9 had HLH secondary to other triggers (other sHLH), including 2 patients with neonatal-onset cytopenia, autoinflammation, and recurrent hemophagocytic lymphohistiocytosis (NOCARH) syndrome (mutated in p.R186C CDC42),3 1 NLRC4-mutated patient, 2 patients with unknown immune deficiencies, 2 patients with lymphoma, 1 patient with Kikuchi Fujimoto disease, and 1 patient with Rasmussen syndrome (Table 1). The diagnosis of sJIA was made according to the International League of Associations for Rheumatology (ILAR) criteria.18 Clinical inactive disease in sJIA was defined according to the Wallace criteria.19 All patients with MAS met the 2016 The European Alliance of Associations for Rheumatology (EULAR)/The American College of Rheumatology (ACR) classification criteria for MAS complicating sJIA.20 All patients with sHLH met the HLH-2004 diagnostic guidelines.14
Demographic, clinical, and laboratory characteristics of the patients enrolled in the study
| Inactive sJIA (N = 17) | Active sJIA (N = 27) | MAS (N = 14) | iaHLH (N = 7*) | Other sHLH (N = 9†) | |
|---|---|---|---|---|---|
| Sex, female‡ | 7 (41.2) | 12 (44.4) | 8 (57.1) | 3 (42.9) | 2 (22.2) |
| Age at sampling (y)§ | 8.6 (6.8-13.7) | 9.8 (4.5-12.9) | 11.6 (5.8-15.1) | 2.8 (1.3-5.2) | 7.0 (1.8-9.8) |
| Days from onset of symptoms§ | — | 17.0 (9.5-22.0) | 18.5 (12.0-26.0) | 18.0 (15.0-41.0) | 34.0 (16.0-191.0) |
| Clinical features at sampling | |||||
| Fever‡ | 0 (0.0) | 25 (92.6) | 14 (100.0) | 6 (85.7) | 8 (88.9) |
| Splenomegaly‡ | 0 (0.0) | 6 (22.2) | 8 (57.1) | 5 (71.4) | 6 (66.7) |
| Laboratory features at sampling | |||||
| Ferritin (ng/mL)§ | 32 (22-58) | 738 (326-4 289) | 7 979 (3 298-24 741) | 8 211 (3 267-38 346) | 9 989 (3 597-16 462) |
| CRP (mg/dL)§ | 0.07 (0.03-0.19) | 8.99 (4.66-17.05) | 4.30 (2.32-8.79) | 1.54 (0.92-2.60) | 1.61 (1.15-16.39) |
| WBC (×103/μL)§ | 5.8 (5.2-7.6) | 14.9 (8.2-18.6) | 5.3 (4.2-9.3) | 4.9 (4.0-7.4) | 2.9 (1.1-6.8) |
| Neutrophils (×103/μL)§ | 2.8 (2.3-3.2) | 11.9 (5.2-16.8) | 5.5 (3.0-7.2) | 0.9 (0.6-2.6) | 1.5 (0.8-2.3) |
| Hb (g/dL)§ | 13.2 (11.8-13.7) | 11.0 (10.2-11.8) | 11.0 (10.1-12.7) | 8.7 (8.3-10.0) | 8.8 (8.0-10.1) |
| PLTs (×103/μL)§ | 260 (248-301) | 405 (273-526) | 184 (103-225) | 99 (75-134) | 84 (39-135) |
| AST (U/L)§ | 23 (21-31) | 36 (25-44) | 87 (68-175) | 295 (174-337) | 98 (76-139) |
| LDH (U/L)§ | 323 (218-472) | 506 (377-673) | 1 066 (667-1 506) | 2 840 (2 144-3 973) | 1 389 (913-2 318) |
| Triglycerides (mg/dL)§ | 65 (47-98) | 104 (71-128) | 196 (178-268) | 296 (184-353) | 444 (334-495) |
| Fibrinogen (mg/dL)§ | 259 (237-348) | 635 (509-697) | 344 (311-385) | 143 (123-195) | 308 (123-350) |
| MAS/HLH biomarkers at sampling | |||||
| CXCL9 (pg/mL)§,‖ | 300 (300-582) | 300 (300-300) | 4 753 (2 763-9 750) | 17 133 (5 163-28 023) | 3 089 (2 753-9 103) |
| IL-18 (pg/mL)§,¶ | 11 971 (322-45 750) | 17 505 (4 208-32 279) | 139 121 (46 814-292 061) | 16 941 (286-100 678) | 11 813 (5 593-37 220) |
| Any treatment at sampling‡ | 12 (70.6) | 10 (37.0) | 7 (50.0) | 1 (14.3) | 9 (100.0) |
| Glucocorticoids < 14 d‡ | 0 (0.0) | 5 (18.5) | 6 (42.8) | 1 (0.14) | 3 (33.3) |
| Glucocorticoids ≥ 14 d‡ | 3 (17.6) | 3 (11.1) | 0 (0.0) | 0 (0.0) | 6 (66.7) |
| Anakinra‡ | 11 (64.7) | 1 (3.7) | 2 (14.3) | 0 (0.0) | 3 (33.3) |
| Other treatment‡,# | 1 (5.9) | 3 (11.1) | 1 (7.1) | 1 (14.2) | 4 (44.4) |
CRP, C-reactive protein; Hb, hemoglobin; PLTs, platelets; WBC, white blood cells.
Three EBV, 2 leishmania, 1 CMV, and 1 bocavirus.
Two p.R186C CDC42 mutated patients, 1 NLRC4-mutated patient, 2 unknown immune-deficiencies, 2 tumors, 1 Kikuchi Fujimoto disease, and 1 Rasmussen syndrome.
Number (percentage).
Median (first to third quartile).
Median (first to third quartile) in healthy controls in our laboratory, 612 (430-802) pg/mL.
Median (first to third quartile) in healthy controls in our laboratory, 265 (221-305) pg/mL.
Cyclosporine-A (9), tocilizumab (1), canakinumab (1), and emapalumab (1).
The study has been conducted according to the criteria set by the declaration of Helsinki, and each subject signed an informed consent before participating to the study.
Of the 74 patients sampled, 35 (47.3%) were not receiving any treatment at time of sampling. Twenty-seven patients (36.5%) were on glucocorticoids, of whom 12 had been on glucocorticoids for more than 14 days. Seventeen (25%) patients were on anakinra, whereas 10 patients (14.7%) were receiving different treatments, including cyclosporine-A (9 patients), tocilizumab (1 patient), canakinumab (1 patient), or emapalumab (1 patient).
The clinical severity score was based on the following 4 parameters: (1) dose of glucocorticoids (score 0: low doses of prednisolone equivalent [≤2 mg/kg per day]; score 1: high doses of prednisolone equivalent [>2 mg/kg per day]); (2) length of hospitalization (score 0: ≤15 days; score 1: between 15 and 30 days; score 2: >30 days); (3) admission to intensive care unit (score 0: no; score 1: yes); and (4) death (score 0: no; score 1: yes).
Three patients with primary HLH, followed at Department Onco-Haematology and Cell and Gene Therapy, meting the HLH-2004 diagnostic guidelines,14 were also enrolled in the study. Patients were 1, 6, and 21 months of age at diagnosis and were carriers of homozygous mutations in PRF1 (c.50delT), STXBP2 (c.1430C>T), and RAB27A (c.514_518delCAAGC) genes, respectively. At time of bone marrow (BM) sampling, all patients were treatment naïve.
The replication cohort was composed of 16 patients with MAS/sHLH (5 patients with MAS in sJIA, 4 patients with iaHLH, and 7 patients with sHLH of other origins) and 9 patients with active sJIA. Of the 16 patients with MAS/sHLH, 5 (31%) were not receiving any treatment at the time of sampling. Ten patients (63%) were on glucocorticoids, and 6 of them were receiving glucocorticoids for at least 14 days. Four patients (25%) were on anakinra, whereas 3 patients (19%) were receiving different treatment for MAS/HLH, including cyclosporine-A (1 patient), canakinumab (1 patient), and ruxolitinib (1 patient).
The study was approved by the Ospedale Pediatrico Bambino Gesù Ethical Committee (1282_OPBG_2016).
Mononuclear cells isolation, cell stimulation, and flow cytometry analysis
Mononuclear cells (MCs) were isolated from peripheral blood and BM samples by Ficoll centrifugation (LiStarFish). MCs were stained for surface markers with antibodies against CD3 (Clone UCHT1), CD4 (Clone SK3), CD8 (Clone RPA-T8), CD38 (Clone HB-7) HLA-DR (Clone L243), CD95 (Clone DX2), CD25 (Clone M-A251), and PD1 (Clone MIH4) (all from BD Biosciences). The gating strategy for the identification of CD38high/HLA-DR+CD8+ T cells and CD4dimCD8+ T cells is shown in supplemental Figure 1 (available on the Blood Web site). For IFNγ production experiments, peripheral blood mononuclear cells (PBMCs) and MCs from BM were left unstimulated for 4 hours at 37°C in the presence of brefeldin A. Following incubation, cells were stained for surface markers with antibodies against CD3 (Clone UCHT1), CD4 (Clone RPA-T4), and CD8 (Clone RPA-T8), (all from BD Biosciences). Cells were then permeabilized and fixed with the kit “FoxP3 Staining Buffer Set” (Miltenyi), according to the manufacturer’s procedures. For IFNγ intracellular staining, cells were incubated with the anti-IFNγ antibody (BD Biosciences) for 30 minutes at 4°C, washed, and resuspended in phosphate-buffered saline for flow cytometry analysis. Cell viability was evaluated by 7-aminoactinomycin D staining (BD Biosciences). Only samples with more than 90% live cells were used. Samples were acquired using LSRFortessa X-20 flow-cytometer (BD Biosciences), and data were analyzed with the FACSDiva Software (BD Biosciences).
Cytokine measurements
Levels of IFNγ, Granzyme B, IL-2, and tumor necrosis factor-α released in supernatants by sorted CD4dimCD8+ T cells and CD4−CD8+ T cells were measured by Ella Automated Immunoassay System (600-100), according to the manufacturer’s instructions.
Serum levels of CXCL9 and IL-18 were measured by enzyme-linked immunosorbent assay, using commercial kits (R&D Systems and MBL International, respectively), according to the manufacturer’s instructions.
Quantitative determination of the T-cell receptor Vβ repertoire
The T-cell receptor (TCR) Vβ repertoire was analyzed in PBMCs isolated from 16 patients with MAS/sHLH and 9 patients with active sJIA using the β Mark TCR Vβ Repertoire Kit (Beckman Coulter). Briefly, cells were first labeled with surface marker antibodies for the expression of CD3, CD8, CD4, CD38, and HLA-DR for 20 minutes at 4°C and then were washed with phosphate-buffered saline and split in 8 wells of 96-round bottom plates. The TCR Vβ repertoire was labeled following the manufacturer’s instructions and acquired (100 000 events on CD3+ cells) by Cytoflex LX (Beckman Coulter) and analyzed by Kaluza Software (v 2.1, Beckman Coulter).
Statistical analysis
For non-normally distributed data, differences between groups were analyzed using the Kruskal-Wallis test and the post hoc uncorrected Dunn’s test for multiple comparisons. Data were expressed as median and interquartile range. Unpaired and paired comparisons were performed by Mann-Whitney or Wilcoxon test, respectively. Correlations were tested using Spearman’s rank order test. Receiver operating characteristic (ROC) curve analysis was used to determine the optimal cutoff values discriminating patients with MAS or patients with sHLH of different origins from patients with active sJIA. The significance level for all statistical tests was P < .05. Graphpad Prism 9 software was used for statistical analysis and graphs.
Results
Patients with inactive or active sJIA, with MAS occurring during sJIA, with iaHLH, or with sHLH of other origins (other sHLH) were enrolled in this study. Demographic and clinical characteristics and the levels of the MAS biomarkers IL-18 and CXCL9 are shown in Table 1.
Flow cytometry analysis of PBMCs showed that the percentage of CD38high/HLA-DR+CD8+ T cells in patients with MAS, iaHLH, and other sHLH was markedly higher than in patients with inactive or active sJIA (P < .001, for all comparisons; Figure 1A-B). It was not affected by glucocorticoid treatment for longer than 14 days (Figure 1B). ROC curve analysis showed that the percentage of CD38high/HLA-DR+CD8+ T cells was able to reliably discriminate patients with all forms of sHLH (MAS, iaHLH, and other sHLH) from those with active sJIA (area under the curve [AUC] = 0.94, P < .001; Figure 1C). It also discriminated patients with MAS (AUC = 0.96, P < .001) and iaHLH plus others sHLH from active sJIA (AUC = 0.93, P < .001; supplemental Figure 2).
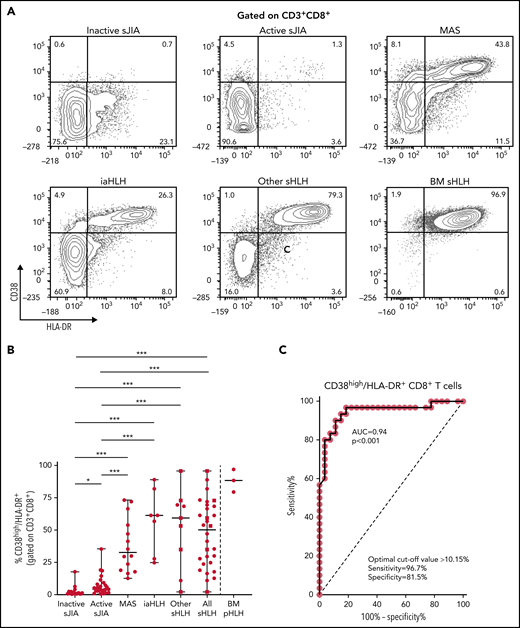
Percentage of circulating CD38high/HLA-DR+ CD8+ T cells is significantly increased in patients with all forms of secondary HLH and reliably distinguishes patients with MAS from those with active sJIA. (A) Representative fluorescence-activated cell sorter (FACS) profile showing the percentage of peripheral blood CD38high/HLA-DR+ cells, gated on CD3+CD8+ T cells, in each group of patients. Results obtained in mononuclear cells isolated from bone marrow of 3 patients with primary HLH (BM pHLH) are also reported. (B) Percentage of CD38high/HLA-DR+ cells, gated on CD8+ T cells, in the different patient groups. Patients who were receiving glucocorticoids longer than 2 weeks are reported as filled squares. *P ≤ .05; ***P ≤ .001. (C) ROC curve analysis of CD38high/HLA-DR+ CD8+ T cells was performed comparing all patients with MAS/sHLH (n = 30) and patients with active sJIA (n = 27).
Percentage of circulating CD38high/HLA-DR+ CD8+ T cells is significantly increased in patients with all forms of secondary HLH and reliably distinguishes patients with MAS from those with active sJIA. (A) Representative fluorescence-activated cell sorter (FACS) profile showing the percentage of peripheral blood CD38high/HLA-DR+ cells, gated on CD3+CD8+ T cells, in each group of patients. Results obtained in mononuclear cells isolated from bone marrow of 3 patients with primary HLH (BM pHLH) are also reported. (B) Percentage of CD38high/HLA-DR+ cells, gated on CD8+ T cells, in the different patient groups. Patients who were receiving glucocorticoids longer than 2 weeks are reported as filled squares. *P ≤ .05; ***P ≤ .001. (C) ROC curve analysis of CD38high/HLA-DR+ CD8+ T cells was performed comparing all patients with MAS/sHLH (n = 30) and patients with active sJIA (n = 27).
PBMC immunophenotyping also revealed the presence of a significantly higher percentage of CD8+ T cells coexpressing the CD4 marker (CD4dimCD8+ T cells) in patients with MAS or with other forms of sHLH, regardless they were receiving glucocorticoid therapy, compared with patients with inactive or active sJIA (P < .001, for all comparisons; Figure 2A-B). ROC curve analysis showed that the percentage of CD4dimCD8+ T cells reliably discriminated patients with all forms of sHLH from those with active sJIA (AUC = 0.92, P < .001; Figure 2C). We also looked at subgroups of sHLH and found that it discriminated patients with MAS (AUC = 0.90, P < .001) and iaHLH plus others patients with sHLH from patients with active sJIA (AUC = 0.94, P < .001; supplemental Figure 3A-B).
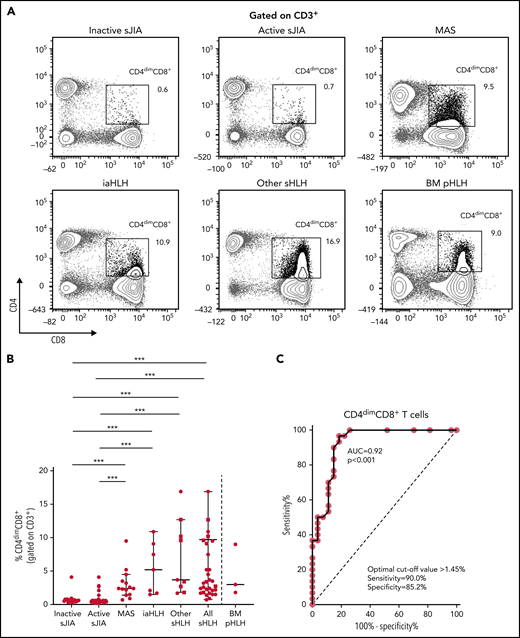
Percentage of CD4dimCD8+ T cells is significantly increased in patients with all forms of secondary HLH and reliably distinguishes patients with MAS from those with active sJIA. (A) Representative FACS profile showing the percentage of CD4dimCD8+ T cells, gated on CD3+ cells, in each group of patients. Results obtained in mononuclear cells isolated from bone marrow of 3 patients with primary HLH (BM pHLH) are also reported. (B) Percentage of CD4dimCD8+ T cells, gated on CD3+ cells, in the different patient groups. Patients who were receiving glucocorticoids longer than 2 weeks are reported as filled squares. ***P ≤ .001. (C) ROC curve analysis of CD4dimCD8+ T cells was performed comparing patients with MAS/sHLH (n = 30) and patients with active sJIA (n = 27).
Percentage of CD4dimCD8+ T cells is significantly increased in patients with all forms of secondary HLH and reliably distinguishes patients with MAS from those with active sJIA. (A) Representative FACS profile showing the percentage of CD4dimCD8+ T cells, gated on CD3+ cells, in each group of patients. Results obtained in mononuclear cells isolated from bone marrow of 3 patients with primary HLH (BM pHLH) are also reported. (B) Percentage of CD4dimCD8+ T cells, gated on CD3+ cells, in the different patient groups. Patients who were receiving glucocorticoids longer than 2 weeks are reported as filled squares. ***P ≤ .001. (C) ROC curve analysis of CD4dimCD8+ T cells was performed comparing patients with MAS/sHLH (n = 30) and patients with active sJIA (n = 27).
To evaluate whether the percentage of CD4dimCD8+ T cells was increased also in patients with pHLH, BM MCs of 3 patients with pHLH were analyzed. Consistent with recent evidence,17 in these patients, we not only confirmed the presence of a high percentage of CD38high/HLA-DR+CD8+ T cells (Figure 1A-B) but also demonstrated a high frequency of CD4dimCD8+ T cells (Figure 2A-B).
CD4dimCD8+ T cells have been shown to be highly activated and cytolytic CD8+ mature T cells, expressing high levels of IFNγ.21-24 To further characterize their activation profile in patients with MAS/sHLH, we analyzed the expression of the activation markers CD38 and HLA-DR. We found that, compared with CD8+ T cells not expressing CD4 (CD4−CD8+ T cells), a markedly higher percentage of CD4dimCD8+ T cells expressed high levels of both CD38 and HLA-DR (Figure 3), strongly suggesting that these cells are a subset of CD38high/HLA-DR+CD8+ T cells. In addition, a significantly higher frequency of CD4dimCD8+ T cells expressed the activation/exhaustion markers CD25, PD1, and CD95 (Figure 3), indicating that these cells represent a homogenous highly activated subpopulation of CD8+ T cells. We also found that the frequency of IFNγ-positive cells was significantly higher among CD4dimCD8+ than among CD4−CD8+ T cells from peripheral blood of patients with MAS and from BM of patients with pHLH (Figure 4). Accordingly, when peripheral CD4dimCD8+ T cells and CD4−CD8+ T cells were sorted and cultured ex vivo, CD4dimCD8+ T cells tended to spontaneously release higher amount of IFNγ compared with CD4−CD8+ T cells (supplemental Figure 4). Incidentally, levels of other proinflammatory and cytolytic mediators, including Granzyme B, IL-2, and tumor necrosis factor-α, were not differentially released by the 2 cell subsets (supplemental Figure 4).
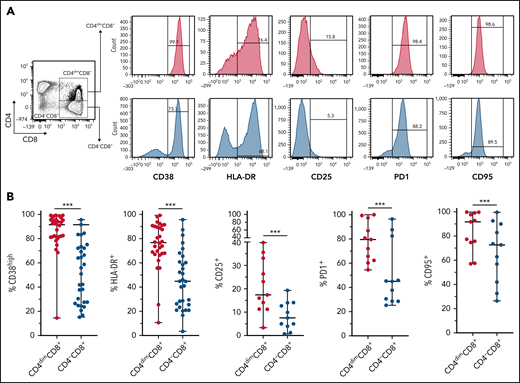
CD4dimCD8+ T cells are highly activated cells. (A-B) Representative FACS plots and cumulative data showing the percentage of CD38, HLA-DR, CD25, PD1, CD95, and positive cells among CD4dimCD8+ T cells and CD4−CD8+ T cells are reported. Statistical significance was calculated using Wilcoxon's matched pairs signed rank test. ***P ≤ .001.
CD4dimCD8+ T cells are highly activated cells. (A-B) Representative FACS plots and cumulative data showing the percentage of CD38, HLA-DR, CD25, PD1, CD95, and positive cells among CD4dimCD8+ T cells and CD4−CD8+ T cells are reported. Statistical significance was calculated using Wilcoxon's matched pairs signed rank test. ***P ≤ .001.
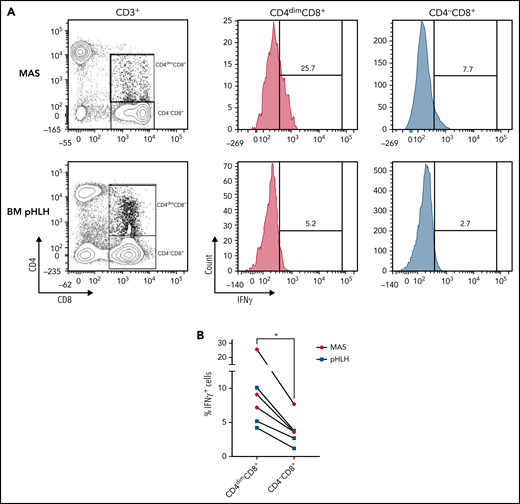
Compared with CD4−CD8+ T cells, a higher frequency of CD4dimCD8+ T cells express IFNγ. (A-B) Representative FACS plots and cumulative data showing the percentage of IFNγ-expressing CD4dimCD8+ T cells and CD4−CD8+ T cells. Unstimulated peripheral blood mononuclear cells of 3 MAS patients and mononuclear cells of 3 pHLH patients were analyzed by flow cytometry. Statistical significance was calculated by using Wilcoxon's matched pairs signed rank test. *P < .05.
Compared with CD4−CD8+ T cells, a higher frequency of CD4dimCD8+ T cells express IFNγ. (A-B) Representative FACS plots and cumulative data showing the percentage of IFNγ-expressing CD4dimCD8+ T cells and CD4−CD8+ T cells. Unstimulated peripheral blood mononuclear cells of 3 MAS patients and mononuclear cells of 3 pHLH patients were analyzed by flow cytometry. Statistical significance was calculated by using Wilcoxon's matched pairs signed rank test. *P < .05.
Finally, we evaluated whether the percentage of activated CD8+ T cells correlated with laboratory parameters of disease severity in patients with MAS. The percentage of CD38high/HLA-DR+CD8+ T cells correlated with some laboratory parameters (ferritin: r = 0.60, P = .02; hemoglobin: r = −0.68, P = .009; lactate dehydrogenase [LDH]: r = 0.74, P = .003; Table 2). Notably, the percentage of CD38high/HLA-DR+CD8+ T cells was significantly correlated with circulating levels of IL-18 (r = 0.68, P = .008) but not with the levels of the IFNγ-inducible chemokine CXCL9 (r = 0.41, P = .14). By contrast, the frequency of CD4dimCD8+ T cells not only strictly correlated with most of the laboratory parameters of disease severity (ferritin: r = 0.55, P = .04; aspartate transaminase [AST]: r = 0.65, P = .013; LDH: r = 0.8, P = .001; triglycerides: r = 0.73, P = .004; fibrinogen: r = −0.73, P = .004) and with circulating levels of IL-18 (r = 0.58, P = .009), but also with serum CXCL9 levels (r = 0.59, P = .02; Table 2).
Correlations of frequency of different activated CD8+ T-cell subpopulations with laboratory parameters of MAS activity/severity and circulating levels of the MAS/HLH biomarkers CXCL9 and IL-18
| CD8+ T cell subset | Spearman correlation (r), P-value (P) | Ferritin | Hemoglobin | Neutrophils | Platelets | AST | LDH | Triglycerides | Fibrinogen | CXCL9 | IL-18 |
|---|---|---|---|---|---|---|---|---|---|---|---|
| CD38high/HLA-DR+CD8+ | r | 0.60 | −0.68 | 0.055 | 0.008 | 0.43 | 0.74 | 0.49 | −0.52 | 0.41 | 0.68 |
| P | .02 | .009 | .85 | .97 | .13 | .003 | .07 | .056 | .14 | .009 | |
| CD4dimCD8+ | r | 0.55 | −0.50 | −0.14 | −0.23 | 0.65 | 0.8 | 0.73 | −0.73 | 0.59 | 0.58 |
| P | .046 | .07 | .62 | .41 | .013 | .001 | .004 | .004 | .02 | .03 |
Statistically significant correlations (P < .05) and the respective Spearman correlation coefficient are italic.
To validate our findings, we immunophenotyped the CD8+ T-cell population in a replication cohort consisting of 16 patients with sHLH (5 MAS, 4 iaHLH, and7 sHLH of other origin) and 9 patients with active sJIA. We confirmed that both the percentage of CD38high/HLA-DR+CD8+ T (data not shown) and of CD4dimCD8+ T cells was significantly higher in patients with MAS/sHLH than in patients with active sJIA (P < .001; supplemental Figure 5A). CD4dimCD8+ T cells frequency was able to distinguish the patients with sHLH from patients with active sJIA (AUC = 0.93, P < .001; supplemental Figure 5B), with a cutoff level and an AUC similar to that observed in the discovery cohort.
In the replication cohort, to address the question whether the expansion of both CD38high/HLA-DR+CD8+ T cells and CD4dimCD8+ T cells in MAS/sHLH was secondary to antigen-induced activation, we also analyzed the TCR Vβ repertoire using a flow cytometric approach. We did not find expansion of any particular TCR Vβ family in CD3+ T cells of patients with MAS/sHLH compared with those of patients with active sJIA (Figure 5). We found a statistically significant, albeit modest, decrease in the frequency of 3 TCR Vβ families (14, 16, and 21.3) in patients with MAS/sHLH compared with that observed in patients with active sJIA. Moreover, no correlations between percentages of these specific TCR Vβ subsets and frequency of both CD38high/HLA-DR+CD8+ T cells and CD4dimCD8+ T cells were found (data not shown), further suggesting their antigen-independent activation.
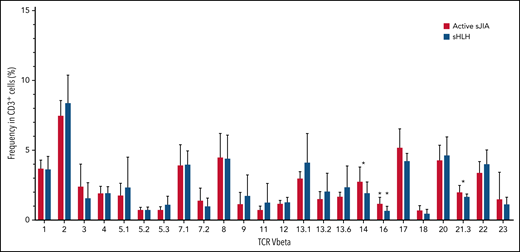
TCR Vβ repertoire of patients with MAS/sHLH does not show expansion of a particular TCR Vβ in CD3+ T cells compared with patients with active sJIA. The TCR Vβ repertoire was evaluated in peripheral CD3+ cells of patients enrolled in the replication cohort (16 patients with MAS/sHLH and 9 patients with active sJIA). Statistical significance was calculated using the Mann-Whitney test. *P < .05.
TCR Vβ repertoire of patients with MAS/sHLH does not show expansion of a particular TCR Vβ in CD3+ T cells compared with patients with active sJIA. The TCR Vβ repertoire was evaluated in peripheral CD3+ cells of patients enrolled in the replication cohort (16 patients with MAS/sHLH and 9 patients with active sJIA). Statistical significance was calculated using the Mann-Whitney test. *P < .05.
Finally, we evaluated whether the expansion of activated CD8+ T cells was associated with disease severity of all patients with sHLH enrolled in both discovery and replication cohorts (n = 46). The frequency of CD4dimCD8+ T cells, but not of CD38high/HLA-DR+CD8+ T cells, was significantly associated with the clinical severity score (r = 0.56, P < .0001 vs r = 0.2, P = .16, respectively; Figure 6); this finding supports the involvement of CD4dimCD8+ T cells in the pathogenesis of the disease.
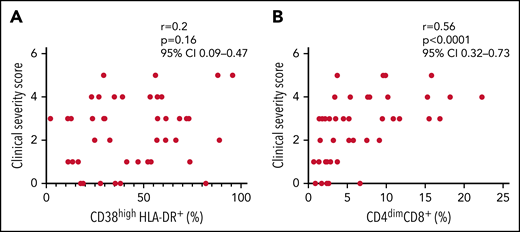
Frequency of CD4dimCD8+ T cells, but not of CD38high/HLA-DR+ CD8+ T cells, is significantly associated to the clinical severity score. (A-B) Correlations between clinical severity score and frequencies of CD38high/HLA-DR+ CD8+ T cells and CD4dimCD8+ T cells. Correlations were tested using Spearman’s rank order test. The clinical severity score is based on the following 4 variables: death, length of hospitalization, stay in intensive care unit, and dose of glucocorticoids, scored as described in the "Materials and methods" section.
Frequency of CD4dimCD8+ T cells, but not of CD38high/HLA-DR+ CD8+ T cells, is significantly associated to the clinical severity score. (A-B) Correlations between clinical severity score and frequencies of CD38high/HLA-DR+ CD8+ T cells and CD4dimCD8+ T cells. Correlations were tested using Spearman’s rank order test. The clinical severity score is based on the following 4 variables: death, length of hospitalization, stay in intensive care unit, and dose of glucocorticoids, scored as described in the "Materials and methods" section.
Discussion
In this study, we confirm and extend the observations by Chaturvedi et al17 by showing that highly activated CD38high/HLA-DR+CD8+ T cells are expanded, not only in patients with pHLH or iaHLH, but also in those with MAS and other forms of sHLH. Their expansion reliably distinguishes not only patients with pHLH or iaHLH from those with sepsis17 but also patients with MAS or sHLH from patients with active sJIA. Notably, we also report that patients with MAS and with all forms of HLH, regardless of the underlying condition or trigger, are characterized by the expansion of an additional highly activated CD8+ T-cell subpopulation, the CD4dimCD8+ T cells. These cells express high levels of the activation/exhaustion markers CD38, HLA-DR, CD25, PD1, and CD95 and express IFNγ. Also, CD4dimCD8+ T cells are significantly increased in patients with sHLH, regardless of the underlying condition or trigger, and their expansion reliably distinguishes patients with MAS or other sHLH from patients with autoinflammation (ie, sJIA) and, importantly, are associated with the severity of the disease.
Circulating CD4dimCD8+ T cells are highly activated cells that have been recently identified in humans, monkeys, mice, and rats.24,25 CD4 expression on CD8+ T lymphocytes has been demonstrated to modulate cytotoxic T-lymphocyte function and to play a crucial role in vivo in cellular-mediated responses to viruses and alloantigens.21,23-25
Consistent with the data mentioned above, we demonstrate that CD4dimCD8+ T cells are a very homogeneous subset of highly activated CD8+ T cells, uniformly expressing high levels of the activation markers CD38 and HLA-DR. In addition, compared with CD4-CD8+ T cells, they express significantly higher levels of the activation/exhaustion markers CD25, PD1, and CD95, and of the proinflammatory cytokine IFNγ, further suggesting that these cells constitute a distinct highly activated subpopulation of the CD8+ T cells. We also found that the percentage of CD4dimCD8+ T cells strongly correlates with most of the laboratory parameters of MAS severity, including ferritin, AST, LDH, triglycerides, fibrinogen, and, notably, with circulating levels of IL-18 and the IFNγ-induced chemokine CXCL9.15,26 Interestingly, Chaturvedi et al did not observe any correlation between percentage of CD38high/HLA-DR+ CD8+ T cells and laboratory parameters of disease severity,17 possibly because of the heterogeneity of their cohorts. Indeed, in the very homogenous, largely untreated population of patients with MAS, we found that CD38high/HLA-DR+CD8+ T cells were significantly correlated with some of the laboratory parameters of disease severity, such as ferritin, hemoglobin, LDH, and IL-18, but not with the IFNγ-related MAS/sHLH biomarker CXCL9. Notably, we also found that frequency of CD4dimCD8+ T cells was significantly associated with MAS/sHLH severity, as assessed by clinical severity score, further supporting the involvement of activated CD4dimCD8+ T cells in the pathogenesis and progression of the disease.
Expansion of CD38high/HLA-DR+CD8+ T cells has been recently demonstrated in patients with COVID-19 and in children developing multisystem inflammatory syndrome after SARS-CoV-2 infection.27-29 Altogether, our data and these observations further support the involvement of highly activated CD8+ T cells in the development and progression of hyperinflammatory diseases, including pHLH, sHLH, MAS, and hyperinflammatory COVID-19, falling under the umbrella of the term “cytokine storm syndrome.”30 We found that frequency of CD38high/HLA-DR+CD8+ T cells was not associated with the severity of MAS/sHLH. Consistent with these observations, also in SARS-CoV-2 infection, the role of CD38high/HLA-DR+CD8+ T cells is to date contradictory. Although some studies showed a significant increase in the frequency of these cells in patients with a more severe disease,31,32 other studies reported no differences in their frequency between mild and severe patients or even markedly higher frequency in recovering patients than in patients with a more persistent disease.33,34
In this study, we demonstrated that the CD8+ T-cell activation observed in patients with MAS/sHLH was antigen independent. In patients with multisystem inflammatory syndrome that are characterized by a marked increase in the CD38high/HLA-DR+CD8+ T cells, a selective expansion of the TCR Vβ 21.3 in T cells was found.35 This finding is consistent with antigen-driven oligoclonal expansion of selected subpopulations of CD8+ T cells. In sharp contrast, in CD8+ T cells of patients with MAS/sHLH, we did not find selective expansion of any specific TCR Vβ gene. To the best of our knowledge, this is the first study investigating the TCR Vβ repertoire in patients with sHLH. Our observation, suggesting an antigen-independent activation and expansion of CD8+ T cells, is consistent with a generalized hyperinflammatory state during sHLH associated with polyclonal rather than oligoclonal expansion and activation of CD8+ T cells.
CD38high/HLA-DR+CD8+ T cells may comprise a variety of subpopulations. Among these, CD4dimCD8+ T cells appear to be a homogeneous, highly activated population expressing activation/exhaustion markers and IFNγ, whose expansion, notably, is correlated to levels of disease relevant cytokines, to a number of disease severity parameters, and to severity of the outcome.
The findings reported in this study have implications for clinical practice. Assessment of CD38high/HLA-DR+CD8+ T associated to that of CD4dimCD8+ T cells represents a valuable tool to discriminate patients with MAS or with HLH secondary of other origins from patients with autoinflammation. This may have a significant value in the clinical setting in guiding the diagnostic workup, at a time in which early identification of patients with HLH/MAS syndrome provides opportunity for earlier treatments and better management. Indeed, despite significant advances in the understanding of the pathogenesis of HLH/MAS, prompt diagnosis remains challenging. This assay, based on flow cytometry, on a few antibodies that are widely available, and on simple gating strategies, offers advantage compared with other proposed biomarkers, including assessment of levels of phosphorylated STAT1 in monocytes,36 plasma ADA2 activity,37 or even levels of circulating CXCL9. Indeed, the latter assays are based on sophisticated and/or nonvalidated technologies and have been shown to be affected by glucocorticoids treatment. Notably, our results suggest that the number of CD38high/HLA-DR+CD8+ T and of CD4dimCD8+ T cells is not affected by glucocorticoids. Accordingly, treatment shorter than 2 weeks with glucocorticoids did not affect the number of CD38high/HLA-DR+CD8+ T cells in patients with pHLH.17 Despite the strength of our findings and the integration with those reported by Chathurvedi et al,17 multicenter studies on a larger number of patients are needed to find the best cutoff values of CD38high/HLA-DR+CD8+ T cells and of CD4dimCD8+ T cells for the early diagnosis and identification of critically ill patients with MAS/sHLH.
In addition of being a diagnostic biomarker, the assessment of CD4dimCD8+ T cells may have a prognostic value. We found that high frequency of CD4dimCD8+ T cells was associated with the subsequent development of unfavorable outcome. Our clinical severity score was based on simple end points including death, length of hospitalization, stay in intensive care unit, and dose of glucocorticoids. It certainly requires validation and potential improvement. However, it should be pointed out that no prognostic score for the severity of the course of MAS/HLH is, to the best of our knowledge, thus far available.
Finally, given the high morbidity and mortality associated with HLH/MAS with currently available therapeutic untargeted approaches, more efficacious, possibly targeted, treatments are needed. Indeed, consistent with our results showing that CD4dimCD8+ T cells produce higher levels of IFNγ than CD4−CD8+ T cells and are correlated with disease severity, as well as with the IFNγ-induced chemokine CXCL9, a recent study demonstrated that the IFNγ-neutralizing monoclonal antibody emapalumab displayed remarkable efficacy in patients with pHLH38,39; promising preliminary data have also been reported in MAS and sHLH.40-42 The evidence showing the expansion in HLH of activated CD4dimCD8+ T cells, homogeneously expressing high levels of CD38, also supports the rationale for an additional targeted strategy based on daratumumab, a monoclonal antibody directed against CD38. Daratumumab has been reported to be efficacious in the treatment of sHLH occurring in a patient with multiple myeloma, independently of the impact on the malignancy that showed progression.43
In conclusion, our results provide novel insights on the pathophysiology of sHLH in its various forms and a simple diagnostic tool for the early identification of suspected HLH and MAS, independently of the underlying trigger or condition. They also suggest a potential prognostic relevance of the assessment of CD4dimCD8+ T cells in HLH/MAS syndrome and support the rationale for novel therapeutic strategies targeting activated CD8+ T cells.
Acknowledgments
The authors thank Cristina de Min for critical review of the manuscript and Ezio Giorda and Marco Scarsella for flow cytometry technical assistance.
This study was supported by Ricerca Corrente funding from the Italian Ministry of Health to F.D.B. and G.P. P.M. received a research grant from Associazione Italiana Linfoistiocitosi Emofagocitica.
Authorship
Contribution: A.D.M., M.C., F.D.B., and G.P. conceived and designed the study; M.C., M.N.R., I.C., N.T., V.B., and G.P. acquired the data; A.D.M., M.C., and G.P. analyzed and interpreted the data; A.D.M., C.B., P.M., and M.P. enrolled patients and collected clinical data; A.D.M., M.C., F.L., F.D.B., and G.P. wrote, reviewed, and/or revised the manuscript; and F.D.B. and G.P. supervised the study.
Conflict-of-interest disclosure: P.M. reports personal fees from Sobi and Jazz, outside the submitted work. C.B. is a consultant for Sobi and a speaker for Sobi and Novartis. F.L. reports personal fees from Amgen, personal fees from Novartis, Miltenyi, Medac, Jazz Pharmaceutical, and Takeda and from Bellicum Pharmaceutical and Neovi, outside the submitted work. F.D.B. reports grants from Abbvie, Novimmune, Sobi, Novartis, Roche, and Sanofi, outside the submitted work. The remaining authors declare no competing financial interests.
Correspondence: Fabrizio De Benedetti, Ospedale Pediatrico Bambino Gesù, Piazza S. Onofrio 4, 00165 Roma, Italy; e-mail: fabrizio.debenedetti@opbg.net.
Requests for data sharing may be submitted to Fabrizio De Benedetti (fabrizio.debenedetti@opbg.net).
The online version of this article contains a data supplement.
There is a Blood Commentary on this article in this issue.
The publication costs of this article were defrayed in part by page charge payment. Therefore, and solely to indicate this fact, this article is hereby marked “advertisement” in accordance with 18 USC section 1734.

This feature is available to Subscribers Only
Sign In or Create an Account Close Modal