Key Points
Azithromycin after allogeneic hematopoietic stem cell transplantation increases relapse of malignancies in a randomized-placebo trial.
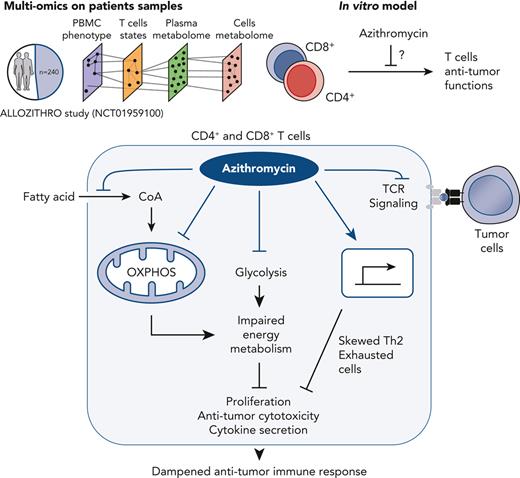
Azithromycin dampens antitumor immune response by disrupting T-cell functions through inhibition of energy metabolism in immune cells.
Abstract
Administration of azithromycin after allogeneic hematopoietic stem cell transplantation for hematologic malignancies has been associated with relapse in a randomized phase 3 controlled clinical trial. Studying 240 samples from patients randomized in this trial is a unique opportunity to better understand the mechanisms underlying relapse, the first cause of mortality after transplantation. We used multi-omics on patients’ samples to decipher immune alterations associated with azithromycin intake and post-transplantation relapsed malignancies. Azithromycin was associated with a network of altered energy metabolism pathways and immune subsets, including T cells biased toward immunomodulatory and exhausted profiles. In vitro, azithromycin exposure inhibited T-cell cytotoxicity against tumor cells and impaired T-cell metabolism through glycolysis inhibition, down-regulation of mitochondrial genes, and up-regulation of immunomodulatory genes, notably SOCS1. These results highlight that azithromycin directly affects immune cells that favor relapse, which raises caution about long-term use of azithromycin treatment in patients at high risk of malignancies. The ALLOZITHRO trial was registered at www.clinicaltrials.gov as #NCT01959100.
Introduction
Allogeneic hematopoietic stem cell transplantation (allo-HSCT) is a curative treatment for hematologic malignancies. Significant efforts aim to improve the survival and quality of life of patients suffering from acute or chronic graft-versus-host-disease (GVHD).1-4 Lung chronic GVHD, including bronchiolitis obliterans syndrome (BOS), affects about 10% of patients and is associated with poor outcomes.5-7 Azithromycin was shown to prevent BOS following lung transplantation.8 These observations led us to investigate if azithromycin could prevent BOS in a multicenter, randomized, placebo-controlled, double-blind, phase 3 study (Efficacy of Azithromycin to Prevent Bronchiolitis Obliterans Syndrome After Allogeneic Hematopoietic Stem Cell Transplantation [ALLOZITHRO] trial). Unexpectedly, azithromycin did not efficiently prevent BOS and was associated with higher mortality due to an increased risk of relapse (hazard ratio [HR], 1.7; P = .002). This led to an early interruption of the study9 and both Food and Drug Administration and European Medicines Agency warnings about azithromycin use after allo-HSCT.10 In a multicenter retrospective setting, azithromycin treatment for BOS after HSCT was also associated with a higher risk of secondary neoplasms.11
Antitumoral effects of allo-HSCT rely on immune-mediated mechanisms by donor cells,12 and relapse is the first cause of death after allo-HSCT.13 Relapse involves immune escape mechanisms including down-regulation of class II major histocompatibility complex (MHC) and expression of coinhibitory molecules.14-16 T cells are indeed associated with higher expression of coinhibitory molecules, exhausted cells subsets, and defective effector functions.15,17 Likewise, in autologous chimeric antigen receptor (CAR) T-cell infusions, T-cell exhaustion is associated with a lower response rate.18
Analyzing biological samples of patients from the ALLOZITHRO trial is a unique opportunity to decipher immune alterations associated with azithromycin and relapse after allo-HSCT. We applied mass cytometry and nontargeted metabolomics to determine the impact of azithromycin on immune subsets and the metabolome of patients. This approach revealed that azithromycin treatment altered the frequency of many immune subsets together with alteration of their functional states. Considering that azithromycin could alter host or bacteria metabolism, we then examined the plasma and cellular metabolomes.19,20 Integration of biological variables associated with azithromycin intake and clinical data highlighted an immunometabolic network associated with tumor relapse after allo-HSCT. We next uncovered the inhibitory properties of azithromycin on major T-cell functions, including proliferation, cytokine production, and cytotoxicity against leukemic targets. Finally, we studied how azithromycin impairs T-cell metabolism during activation through glycolysis inhibition, down-regulation of mitochondrial and proinflammatory gene expression, and up-regulation of immune suppressive genes.
Methods
Study design
This study was conducted with samples from patients included in the ALLOZITHRO trial (NCT01959100)9 and approved by the local Ethics Committee and Institutional Review Board (CPP Ile de France IV, IRB no. 00003835, reference no. 2013-000499-14). Samples were retrieved from the CRYOSTEM Consortium21 (project no. CS-1801, validated by IRB Sud-Méditerranée 1, reference no. AC-2011-1420) and the Commission National Informatique et Liberté for data protection (reference no. nz70243374i n°912120). All patients gave their written consent for clinical research. This noninterventional research study was carried out in accordance with the Declaration of Helsinki. Data analyses were performed using databases without patient identifiers. Healthy donor peripheral mononuclear blood cells (PBMCs) were isolated from residual blood after apheresis provided by Etablissement Français du Sang (18/EFS/032).
Experimental procedures
Details on experimental assays are described in the supplemental Methods, available on the Blood website.
Results
Cohort description
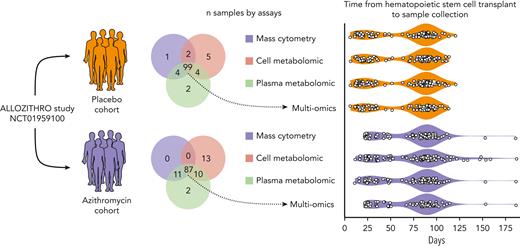
Samples from azithromycin (n = 123) and placebo (n = 117) patients were collected at median times of 85 and 84 days after allo-HSCT, respectively (Figure 1).21 Characteristics of patients’ subsets within omics cohorts were similar between the azithromycin and placebo groups (supplemental Table 1). There was no major disparity in comedication received by both groups, and azithromycin levels in metabolomics were not influenced by other drugs (supplemental Methods). Consistent with the findings of the ALLOZITHRO trial, a higher risk of relapse with azithromycin was observed in the patients studied herein (supplemental Figure 1).
Overview of the samples studied according to omics assays. Frozen peripheral mononuclear blood cells, plasma and cell pellets from patients included in the double-blinded ALLOZITHRO study were retrieved from the national CRYOSTEM biobank. All samples were collected after allogeneic hematopoietic stem cell transplantation, either at the time of acute graft vs host disease or at the nearest visit by day 100. Patients’ characteristics and outcomes are depicted in supplemental Table 1 and supplemental Figure 2.
Overview of the samples studied according to omics assays. Frozen peripheral mononuclear blood cells, plasma and cell pellets from patients included in the double-blinded ALLOZITHRO study were retrieved from the national CRYOSTEM biobank. All samples were collected after allogeneic hematopoietic stem cell transplantation, either at the time of acute graft vs host disease or at the nearest visit by day 100. Patients’ characteristics and outcomes are depicted in supplemental Table 1 and supplemental Figure 2.
Patients treated with azithromycin exhibit reduced circulating T cells and higher antiinflammatory subsets
We first ruled out that azithromycin could increase tumor cell proliferation or survival. Fourteen AML cell lines and primary leukemic cells from 8 patients were cultured with azithromycin. Regardless of azithromycin concentration, azithromycin was not associated with an effect on cell expansion (supplemental Figures 2 and 3).
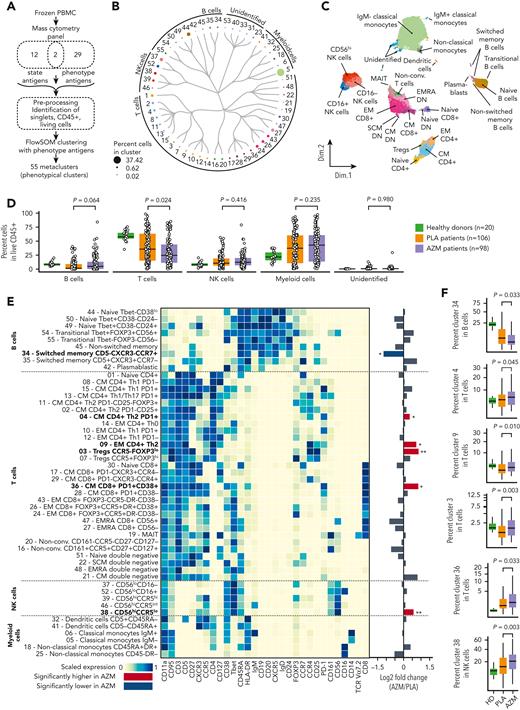
We then focused on circulating immune cells in patients’ samples. To identify main PBMC cell subsets, the FlowSOM algorithm22 was performed on CD45+ living cells with the use of 31 phenotypical markers (Figure 2A). Antigen expressions in the 55 phenotypical clusters were then manually checked to identify the corresponding cells subsets (Figure 2B-C, supplemental Figure 4, and supplemental Table 2). We found that patients included in the azithromycin arm were associated with a lower abundance of T cells (P = .024), whereas no difference was observed for B, natural killer (NK), or myeloid lineage (Figure 2D). Next, we compared the frequency of phenotypic clusters among these subsets. Azithromycin-treated patients were characterized by higher central memory (CM) and effector memory CD4+ T cells with a TH2 profile defined by CXCR3−CCR4+ (P = .045 and P = .010, respectively). A higher frequency of CCR5−FoxP3lo regulatory T cells (Tregs) also was found in azithromycin-treated patients (P = .003). Azithromycin treatment was associated with a higher frequency of activated CM CD8+ cells characterized by high HLA-DR, CD38, and PD-1 expression, suggesting an exhausted phenotype (P = .033). Finally, azithromycin intake was associated with lower switched memory CD5‒CXCR3−CCR7+ B cells (P = .033), with a higher abundance of immature CD56hiCCR5lo NK cells (P = .003) and a lower frequency of cluster 40 among unidentified cells (P = .016) (Figure 2E-F, supplemental Figures 5 and 6).
Azithromycin intake is associated with immune cell subset changes. (A) Frozen peripheral mononuclear blood cells (PBMCs) from patients included in placebo (PLA; n = 106) or azithromycin (AZM; n = 98) arm and from healthy donors (n = 20) were thawed and analyzed by means of mass cytometry with a panel targeting 43 antigens used to cluster cells according to their phenotype and T-cell functional state (naïve, activated, or exhausted). A preprocessing pipeline was used to normalize data across batches and then identify singlet CD45+ living cells. Fifty-five cell-phenotypic subsets were identified with the use of 31 phenotype antigens and FlowSOM algorithm. (B) Circular dendrogram showing the 55 cell-subset hierarchy colored according to the corresponding subsets and sized by frequency among CD45+ cells. (C) Uniform manifold approximation and projection, depicting cell clustering colored according to their subsets. (D) Boxplots representing percentage of main PBMC subsets among living CD45+ cells according to sample groups. (E) Heatmap representing scaled expression of phenotype antigen across the cell subsets manually ordered and annotated for visualization purposes. Targeted antigens are ordered by hierarchic clustering, and unidentified cell subsets are shown in supplemental Figure 4. Fold changes of immune subsets in AZM group compared with PLA are summarized with a bar plot (∗P < .05; ∗∗P < .01; P values are shown in F). Bold names of subsets indicate significant difference. (F) Boxplots of statistically different subsets between AZM and PLA cohorts. For visualization purposes, square root transformation was applied on the y-axis. All P values were calculated by means of 2-sided Wilcoxon signed rank test. DN, double negative; EM, effector memory; EMRA, effector memory CD45RA+; Non-conv, nonconventional; MAIT, mucosal-associated invariant T cells; NK, natural killer.
Azithromycin intake is associated with immune cell subset changes. (A) Frozen peripheral mononuclear blood cells (PBMCs) from patients included in placebo (PLA; n = 106) or azithromycin (AZM; n = 98) arm and from healthy donors (n = 20) were thawed and analyzed by means of mass cytometry with a panel targeting 43 antigens used to cluster cells according to their phenotype and T-cell functional state (naïve, activated, or exhausted). A preprocessing pipeline was used to normalize data across batches and then identify singlet CD45+ living cells. Fifty-five cell-phenotypic subsets were identified with the use of 31 phenotype antigens and FlowSOM algorithm. (B) Circular dendrogram showing the 55 cell-subset hierarchy colored according to the corresponding subsets and sized by frequency among CD45+ cells. (C) Uniform manifold approximation and projection, depicting cell clustering colored according to their subsets. (D) Boxplots representing percentage of main PBMC subsets among living CD45+ cells according to sample groups. (E) Heatmap representing scaled expression of phenotype antigen across the cell subsets manually ordered and annotated for visualization purposes. Targeted antigens are ordered by hierarchic clustering, and unidentified cell subsets are shown in supplemental Figure 4. Fold changes of immune subsets in AZM group compared with PLA are summarized with a bar plot (∗P < .05; ∗∗P < .01; P values are shown in F). Bold names of subsets indicate significant difference. (F) Boxplots of statistically different subsets between AZM and PLA cohorts. For visualization purposes, square root transformation was applied on the y-axis. All P values were calculated by means of 2-sided Wilcoxon signed rank test. DN, double negative; EM, effector memory; EMRA, effector memory CD45RA+; Non-conv, nonconventional; MAIT, mucosal-associated invariant T cells; NK, natural killer.
Azithromycin intake is associated with exhausted T-cell phenotypes
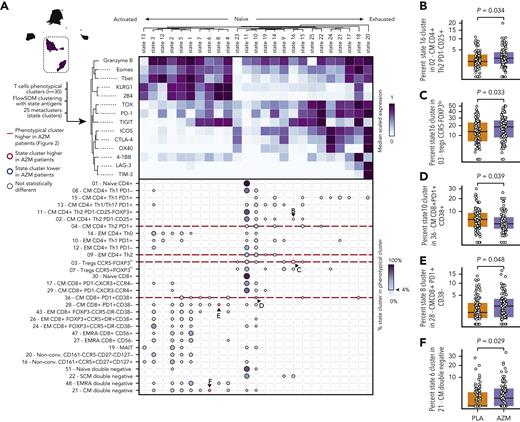
We then studied T-cell functional profiles with 14 additional functional markers by means of the FlowSOM algorithm. We identified 25 clusters representing activation or functional states of cells (Figure 3A). Three main profiles emerged: (1) activated cells characterized by the expression of granzyme B, Eomes, or T-bet; (2) naïve cells characterized by low levels of expression of most functional markers; and (3) exhausted cells characterized by higher levels of TOX, PD-1, ICOS, CTLA-4, 4-1BB, LAG-3, and TIM-3 (Figure 3A).
T-cell exhausted profiles are observed in patients treated with azithromycin (AZM). (A) Heatmap representing scaled expression of 14 functional antigens used to identify 25 functional state clusters with the use of FlowSOM algorithm among 30 T-cell phenotypic subsets. Below, dot plot showing percentage of functional state clusters in each T-cell subset. Only functional state clusters with >4% of the corresponding cell subsets are drawn. Letters indicate a significant difference between AZM and placebo (PLA) groups and the corresponding panel. (B-F) Boxplots of statistically different state subsets between AZM and PLA cohorts. For visualization purposes, square root transformation was applied on the y-axis. All P values were calculated by means of 2-sided Wilcoxon signed rank test.
T-cell exhausted profiles are observed in patients treated with azithromycin (AZM). (A) Heatmap representing scaled expression of 14 functional antigens used to identify 25 functional state clusters with the use of FlowSOM algorithm among 30 T-cell phenotypic subsets. Below, dot plot showing percentage of functional state clusters in each T-cell subset. Only functional state clusters with >4% of the corresponding cell subsets are drawn. Letters indicate a significant difference between AZM and placebo (PLA) groups and the corresponding panel. (B-F) Boxplots of statistically different state subsets between AZM and PLA cohorts. For visualization purposes, square root transformation was applied on the y-axis. All P values were calculated by means of 2-sided Wilcoxon signed rank test.
We next compared abundances of functional clusters among phenotypic clusters in azithromycin and placebo patients. We identified 4 T-cell subsets significantly increased in azithromycin patients: TIGIT+ (functional state 16) in regulatory T-cell CCR5−FOXP3lo (cluster 3) (P = .033) and in CM TH2 CD4+PD1−CD25+ (cluster 2) (P = .034), KLRG1+2B4+TIGIT+ (functional state 8) in CM CD8+PD1+CD38− (cluster 28) (P = .048), and TIGIT+KLRG1+2B4loPD-1loTOXloEomes+ (functional state 6) in CM double-negative subset (cluster 21) (P = .029). Activated cytotoxic granzymeB+PD-1lo (functional state 10) in CM CD8+PD-1+CD38+ cell (cluster 36) was found to be decreased in azithromycin patients (P = .039) (Figure 3A-B).
Together these results highlight that patients treated with azithromycin were characterized by lower T-cell abundance and were biased toward immunomodulatory TH2 response, with increased FoxP3+ regulatory T cells and exhausted phenotypes characterized by the expression of TOX, PD-1, and TIGIT.
Azithromycin is associated with variations in cell energy metabolism metabolites
We then explored if azithromycin intake could affect the plasma metabolome, considering that azithromycin could alter host- or microbiota-related metabolism.19,23 We studied metabolites from frozen plasma and dried white blood cell pellets to uncover both circulating and intracellular metabolomic profiles. Totals of 853 and 352 metabolites were studied in plasma and dried cell pellets, respectively (supplemental Figure 7).
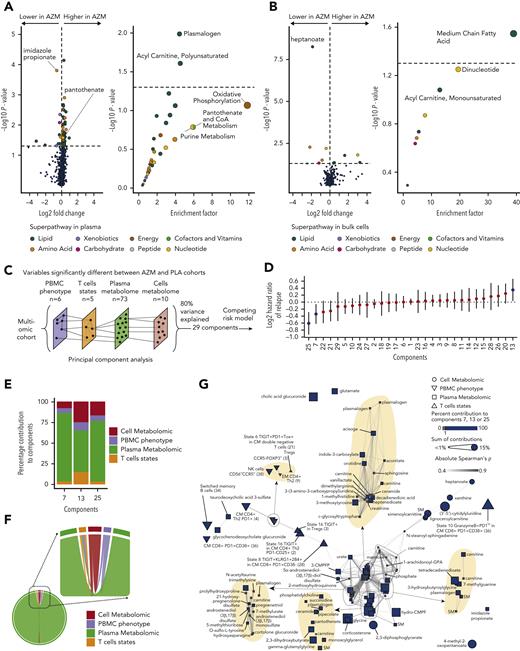
In plasma, 73 metabolites were significantly different between patients who received azithromycin and those from the placebo group. The most statistically significant changes were observed for (1) imidazole propionate, a microbial histidine-derived metabolite and precursor of glutamate,24 lowered in the azithromycin group; and (2) plasmalogen metabolites, with higher levels in the azithromycin group compared with placebo (Figure 4A and supplemental Table 3). Imidazole propionate is a key regulator of glucose metabolism and an activator of the mammalian target of rapamycin (mTOR) pathway.24 Enrichment analysis of the significant metabolites revealed an overrepresentation of plasmalogen and acyl-carnitine (polyunsaturated) pathways. Oxidative phosphorylation (OXPHOS), pantothenate, and purine metabolism pathways were the most enriched but not statistically significant (Figure 4A and supplemental Table 4).
Azithromycin (AZM) treatment and relapse are associated with changes in cell energy metabolism pathways. (A-B) Metabolomic analyses in (A) plasma and (B) dried cell pellet samples. Volcano plots and dot plots illustrate metabolite individual changes and pathway enrichment in patients treated with AZM compared with placebo (PLA). Volcano plot P values were calculated by means of 2-sided Wilcoxon signed rank test; enrichment P values were computed by means of hypergeometric test. (C) Omics integration method overview. Ninety-eight and 87 patients with mass cytometry, plasma and cell metabolomics samples in PLA and AZM cohorts were studied, respectively. Variables identified as statistically different between the 2 groups were used to reduce dimensionality with principal component analysis (PCA). Number of components to study was defined by a threshold of 80% cumulative percentage of variance explained. Patient coordinates in a 29-dimensional space were extracted from PCA results. (D) Forest plot representing the hazard ratio of relapse with the corresponding 95% confidence interval of a multivariate Fine-Gray model including each component and treatment group as covariates with death as the competing event. Blue dots indicate principal components statistically associated with relapse. (E) Stacked bar plot depicting percentage of contribution of variables from each omics layers in the 3 components associated with relapse. Top contributing individual variables are shown in Extended Data Figure 1. (F) Chord diagram showing statistically significant inter-omic correlations. (G) Correlation networks of variables included in the multi-omics analyses. Node coordinates were calculated by means of a multidimensional scaling algorithm, and edges are drawn between correlated variables. Variables (nodes) that significantly contributed to relapse are illustrated by the blue color, and size is correlated with the corresponding sum of contribution in significant dimensions. Areas where nodes overlaid are zoomed and highlighted in yellow for visualization purposes. P value and correlation and coefficients were computed according to Spearman rank correlation. Correlations were considered statistically significant if adjusted P values with false discovery rate were <.05 and Spearman’s absolute rho value >0.3. PBMC, peripheral mononuclear blood cell.
Azithromycin (AZM) treatment and relapse are associated with changes in cell energy metabolism pathways. (A-B) Metabolomic analyses in (A) plasma and (B) dried cell pellet samples. Volcano plots and dot plots illustrate metabolite individual changes and pathway enrichment in patients treated with AZM compared with placebo (PLA). Volcano plot P values were calculated by means of 2-sided Wilcoxon signed rank test; enrichment P values were computed by means of hypergeometric test. (C) Omics integration method overview. Ninety-eight and 87 patients with mass cytometry, plasma and cell metabolomics samples in PLA and AZM cohorts were studied, respectively. Variables identified as statistically different between the 2 groups were used to reduce dimensionality with principal component analysis (PCA). Number of components to study was defined by a threshold of 80% cumulative percentage of variance explained. Patient coordinates in a 29-dimensional space were extracted from PCA results. (D) Forest plot representing the hazard ratio of relapse with the corresponding 95% confidence interval of a multivariate Fine-Gray model including each component and treatment group as covariates with death as the competing event. Blue dots indicate principal components statistically associated with relapse. (E) Stacked bar plot depicting percentage of contribution of variables from each omics layers in the 3 components associated with relapse. Top contributing individual variables are shown in Extended Data Figure 1. (F) Chord diagram showing statistically significant inter-omic correlations. (G) Correlation networks of variables included in the multi-omics analyses. Node coordinates were calculated by means of a multidimensional scaling algorithm, and edges are drawn between correlated variables. Variables (nodes) that significantly contributed to relapse are illustrated by the blue color, and size is correlated with the corresponding sum of contribution in significant dimensions. Areas where nodes overlaid are zoomed and highlighted in yellow for visualization purposes. P value and correlation and coefficients were computed according to Spearman rank correlation. Correlations were considered statistically significant if adjusted P values with false discovery rate were <.05 and Spearman’s absolute rho value >0.3. PBMC, peripheral mononuclear blood cell.
We then explored the intracellular metabolome and identified 10 significantly different metabolites between the 2 groups (Figure 4B and supplemental Table 5). Heptanoate was the most significantly lowered metabolite in the azithromycin group. This metabolite is a medium-chain fatty acid (MC-FA) involved in the tricarboxylic acid cycle (TCA) by acetyl–coenzyme A (CoA) and succinyl-CoA biosynthesis through mitochondrial beta-oxidation of long-chain fatty acid.25 The MC-FA pathway was significantly enriched (Figure 4B and supplemental Table 6).
Altogether these results underline changes in pathways converging to acetyl-CoA synthesis from mitochondrial beta-oxidation through enrichment in acyl-carnitine and MC-FA pathways for its use in OXPHOS. CoA was recently found to enhance CD8+ Tc22 antitumoral functions.26 Here, the precursor of CoA, pantothenate, was increased in the azithromycin group. This may be related to the metabolite accumulation owing to lower incorporation in CoA as reported when inhibiting pantothenate kinase (PANK).27 Supporting this hypothesis, acyl-carnitine metabolites were higher in azithromycin patients, as observed within PANK-inhibited hepatocytes (supplemental Table 3).27 In addition, the enrichment in plasmalogens suggests that immune-regulatory pathways are involved in the azithromycin effect, because higher levels of plasmalogens are associated with post-transplantation immune tolerance.28
Variables associated with azithromycin intake are also associated with relapse
To study the interactions between variables significantly associated with treatment groups and determine whether these variables were also associated with relapse, we studied patients with malignancies for which we had all biological data (multi-omics cohort) (Figure 1 and supplemental Table 1). In these patients, sample collection preceded relapse at a median time of 6.36 months (interquartile range, 1.92-12.03 months) in the azithromycin group and 16.58 months (5.14-25.05 months) in the placebo group, and azithromycin intake was associated with a higher cumulative incidence of relapse (HR, 1.81, 95% CI, 1.10-3.02; P = .02). We first determined if differences associated with azithromycin intake were more pronounced in patients who relapsed (supplemental Figure 8). Immune subsets and metabolites whose variations were associated with azithromycin intake were also analyzed individually for their association with relapse (supplemental Table 7).
Because these variables may be associated with relapse in a multivariate manner, we used principal component analysis to perform dimension reduction (Figure 4C and supplemental Figure 9A). Then, to measure the association of these components with relapse, we used a multivariate competing Fine and Gray risk model that included treatment groups as covariate. Three components (#7, #13, and #25) were significantly associated with relapse (Figure 4D and supplemental Table 8), and all omics layers contributed to these components (Figure 4E).
Variables that contributed to at least 1% of components were considered as significant contributors and thus associated with relapse (supplemental Figure 9B-D). Among the 94 variables that differed between azithromycin and placebo patients, 59 contributed significantly. Cell subsets were PD1+CM CD4+ TH2 (cluster 4), CD56hiCCR5lo NK cells (cluster 38), switched memory B cells (cluster 34), CM CD8+ T cells PD1+CD38+ (cluster 36), and TIGIT+ (state 16) in PD1−CM TH2 (cluster 2), KLRG1+2B4+TIGIT+ (state 8) in CM CD8+PD1+CD38− (cluster 28), and granzyme B+ and PD1lo (state 10) in CM CD8+ (cluster 36). Interestingly, one of the first contributors was white blood cell intracellular 2,3-diphosphoglycerate, a metabolite involved in glycolysis. Enriched plasmatic pathways included the following: (1) energy metabolism: fatty acid dicarboxylate, CoA metabolism; (2) immunomodulator mechanisms: pregnenolone steroids, primary bile acid, plasmalogen; and (3) purine and pyrimidine metabolism (supplemental Figure 10A). In cells, most enriched metabolomic pathways also encompassed energy metabolism: MC-FA and dinucleotides (supplemental Figure 10B).
To highlight inter-omics relationships, we next performed correlations analyses. The distribution of significant correlations across omics and variables correlations are depicted in Figure 4F-G. The correlation network identified different clusters of variables in which at least 1 variable contributed to relapse. State 8 (TIGIT+KLRG1+2B4+) in CM CD8+ PD1+CD38− (cluster 28) were correlated with 3-carboxy-4-methyl-5-propyl-2-furanpropionic acid, a uremic toxin known to inhibit mitochondrial respiration (Figure 4G).
Altogether, these results illustrate that among variables associated with azithromycin intake, TH2 and exhausted T cells and energy metabolism pathways, notably glycolysis-derived metabolites, contributed specifically to relapse.
Azithromycin intake is associated with transcriptional changes in energy metabolism, cell cycle, and inflammation pathways
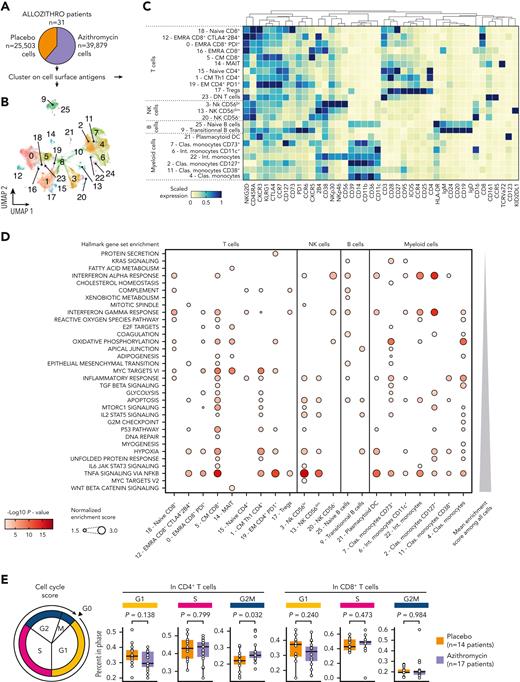
We then performed single-cell RNA sequencing coupled with cellular indexing of epitopes (CITE-seq) on 31 patients’ samples (Figure 5A and supplemental Table 9). Clustering 65,382 cells with the use of cell surface antigen expression allowed the identification of 23 immune subsets (Figure 5B-C).
Azithromycin treatment is associated with enrichment of energy metabolism, cell cycle, and immune response pathways. (A) Frozen peripheral mononuclear blood cells (PBMCs) from patients (placebo, n = 14; and azithromycin, n = 17) were thawed and analyzed by means of cellular indexing of transcriptomes and epitopes by sequencing (CITE-Seq). Cells were clustered according to cell surface antigen expression. (B) Uniform manifold approximation and projection (UMAP) describing cell clustering. (C) Heatmap depicting scaled cell surface antigen expression in cell subsets. (D) Dot plot depicting enrichment analysis within each subset of cells with the use of hallmark gene sets. Only immune cells with at least 1 enriched pathway are depicted. P values were computed with adaptive multilevel split Monte-Carlo and adjusted with false discovery rate. (E) Cell cycle analysis from CITE-Seq with cell cycle score. P values were computed by means of 2-sided matched-pair Wilcoxon rank test. Clas., classical; DN, double negative; EM, effector memory; EMRA, effector memory CD45RA+; Int., intermediate; MAIT, mucosal associated invariant T cells; NK, natural killer.
Azithromycin treatment is associated with enrichment of energy metabolism, cell cycle, and immune response pathways. (A) Frozen peripheral mononuclear blood cells (PBMCs) from patients (placebo, n = 14; and azithromycin, n = 17) were thawed and analyzed by means of cellular indexing of transcriptomes and epitopes by sequencing (CITE-Seq). Cells were clustered according to cell surface antigen expression. (B) Uniform manifold approximation and projection (UMAP) describing cell clustering. (C) Heatmap depicting scaled cell surface antigen expression in cell subsets. (D) Dot plot depicting enrichment analysis within each subset of cells with the use of hallmark gene sets. Only immune cells with at least 1 enriched pathway are depicted. P values were computed with adaptive multilevel split Monte-Carlo and adjusted with false discovery rate. (E) Cell cycle analysis from CITE-Seq with cell cycle score. P values were computed by means of 2-sided matched-pair Wilcoxon rank test. Clas., classical; DN, double negative; EM, effector memory; EMRA, effector memory CD45RA+; Int., intermediate; MAIT, mucosal associated invariant T cells; NK, natural killer.
Gene set enrichment score was calculated in each subset after differential gene expression analyses. Consistent with our metabolomic results, metabolism pathways were enriched in immune cells, including OXPHOS, glycolysis, cholesterol, and fatty acid metabolism. Immune functions were also influenced by azithromycin exposure, including interferon (IFN) ⍺ and IFN-γ responses, complement pathway, inflammatory response, and cytokine signaling pathways. Signaling pathways involved in immune response, such as mTORC1, STAT3, STAT5, and NFκB signaling pathways were enriched. Finally, cell cycle–related pathways (E2F, mitotic spindle, G2M checkpoint, MYC) were enriched in various cell subsets (Figure 5D). Because T-cell frequency was lowered in azithromycin patients, we calculated cell cycle score in the main subsets of T cells. We found higher frequencies of CD4+ T cells in G2M phases (P = .032) (Figure 5E).
Azithromycin exposure does not affect class II MHC expression by antigen presenting cell or tumor cell
Down-regulation of class II HLA has been previously involved in post-transplantation relapses.14 Azithromycin was not associated with down-regulation of HLA-DR expression on antigen-presenting cells (APCs) from ALLOZITHRO trial samples. Transcriptomic assays did not reveal a down-regulation of class II gene expression. In vitro, APCs exposed to azithromycin did not lower HLA-DR DQ DP protein expression. Primary leukemic cells exposed to azithromycin were not associated with lower expression of HLA-DR DQ DP proteins (supplemental Figure 11).
Azithromycin modulates T-cell functions by inhibiting glycolysis during activation
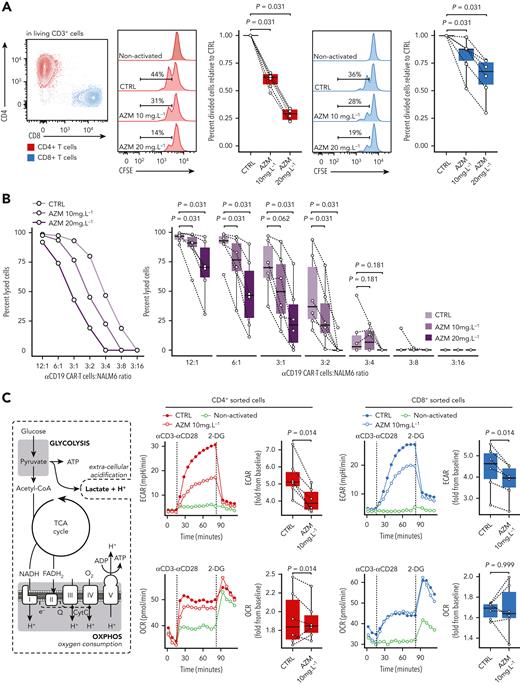
To evaluate if azithromycin may have a direct impact on PBMCs and because azithromycin was associated with a lower abundance of T cells and higher frequency of G2M CD4+ T cells, we studied the effects of azithromycin on T-cell proliferative functions in vitro. CD3+-sorted cells from HD were incubated for 24 hours with azithromycin at 10 mg/L and 20 mg/L before activation with anti-CD3/CD28 beads to mimic the azithromycin intake before allo-HSCT. After 48 hours of culture, we observed a dose-dependent inhibition of CD4+ and CD8+ T-cell proliferation (Figure 6A). Cell viability was not affected by azithromycin (supplemental Figure 12A-B). The effect of azithromycin on proliferation was reversible after a washout of 24 hours before activation (supplemental Figure 13). This result confirms a specific effect of azithromycin on T cells and is not in favor of a nonspecific toxic effect.
Azithromycin (AZM) inhibits T-cell proliferative and cytotoxic functions by impeding energetic boost from glycolysis. (A) Sorted CD3+ cells from healthy-donor (HD) peripheral mononuclear blood cells were stained with carboxyfluorescein succinimidyl ester (CFSE) and treated in vitro with AZM or control (CTRL) for 24 hours before activation with anti-CD3/CD28 beads. Two days after activation, cells were retrieved from the incubator and analyzed by means of flow cytometry. CFSE staining in CD4+ and CD8+ T-cell subsets are shown in histograms (representative results) and boxplots (each dot is the median value of 3 technical replicates). Results are from 3 independent experiments with 6 independent HDs. (B) Anti-CD19 chimeric antigenic receptor (CAR) T cells were cultured with AZM or CTRL for 24 hours and co-cultured with luciferase expressing CD19+ NALM6 cell lines overnight. Cell lysis was quantified by means of luminescence. A representative result is shown as a dot plot, and pooled 6 independent experiments are depicted in boxplots. (C) Cell energy metabolism overview and corresponding glycolysis and oxidative phosphorylation (OXPHOS) assays from HD sorted CD4+ and CD8+ cells after 24 hours of incubation with AZM or dimethylsulfoxide (CTRL). Extracellular acidification rate (ECAR) and oxygen consumption rate (OCR) were measured at time of activation with anti-CD3/CD28 antibody complexes and then glycolysis was inhibited by 2-deoxyglucose (2-DG). Dot plots show representative results and boxplots pooled results from 6 independent experiments. All P values were computed by means of 2-sided matched-pair Wilcoxon rank test.
Azithromycin (AZM) inhibits T-cell proliferative and cytotoxic functions by impeding energetic boost from glycolysis. (A) Sorted CD3+ cells from healthy-donor (HD) peripheral mononuclear blood cells were stained with carboxyfluorescein succinimidyl ester (CFSE) and treated in vitro with AZM or control (CTRL) for 24 hours before activation with anti-CD3/CD28 beads. Two days after activation, cells were retrieved from the incubator and analyzed by means of flow cytometry. CFSE staining in CD4+ and CD8+ T-cell subsets are shown in histograms (representative results) and boxplots (each dot is the median value of 3 technical replicates). Results are from 3 independent experiments with 6 independent HDs. (B) Anti-CD19 chimeric antigenic receptor (CAR) T cells were cultured with AZM or CTRL for 24 hours and co-cultured with luciferase expressing CD19+ NALM6 cell lines overnight. Cell lysis was quantified by means of luminescence. A representative result is shown as a dot plot, and pooled 6 independent experiments are depicted in boxplots. (C) Cell energy metabolism overview and corresponding glycolysis and oxidative phosphorylation (OXPHOS) assays from HD sorted CD4+ and CD8+ cells after 24 hours of incubation with AZM or dimethylsulfoxide (CTRL). Extracellular acidification rate (ECAR) and oxygen consumption rate (OCR) were measured at time of activation with anti-CD3/CD28 antibody complexes and then glycolysis was inhibited by 2-deoxyglucose (2-DG). Dot plots show representative results and boxplots pooled results from 6 independent experiments. All P values were computed by means of 2-sided matched-pair Wilcoxon rank test.
We then treated the cells with cyclosporine A to mimic the effect of GVHD prophylaxis. This revealed that effects of azithromycin and cyclosporine A were additive in CD8+ T cells and that azithromycin at 10 mg/L had an inhibitory effect similar to that of cyclosporine at a usual dose of 150 ng/mL (supplemental Figure 14).
Next, to assess if azithromycin might also affect cytokine production functions, we studied cytokine levels on T-cell supernate by means of multiplex immunoassays. After 2 days of activation, all evaluated cytokines except interleukin (IL) 4 and IL-13 were dose-dependently reduced in supernatants from azithromycin-treated cells. After 5 days of activation, IL-13 levels were increased with azithromycin exposure (supplemental Figures 15-17). These results revealed that azithromycin inhibited the secretion of proinflammatory and antitumoral cytokines such as IL-2, IL-15, IL17, IFN-γ, IFN-⍺, and tumor necrosis factor–related apoptosis-inducing ligand (TRAIL). Consistent with a higher abundance of TH2 subsets in patients from the clinical trial, azithromycin promoted the TH2 pathway in vitro, as illustrated by a higher IL-13 level.
To unravel whether azithromycin could inhibit antitumoral T-cell cytotoxic functions, anti-CD19 CAR T cells were cultured for 24 hours with azithromycin and then incubated with CD19+ NALM6 lymphoblastic leukemia cell line. The percentage of specific lysis was dose dependent and reduced by azithromycin (Figure 6B). Treatment did not affect CAR T-cell viability (supplemental Figure 12C).
Metabolomic analyses revealed enrichment in energy metabolism pathways in azithromycin-treated patients and in relapsed patients. We therefore hypothesized that azithromycin exposure could impair energy metabolism in T cells during the immune response. Because glycolysis plays a central role in ATP synthesis during T-cell activation,29 we studied energy metabolism after anti-CD3/CD28 activation in T cells from healthy donors (HDs). To characterize the impact of azithromycin on the CD3+ subtypes, CD4+ and CD8+ T cells were sorted and incubated for 24 hours in 10 mg/L azithromycin. Glycolytic activity as measured by extracellular acidification rate after T-cell activation was reduced in CD4+ and CD8+ cells treated with azithromycin (Figure 6C). Mitochondrial oxidative phosphorylation measured by oxygen consumption rate (OCR) was not different between the 2 groups (Figure 6C). Our results argue that azithromycin dampens immune cell functions by inhibiting glycolysis during activation, while not affecting OXPHOS metabolism. This mechanism could impair normal T-cell activation and differentiation during immune response after allo-HSCT.
Azithromycin inhibits T-cell receptor signaling pathways after activation
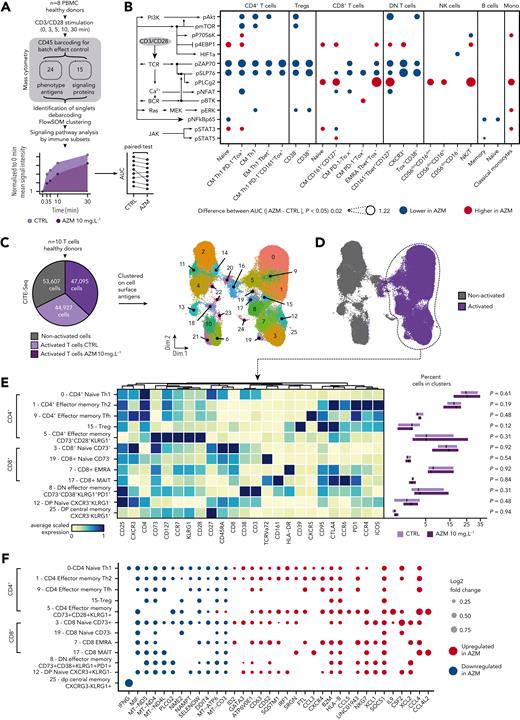
With the use of mass cytometry, we studied signaling pathways to evaluate if their inhibition may drive the dampening of glycolysis and effector functions. At 5 time points after anti-CD3/CD28 activation, we measured 14 signaling proteins among 23 PBMC subsets from 8 HDs (Figure 7A and supplemental Figures 18-19). Analysis disclosed an inhibition of T-cell receptor (TCR) signaling in CD4+ Tregs and double-negative subsets and in CM and EMRA CD8+ subsets. Additional inhibition of pAkt, pmTOR, and pERK also was found in CD4+ subsets (Figure 7B and supplemental Figure 20).
Azithromycin (AZM) inhibits T-cell receptor (TCR) signaling in T cells, promotes immunomodulatory pathways, and impedes mitochondrial mRNA synthesis. (A) Thawed peripheral mononuclear blood cells (PBMCs) from 8 healthy donors (HDs) were treated with AZM or control (CTRL) for 24 hours before CD3/CD28 activation. Activation was stopped at 0, 3, 5, 10, and 30 minutes. To prevent batch effect on sample labeling, samples from each donor were barcoded with a mix of anti-CD45 antibodies and then pooled before mass cytometry staining procedure. Single cells were then clustered by means of FlowSOM algorithm according to phenotype antiges expression. Area under the receiver operating characteristic curve (AUC) of signaling mean signal intensity was computed. Cluster phenotypes are presented in supplemental Figure 18. (B) Dot plot depicting statistically significant difference in AUC between CTRL and AZM conditions. Individual differences at the 5 time points are presented in supplemental Figure 20. P values were computed by means of matched-paired Wilcoxon Rank Sum test. pSTAT6 is not depicted, because it was not statistically different. (C) CD3+-sorted cells from 10 HDs were treated with AZM or CTRL for 24 hours before CD3/CD28 activation. Analysis was performed 2 days after cells activation. The pie chart illustrates the number of living cells retrieved at the end of the single-cell RNA sequencing with the use of cell surface antigen embedding pipeline. Next, using cell surface antigen expression, 26 phenotypic cell clusters were identified as illustrated with the uniform manifold approximation and projection (UMAP). (D) UMAP highlighting retrieved cells from activated conditions. (E) Heatmap representing manually ordered and annotated cell clusters with the corresponding scaled surface antigen expression. Abundances of clusters in cells treated with AZM or CTRL are depicted on boxplots. For visualization purposes, square root transformation was applied on the x-axis. P values were computed by means of matched-paired Wilcoxon rank sum test. (F) Dot plot showing differentially expressed genes in each T-cell clusters from volcano plots is shown in supplemental Figure 21. Only statistically significant changes are depicted. P values were computed by means of Wilcoxon rank sum test and adjusted with false discovery rate.
Azithromycin (AZM) inhibits T-cell receptor (TCR) signaling in T cells, promotes immunomodulatory pathways, and impedes mitochondrial mRNA synthesis. (A) Thawed peripheral mononuclear blood cells (PBMCs) from 8 healthy donors (HDs) were treated with AZM or control (CTRL) for 24 hours before CD3/CD28 activation. Activation was stopped at 0, 3, 5, 10, and 30 minutes. To prevent batch effect on sample labeling, samples from each donor were barcoded with a mix of anti-CD45 antibodies and then pooled before mass cytometry staining procedure. Single cells were then clustered by means of FlowSOM algorithm according to phenotype antiges expression. Area under the receiver operating characteristic curve (AUC) of signaling mean signal intensity was computed. Cluster phenotypes are presented in supplemental Figure 18. (B) Dot plot depicting statistically significant difference in AUC between CTRL and AZM conditions. Individual differences at the 5 time points are presented in supplemental Figure 20. P values were computed by means of matched-paired Wilcoxon Rank Sum test. pSTAT6 is not depicted, because it was not statistically different. (C) CD3+-sorted cells from 10 HDs were treated with AZM or CTRL for 24 hours before CD3/CD28 activation. Analysis was performed 2 days after cells activation. The pie chart illustrates the number of living cells retrieved at the end of the single-cell RNA sequencing with the use of cell surface antigen embedding pipeline. Next, using cell surface antigen expression, 26 phenotypic cell clusters were identified as illustrated with the uniform manifold approximation and projection (UMAP). (D) UMAP highlighting retrieved cells from activated conditions. (E) Heatmap representing manually ordered and annotated cell clusters with the corresponding scaled surface antigen expression. Abundances of clusters in cells treated with AZM or CTRL are depicted on boxplots. For visualization purposes, square root transformation was applied on the x-axis. P values were computed by means of matched-paired Wilcoxon rank sum test. (F) Dot plot showing differentially expressed genes in each T-cell clusters from volcano plots is shown in supplemental Figure 21. Only statistically significant changes are depicted. P values were computed by means of Wilcoxon rank sum test and adjusted with false discovery rate.
Azithromycin promotes immunomodulatory gene expression and disrupts mitochondrial mRNA synthesis
To explore whether azithromycin’s impact on T cells was associated with phenotypic and transcriptional changes in CD4+ and CD8+ T cells, we performed CITE-seq on T cells from HDs 48 hours after anti-CD3/CD28 activation. Cells were clustered according to cell surface antigen expression (Figure 7C-D). Cluster abundance did not differ between treated and untreated conditions (Figure 7E).
Transcriptomic analysis disclosed down-regulation of proinflammatory genes: (1) IFNG in CD4+, in double-positive CM (cluster 25) and TH1 (cluster 0) cells; and (2) MIF in mostly all clusters (Figure 7F and supplemental Figure 21). SOCS1 was up-regulated in most clusters (Figure 7F). Because SOCS1 was recently found to impair antitumor response in TH1 cells,30 we measured SOCS1 expression 6 days after activation by flow cytometry. We identified that SOCS1 expression was significantly higher in azithromycin-treated CD4+ (P = .020) but not in CD8+ (P = .074) T cells (supplemental Figure 22).
Down-regulation of genes implicated in ATP biosynthesis also was observed with azithromycin: (1) mitochondrial mRNA involved in the synthesis of mitochondrial complexes I (MT-ND4, MT-ND5), IV (MT-CO3), and V (MT-ATP6); and (2) NAMPT, involved in NAD synthesis, a required metabolite for mitochondrial complex I function (Figure 7D). Considering this impact of genes of the mitochondrial complex, we measured mitochondrial mass and function with the use of flow cytometry. Although we did not identify an impact of azithromycin on mitochondrial mass in CD4+ and CD8+ cells, lower mitochondrial respiratory chain function was identified with tetramethylrhodamine, methyl ester, perchlorate assays in CD4+ and CD8+ T cells (supplemental Figure 23). Likewise, in resting T cells, basal and maximum mitochondrial respiration assessed by OCR was reduced after 5 days of exposure to azithromycin in vitro (supplemental Figure 24).
Altogether, these results showed that azithromycin impairs lymphocyte effector functions through down-regulation of mitochondrial complex I, IV, and V genes and functions, and of genes with proinflammatory function while it up-regulates SOCS1 expression, a negative regulator of the immune response.
Discussion
Understanding mechanisms of relapse after allo-HSCT is mandatory to improve our comprehension of antitumor immune response and to develop new therapeutic approaches. We took advantage of samples from patients included in a randomized study to decipher how azithromycin promoted relapse in patients. To gain mechanistic insight, we performed in vitro experiments that highlighted that azithromycin promotes immunomodulatory mechanisms, notably through inhibiting main antitumoral T-cell functions.
We first identified immune changes associated with azithromycin intake in patients, including lower total T cells, a higher proportion of TH2-biased T cells, and an increased proportion of naïve FoxP3+ regulatory T cells. Functional states of immune cells revealed increased proportion of exhausted lymphocytes, notably expressing inhibitory receptors TIGIT and PD-1 with TOX,31 associated with azithromycin treatment. Exhaustion mechanisms had been previously reported to be associated with relapse.17,32,33 Interestingly, similarly to what has been reported in nonresponders to immune checkpoint inhibitors, we observed lower switched memory B cells characterized by lower CXCR3 expression being associated with azithromycin intake.34
To decipher azithromycin effects on antitumor response, we explored T-cell functions after azithromycin exposure in vitro. It highlighted how azithromycin inhibits the proliferation of both CD4+ and CD8+ T cells after activation without an impact on their survival. Azithromycin inhibited antitumor cytotoxicity functions of T cells and cytokine production, notably antitumor cytokines such as type 1 and 2 IFNs and TRAIL.35-37 In addition, a higher level of IL-13, which suppresses type I responses in tumor environment,38 was consistent with TH2-biased cells subsets after azithromycin exposure.
By integrating biological variables associated with azithromycin intake, we identified the PD1+ TH2 CD4+ cells, exhausted PD1+CD8+ T cells, and NK cells subsets as main contributors to subsequent relapse, as well as pathways involving energy metabolism and CoA biosynthesis. Imidazole propionate was lower in azithromycin patients. This histidine-derived metabolite activates mTOR-S6K pathway,27 and its absence in hepatocyte cultures is similar to the effect of rapamycin treatment, suggesting its importance in cell signaling.24 Coenzyme A has a central role in enhancing antitumor cytotoxicity by promoting oxidative phosphorylation in CD8+ T cells.26 In addition, 2,3-diphosphoglycerate involved in glycolysis was one of the first intracellular metabolite found to contribute to relapse. Metabolomics may be influenced by gut microbiota changes under azithromycin treatment or by changes in host metabolism that are not directly related to immune cells. Gene set enrichment from single-cell transcriptomic analyses on PBMCs from patients revealed that azithromycin was associated with enrichment in energy metabolism pathways, such as glycolysis, OXPHOS, and fatty acid–related pathways in immune cells. Direct effect on T-cell metabolism was next confirmed in vitro, in which azithromycin exposure inhibited glycolysis in both CD4+ and CD8+ subsets after activation. Glycolysis in T cells mobilizes ATP to gain effector functions after activation.29 Previous studies have demonstrated that glycolysis inhibition could induce T-cell exhaustion.39,40 In addition, metabolically unfit T cells were found to be associated with lower antitumor activity.41 Glycolysis is known to be regulated by the mTORC1-HIF1 pathway.42,43 We mainly found inhibition of TCR signaling pathway in T cells. mTOR signaling was inhibited in CD4+ subsets but not in CD8+. This may explain the higher inhibitory effect of azithromycin on CD4+ compared with that on CD8+ cells. This also suggests that glycolysis inhibition may not be ascribed uniquely to mTOR pathway but also to upstream TCR signaling.
Single-cell analysis of gene expression after azithromycin exposure revealed down-regulation of mitochondrial genes that was associated with impaired respiratory chain functions. Mitochondrial metabolism produces ATP through oxidative phosphorylation and metabolites involved in the TCA and fatty acid oxidation.40 Others have already reported that blocking mitochondrial protein translation leads to decreased cytotoxic and effector functions in T cells.44,45 Because azithromycin is known to inhibit the bacterial ribosomal 50S subunit, azithromycin may thus also alter transcription of proteins involved in antitumor response, such as IFN or TRAIL.23 We identified SOCS1 as the most significantly up-regulated gene, with higher protein expression after azithromycin exposure. SOCS1 was recently shown to abrogate TH1 responses, notably IFN-⍺ and IL-2 synthesis.30 In a mouse model, SOCS1 was shown to inhibit glycolysis through STAT3/HIF1a pathway.46 This mechanism may also explain glycolysis inhibition observed in T cells treated with azithromycin.
In conclusion, studying samples from patients included in the ALLOZITHRO trial allowed us to decipher how azithromycin promotes relapse. There is currently extensive literature suggesting that antibiotics affect alloreactivity, demonstrated by GVHD-related mortality through gut microbiota changes.47 Our results highlight that azithromycin directly affects immune cells and that these biological changes are associated with relapse after allo-HSCT. Knowing that GVHD incidence was not modified by azithromycin intake in the trial, the features identified in our study (and in others) include that TH248 and exhausted cells,17,32,33 or metabolically unfit T cells,41 may be more broadly associated with post-transplantation relapse mechanisms. Beyond the context of allo-HSCT, azithromycin is widely used in chronic respiratory diseases.23 Our results raise the question of the safety of using this treatment in patients at risk of cancer, such as patients with chronic obstructive pulmonary disease.49
Acknowledgments
The authors thank all members of the CRYOSTEM Consortium and the Francophone Society of Marrow Transplantations and Cellular Therapy for providing the patients’ samples used in this study. The authors also thank Marie-Hélène Schlageter, Alessandro Donada, and Leila Perié (INSERM UMR168) for providing access to multiplex immunoassays instruments; and Michaël Saitakis and Sebastian Amigorena (INSERM U932) for providing the CAR sequence. This work benefited from equipment and services from the IGenSeq core facility at Institut du Cerveau et de la Moelle.
This work was funded by the Association Leucémie Espoir, SOS Oxygène, La Laurène, EGMOS Association, and HTC Project. N.V. was supported by the Association Cancerologie du Centre and a research grant from ITMO Cancer of Aviesan on funds administered by INSERM (ASC20047HSA). S.L.G. was supported by La Fédération pour la Recherche Médicale and Association Capucine (M2R202106013386).
Authorship
Contribution: A. Bergeron and D.M. conceptualized the study; D.M. and N.V. conceived methodology, data visualization, and wrote the original draft of the manuscript; N.V. and S.L.G. analyzed data; N.V., S.L.G., and D.M. generated figures; N.V., S.L.G., L.B., A.C., B.H., D.B., L.D., A. Bohineust, M.T., D.G., E.M., R.I., K.P., B.I., and P.L. performed experiments and investigation; N.V., A.C., S.T., P.L., R.P.d.L., and D.M. provided resource; N.V., L.B., and S.C. ensured data curation; G.S., A. Bergeron, and D.M. wrote, critically reviewed and edited the final manuscript; A. Bergeron and D.M. were responsible for project administration; G.S., A. Bergeron, and D.M. acquired funding; and D.M. supervised the project.
Conflict-of-interest disclosure: G.S. and R.P.d.L. received a research grant from Alexion Pharmaceutical Company. R.P.d.L. received a research grant from Novartis and Pfizer companies. G.S. received fees from Pharmacyclics, Novartis, Incyte, Alexion, Amgen, and Pfizer. D.M received fees from Novartis, Incyte, Jazz Pharmaceuticals, and CSL Behring. The remaining authors declare no competing financial interests.
Correspondence: David Michonneau, Hematology and Transplantation Unit, Saint Louis Hospital, 1 ave Claude Vellefaux, 75010 Paris, France; e-mail: david.michonneau@aphp.fr.
References
Author notes
∗G.S., A. Bergeron, and D.M. contributed equally to this work.
Data and code sharing: Raw data are available in the following public repositories: (1) mass cytometry: FlowRepository FR-FCM-Z5ZB and FR-FCM-Z5L7; (2) metabolomic: Metabolights MTBLS406; (3) single-cell RNA sequencing: GEO GSE197658 and GSE208399. Analysis pipelines are available in a Git repository: https://gitlab.com/nivall/azimut-blood; https://gitlab.com/nivall/azimut-in-vitro; https://gitlab.com/nivall/azimutscrna.
The online version of this article contains a data supplement.
There is a Blood Commentary on this article in this issue.
The publication costs of this article were defrayed in part by page charge payment. Therefore, and solely to indicate this fact, this article is hereby marked “advertisement” in accordance with 18 USC section 1734.

This feature is available to Subscribers Only
Sign In or Create an Account Close Modal