

Key Points
Integrating single-cell omics with tracking and dynamics quantification to compare HSC daughter cells improves fate regulator detection.
Transcriptome divergence at HSC activation after asymmetric division includes differential cell cycle and adhesion regulation.

Abstract
Molecular programs initiating cell fate divergence (CFD) are difficult to identify. Current approaches usually compare cells long after CFD initiation, therefore missing molecular changes at its start. Ideally, single cells that differ in their CFD molecular program but are otherwise identical are compared early in CFD. This is possible in diverging sister cells, which were identical until their mother’s division and thus differ mainly in CFD properties. In asymmetrically dividing cells, divergent daughter fates are prospectively committed during division, and diverging sisters can thus be identified at the start of CFD. Using asymmetrically dividing blood stem cells, we developed a pipeline (ie, trackSeq) for imaging, tracking, isolating, and transcriptome sequencing of single cells. Their identities, kinship, and histories are maintained throughout, massively improving molecular noise filtering and candidate identification. In addition to many identified blood stem CFD regulators, we offer here this pipeline for use in CFDs other than asymmetric division.
Introduction
Molecules controlling cell fates (eg, death, division, and differentiation) are typically identified by comparing cells of 2 different types or states. However, the resulting lists are typically plagued by irrelevant candidates.1 Single-cell RNA sequencing (scRNA-seq) reveals heterogeneity between individual cells, and the expression variance of a gene is used to infer its relevance.2-4 However, this variance often stems from cell fate divergence (CFD)-independent confounding factors such as the cell cycle (CC) state or differences in cellular history, including clonal origin5 (“cross-clonal differences”) (Figure 1A). Compared individual cells are usually nonsynchronized along the CFD trajectory and compared long before or after the fate decision event, thus capturing only secondary or later CFD consequences but not its initial regulators.
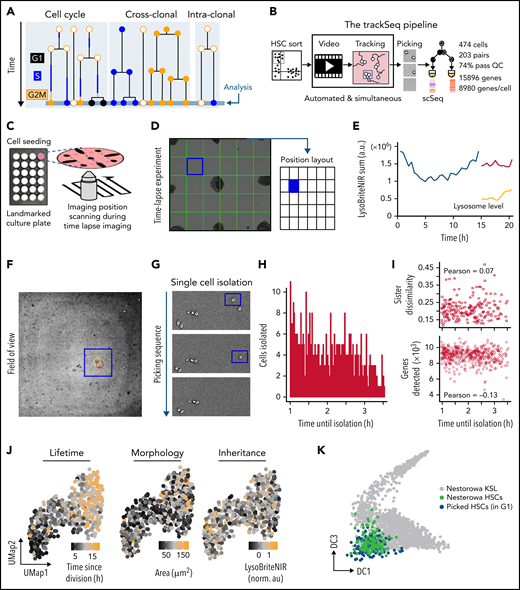
Integrating scRNA-Seq with quantitative time-lapse imaging to identify relevant intra-clonal differences. (A) Transcriptional differences between paired daughter cells (intra-clonal differences) are obscured by CC and cross-clonal differences. (B) trackSeq workflow and performance. Automated real-time event detection in ongoing live cell imaging experiments and convenient cell position navigation by alerT software. Landmarks (eg, manual sharpie dots) mark culture dishes (C) for fast visual co-registration between time lapse and cell picker microscopy field-of-views (D). (E) alerT provides dynamics quantifications from automated cell tracking for quick control by the user. (F) For each identified cell, alerT displays its colony position within the imaging position (field-of-view, panel D). (G) Sequential cell isolation steps are visually logged by alerT. (H-I) Delays in cell picking have no transcriptional effect. (H) Time delays between last observations until picking for each cell used in this study. (I) Used delays do not influence quality of single-cell transcriptional profiles (number of genes detected) or transcriptional sister dissimilarity. (J) Examples of cell properties linked to HSC daughter scRNA-Seq profiles. (K) trackSeq culture and isolation has little impact on HSC transcriptomes. Isolated HSC daughters (blue) in G1 map closely to freshly isolated HSCs (green) in reference landscape of early adult hematopoiesis.24 a.u., arbitrary units; QC, quality control; UMap, Uniform Manifold Approximation and Projection.
Integrating scRNA-Seq with quantitative time-lapse imaging to identify relevant intra-clonal differences. (A) Transcriptional differences between paired daughter cells (intra-clonal differences) are obscured by CC and cross-clonal differences. (B) trackSeq workflow and performance. Automated real-time event detection in ongoing live cell imaging experiments and convenient cell position navigation by alerT software. Landmarks (eg, manual sharpie dots) mark culture dishes (C) for fast visual co-registration between time lapse and cell picker microscopy field-of-views (D). (E) alerT provides dynamics quantifications from automated cell tracking for quick control by the user. (F) For each identified cell, alerT displays its colony position within the imaging position (field-of-view, panel D). (G) Sequential cell isolation steps are visually logged by alerT. (H-I) Delays in cell picking have no transcriptional effect. (H) Time delays between last observations until picking for each cell used in this study. (I) Used delays do not influence quality of single-cell transcriptional profiles (number of genes detected) or transcriptional sister dissimilarity. (J) Examples of cell properties linked to HSC daughter scRNA-Seq profiles. (K) trackSeq culture and isolation has little impact on HSC transcriptomes. Isolated HSC daughters (blue) in G1 map closely to freshly isolated HSCs (green) in reference landscape of early adult hematopoiesis.24 a.u., arbitrary units; QC, quality control; UMap, Uniform Manifold Approximation and Projection.
An ideal experiment identifies CFD regulators by comparing otherwise identical cells only differing in their CFD and at the start of CFD. This is true when comparing fate-diverging sister cells, which have no cross-clonal differences, the same lifetime, and typically the same microenvironment. Molecular differences between CFD sisters should thus be enriched for CFD regulators, which began in the few hours since the mother’s mitosis (“intra-clonal differences”) (Figure 1A).6
However, current scRNA-Seq protocols lose cells’ kinship and/or history information.7-10 Comparing one hematopoietic stem cell (HSC) daughter vs the sister’s future colony output identifies reporters for clonal differentiation bias but without information on their potential regulatory relevance.10 Real-time identification of sisters at the start of CFD is crucial for identification of regulators but is often hampered by delays between fate decision-making and expression of fate markers for its detection.11 One ideal situation to overcome this is asymmetric cell division (ACD), where the future asymmetric daughter fates are prospectively committed already during the mother’s division. Mouse HSCs use ACD12; an example is asymmetric inheritance of lysosomes predicting their future asymmetric metabolic activation and translational activity.
We therefore compared mouse HSC (Lin–Kit+Sca1+CD48–CD150+CD135–CD34–) daughter pairs soon after ACD to establish a pipeline (ie, trackSeq) for combining single-cell tracking with scRNA-Seq to identify CFD regulators. This combines the individual strengths of quantitative time-lapse imaging and cell tracking13-16 with scRNA-Seq. trackSeq performs automated real-time segmentation, quantification, tracking, and event detection of single cells for supervised robotic picking and scRNA-Seq, preserving cellular identity and real-time history (Figure 1B), and linking of single-cell dynamics history and kinship with scRNA-Seq transcriptomes. trackSeq identified the earliest subtle transcriptome changes at the very start of CFD in asymmetrically dividing HSCs. Although we used ACD as one CFD to set up trackSeq, it can now be used for any CFD in which diverging fates can be identified at an early stage, even without kinship information, between cells with different fates or cellular or molecular dynamics.
Methods
Time-lapse imaging of HSC cultures
We performed time-lapse acquisition with YouScope (http://langmo.github.io/youscope/) on Nikon-Ti Eclipse microscopes as described previously12 with yellow fluorescent protein (500/20; 515LP; 535/30) and Cy5 (620/60; 660LP; 700/75; all, AHF) filter cubes to detect VENUS and LysobriteNIR, respectively. PCNAVENUS experiments were imaged every 20 minutes and trackSeq experiments every 30 minutes with 20× (NA 0.75) and 10× (NA 0.45) CFI Plan Apochromat λ objectives, respectively. Cells were cultured in Iscove modified Dulbecco medium12 containing 16.6 μM LysoBriteNIR (22641, AAT Bioquest), at 37°C, 5% oxygen, 5% carbon dioxide in SensoPlate 24 Well Glass bottom plates (Greiner Bio-One) for trackSeq experiments or μ-slide VI0,4 channel slides (IBIDI), coated with 2.5 or 10 μg/mL anti–CD43-biotin (eBIoR2/R60; eBioscience)14 in phosphate-buffered saline at room temperature for 1 hour. The trackSeq experiments were analyzed by self-written automated live event recognition in time-lapse data (alerT) software, and others were tracked as described previously.6,15,17
Automated live event recognition in time-lapse data
The alerT.m script, discussed in this paper, automatically quantified and tracked imaging data incoming from YouScope, with 2 bright-field images (BF1 and BF2) of the same cells with slightly different focus. BF1 and BF2 are set by first focusing on the cells such that the cell bodies become transparent (ie, the focal plane). With a 10× objective, BF1 and BF2 z-coordinates are 3 μm above and below that focal plane, respectively. Cells in BF1 have high intensities within their cell mass surrounded by lower intensities, and vice versa in BF2. In addition, logic integrating each pixel across BF1 and BF2 makes segmentation reliable and fast. Segmented images are then quantified, local background corrected, and tracked.
Single-cell isolation
alerT.m constantly monitored incoming time-lapse data and reported every HSC colony in its 2-cell state with quantified lysosomal inheritance (lysosome ratio). After 40 hours in culture (last 20 hours imaged), cells were placed on ice, washed (3× 1 mL per well; 4°C phosphate-buffered saline) because media impedes complementary DNA production, and transferred to the picker (CellCelector, ALS Automated Lab Solutions GmbH). Coordinates of detected cells were gathered from alerT, which ranks detected cells according to their user-defined relevance (here asymmetric/symmetric lysosome inheritance). For each cell, alerT graphically reports the field of view, the position of the colony within the field of view, and fluorescence dynamics quantifications. It took us 2 minutes to locate and isolate a cell. After isolation, cells were directly transferred into individual wells of cooled 96-well polymerase chain reaction plates (Eppendorf twin.tec; Thomas Fisher Scientific) containing 2.3 μL lysis buffer (diethylpyrocarbonate-treated water [Ambion] with 1 U/μL SUPERase-In RNase inhibitor [Promega] and 0.2% Triton X-100 [Sigma-Aldrich/Merck KGaA]). Isolation times for every cell were recorded and added to time since division. After picking, plates were kept at –80°C until collective processing for transcriptome scRNA-Seq.
scRNA-Seq and primary analysis
After single-cell isolation by picking, we performed scRNA-Seq in an adaption from previously described protocols18 (supplemental Methods, available on the Blood Web site). The read alignment pipeline included STAR,19Samtools,20 and featureCounts.21 Counts were analyzed with R 3.6.2 (R Foundation for Statistical Computing). Cells had to pass perCellQCMetrics (scater22), and additionally detect >100 000 nuclear, <20% mitochondrial, and <50% spike-in reads, and >3000 nuclear genes. We used computeSpikeFactors (scran23) and logNormCounts (scater) to normalize cell-specific count biases.
No stratification gene ranking
After scRNA-Seq quality control and normalization (supplemental Methods), the modelGeneVar function (R library scran) was used to model the technical and biological variance component of each gene, per sequencing batch. We calculated the weighted mean of both components for each gene across sequencing batches, and ranked all genes by ratios of both components to identify most biologically variant genes.
Time since division stratification gene ranking
Time since division stratification (TSDstrat) gene ranking consists of performing the No stratification (NOstrat) gene ranking on a subgroup of cells with a time since division of ≤5 hours, >5 hours and ≤10 hours, >10 hours and ≤15 hours, and >15 hours and ≤20 hours. To account for a gene’s expression across all cells, the 4 rankings were combined by calculating the weighted mean across all groups.
Kinship stratification gene ranking
The Kinship stratification (KINstrat) gene ranking describes whether a gene’s expression differences between sisters are random or biological by comparing observed differences to a random distribution. The less similar these two distributions are, the more biological are the gene’s actual sister expression differences. The random distribution of a given gene is created with the RedistributedCounts.R script as follows.
trackSeq gene ranking
HSC daughter cells are paired by kinship and relative lysosomal inheritance. For every gene, a paired t test compares the log-normalized expression in daughter cells that inherited less LysoBriteNIR summed (ie, LysoLow) vs their LysoHigh sisters. The gene-wise t statistics across all pairs creates a bi-polar ranking. Genes at the top of the list are higher expressed in LysoHigh daughter cells, whereas genes toward the bottom are higher expressed in LysoLow sister cells (supplemental Figure 3A).
Results
Integrating time-lapse imaging and scRNA-Seq
We developed the trackSeq pipeline for automated image acquisition and analysis, cell tracking and event detection, semiautomatic isolation of known cells, and their scRNA-Seq (Figure 1B; “Methods”). Our novel alerT algorithm automatically tracks and quantifies single cells in time-lapse experiments (Figure 1B-C) in real time to detected defined cellular and molecular behaviors; for example, cell divisions and their asymmetry in this study (Figure 1D-E). Specific cells can be found quickly from graphical outputs of alerT specifying imaging positions (Figure 1C-D) and the cells’ localization within these positions (Figure 1F). Live imaging (Figure 1C) and cell isolation (Figure 1G) are conducted on parallel platforms for modularity and broad applicability. Immobilizing live nonadherent HSCs14 minimizes cell loss (0.6%) and preserves identity. Delays between the last observation until isolation (Figure 1H) were recorded (see Methods) and had no impact on transcriptome quality (Figure 1I). Different from current scRNA-Seq approaches, trackSeq maintains the identity of each tracked and sequenced cell, thus combining high-dimensional transcriptomics with the cells’ ancestry and kinship, time since division, and dynamics of morphology and any other parameter quantified during cell tracking, for example (Figure 1J). We applied it to paired HSC daughters and detected 8980 ± 923 genes [mean ± standard deviation; log2(counts per million+1)>2] per cell on average with a single scRNA-Seq run (Figure 1B; supplemental Figure 1B). This is as good as or better than previous HSC sequencing approaches,24,25 showing high quality of the resulting transcriptomes. A total of 474 of 642 HSC daughters passed quality control (see Methods), capturing 203 sister pairs, with 15 896 overall detected genes. These transcriptomes mapped to published transcriptomes of freshly isolated HSCs,24 showing that our approach is robust and unbiased and that gene expression and detection are not impaired by cell imaging and culture (Figure 1K; supplemental Figure 1C-E). After the first HSC division, daughter cells have transcriptomes mapping between HSCs and the earliest multipotent progenitors (supplemental Figure 1H), and HSC granddaughters also remain mostly in the pre–multipotent progenitor transcriptome space (supplemental Figure 1I). Thus, our study explores earlier HSC fate diversion stages than can currently be recognized by surface markers.
trackSeq improves the sensitivity of candidate detection
Identifying CFD regulators from differences in gene expression (Figure 2A) is crucial for mechanistic insight. Candidates are currently identified by high ratios of their biological to technical variance.23,26 However, this ranking (NOstrat) does not control for CC or cross-clonal differences and lacks information about CFD directionality for better extraction of signals from intra-clonal differences (Figure 2B). In contrast, trackSeq compares paired daughter cells with known fates that have the following: (1) identical lifetimes, thus reducing CC variance; (2) the same clonal origin, thus erasing cross-clonal differences; and (3) known CFD directionality. trackSeq can therefore better filter out expression differences not related to CFD to identify otherwise obscured relevant genes. To test the performance of trackSeq, we retrieved the top 500 candidates identified by different data stratifications. The NOstrat method represents the current way of candidate detection.23,26
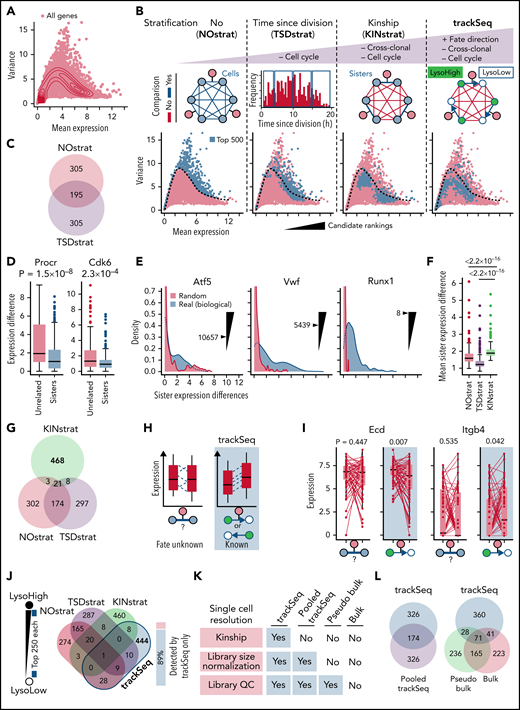
trackSeq improves CFD gene detection by removing scRNA-Seq confounders. (A) HSC gene expression landscape (density). Log2(counts+1) used throughout study. (B) trackSeq stratification steps for increased filtering out of confounders not related to CFD. NOstrat compares gene expression across all cells, TSDstrat across cells with similar lifetimes (removes CC variance), and KINstrat across sisters (identical TSD, removes cross-clonal and CC variance). trackSeq adds fate directionality information. The different stratifications identify drastically different candidates. Dotted line: boundary of NOstrat detection.23 (C) TSDstrat removes CC effects but still detects many more NOstrat candidates than expected by chance (P = 4.27 × 10−171, hypergeometric test). (D) TSDstrat candidates have higher cross-clonal than intra-clonal variance and are thus unlikely CFD regulators. Unrelated: 203 randomly paired cells. Paired Wilcoxon rank sum test. Error bars: Tukey throughout study. (E) KINstrat selects candidates with larger intra-clonal variance than expected by chance. Sister expression differences for representative genes with Kinship stratification ranks. “Real”: absolute sister differences of measured log2(counts+1) expression. “Random”: total raw counts for each gene randomly re-distributed between sisters (see Methods). (F) KINstrat candidates have increased intra-clonal variance. Paired Wilcoxon rank sum test. (G) KINstrat reveals different candidates. (H) Information from trackSeq on sister fate directionality (here lysosome inheritance) improves detection of subtle but directed differences by accumulating directed differences but averaging out uncoordinated differences. (I) Paired trackSeq candidate expression for ACD daughters with lysosome ratio >1.6×, n = 59 pairs. To simulate sister analysis without information on fate directionality, random fates were assigned. Paired t test. (J) Eighty-nine percent of the top 500 trackSeq candidates are missed by other stratification methods. Single-cell resolution is required for differential candidate identification. (K) Decreasing single-cell resolution from trackSeq to pooled cell experiments was simulated by incrementally removing available information from trackSeq data: First, “Pooled trackSeq” averages LysoHigh and LysoLow cells into a LysoHigh or LysoLow pool, respectively. Second, “Pseudo bulk” removes single-cell library size normalization. Third, “Bulk” further removes single-cell library quality control (QC) information that would not be available for complementary DNA libraries from pooled cells. Top 500 candidates identified for each step using paired t tests (supplemental Figure 3A) between LysoHigh/LysoLow pools to relate changes in candidate identification to loss of single-cell information. (L) Loss of single-cell library information worsens trackSeq candidate re-identification. “Pooled trackSeq”/“Pseudo bulk”/“Bulk” identify 34.8%/19.8%/22.4% of trackSeq candidates.
trackSeq improves CFD gene detection by removing scRNA-Seq confounders. (A) HSC gene expression landscape (density). Log2(counts+1) used throughout study. (B) trackSeq stratification steps for increased filtering out of confounders not related to CFD. NOstrat compares gene expression across all cells, TSDstrat across cells with similar lifetimes (removes CC variance), and KINstrat across sisters (identical TSD, removes cross-clonal and CC variance). trackSeq adds fate directionality information. The different stratifications identify drastically different candidates. Dotted line: boundary of NOstrat detection.23 (C) TSDstrat removes CC effects but still detects many more NOstrat candidates than expected by chance (P = 4.27 × 10−171, hypergeometric test). (D) TSDstrat candidates have higher cross-clonal than intra-clonal variance and are thus unlikely CFD regulators. Unrelated: 203 randomly paired cells. Paired Wilcoxon rank sum test. Error bars: Tukey throughout study. (E) KINstrat selects candidates with larger intra-clonal variance than expected by chance. Sister expression differences for representative genes with Kinship stratification ranks. “Real”: absolute sister differences of measured log2(counts+1) expression. “Random”: total raw counts for each gene randomly re-distributed between sisters (see Methods). (F) KINstrat candidates have increased intra-clonal variance. Paired Wilcoxon rank sum test. (G) KINstrat reveals different candidates. (H) Information from trackSeq on sister fate directionality (here lysosome inheritance) improves detection of subtle but directed differences by accumulating directed differences but averaging out uncoordinated differences. (I) Paired trackSeq candidate expression for ACD daughters with lysosome ratio >1.6×, n = 59 pairs. To simulate sister analysis without information on fate directionality, random fates were assigned. Paired t test. (J) Eighty-nine percent of the top 500 trackSeq candidates are missed by other stratification methods. Single-cell resolution is required for differential candidate identification. (K) Decreasing single-cell resolution from trackSeq to pooled cell experiments was simulated by incrementally removing available information from trackSeq data: First, “Pooled trackSeq” averages LysoHigh and LysoLow cells into a LysoHigh or LysoLow pool, respectively. Second, “Pseudo bulk” removes single-cell library size normalization. Third, “Bulk” further removes single-cell library quality control (QC) information that would not be available for complementary DNA libraries from pooled cells. Top 500 candidates identified for each step using paired t tests (supplemental Figure 3A) between LysoHigh/LysoLow pools to relate changes in candidate identification to loss of single-cell information. (L) Loss of single-cell library information worsens trackSeq candidate re-identification. “Pooled trackSeq”/“Pseudo bulk”/“Bulk” identify 34.8%/19.8%/22.4% of trackSeq candidates.
Gene expression changes due to CC progression are a major confounder in scRNA-seq analysis.27 trackSeq provides the cells’ real time since division (TSD), which could correct (“TSDstrat”) for CC-related expression changes. HSC daughter TSD indeed correlated well with transcriptome-inferred CC phases (Figure 3A) and can remove more CC-related confounding candidates than CC regression (Figure 3B-D). However, candidates still highly overlapped with the NOstrat gene set (195 of 500 genes) (Figure 2C), and TSDstrat candidates displayed high cross-clonal expression differences (Figure 2D). To remove confounding cross-clonal variance, we developed KINstrat (see “Methods”). It screens for genes with larger than randomly expected sister differences (Figure 2E) and identified candidates with more divergent sister expression (Figure 2F) but lower general variance than NOstrat or TSDstrat (Figure 2B). Importantly, 93% of candidates were previously undetected (467 of 500 genes) (Figure 2G) because of the improved sensitivity of sister cell comparison, which automatically reduces CC differences due to their identical TSD (Figure 3B).
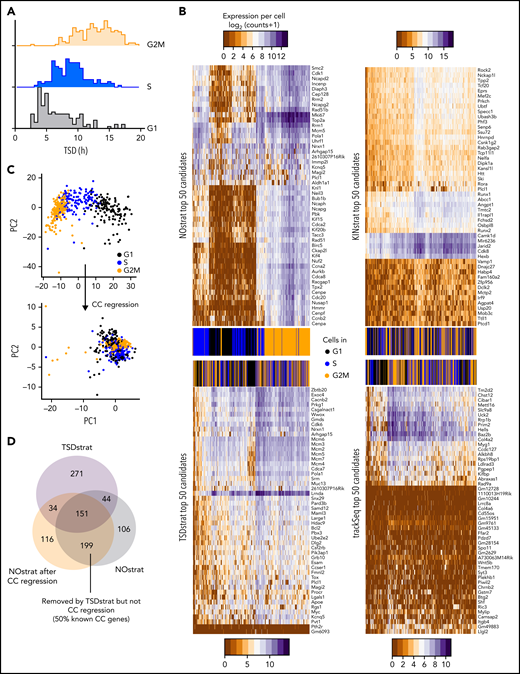
TSDstrat removes CC-dependent confounder genes, which are not recognized by current transcriptome-based approaches. (A) CC progression can be transcriptionally inferred and corrected with regression by the R library Seurat. These inferred CC phases correlate with TSD. (B) TSDstrat removes effects of CC heterogeneity from candidate identification. Heatmap of top 50 NOstrat, TSDstrat, KINstrat, and trackSeq candidates’ expression per cell. Only NOstrat columns and rows cluster for CC progression. Thus, TSD sufficiently controls for CC heterogeneity. (C) Principal component (PC) analysis of scRNA-Seq profiles before and after CC regression. (D) TSDstrat removes different and more CC-dependent genes than CC regression.
TSDstrat removes CC-dependent confounder genes, which are not recognized by current transcriptome-based approaches. (A) CC progression can be transcriptionally inferred and corrected with regression by the R library Seurat. These inferred CC phases correlate with TSD. (B) TSDstrat removes effects of CC heterogeneity from candidate identification. Heatmap of top 50 NOstrat, TSDstrat, KINstrat, and trackSeq candidates’ expression per cell. Only NOstrat columns and rows cluster for CC progression. Thus, TSD sufficiently controls for CC heterogeneity. (C) Principal component (PC) analysis of scRNA-Seq profiles before and after CC regression. (D) TSDstrat removes different and more CC-dependent genes than CC regression.
Although KINstrat improves identification of low variance candidate genes (Figure 2B) by revealing intra-clonal expression changes,7,9,10 it still lacks their correlation with overall future cell fates (and thus functional relevance) and with fate directionality, thus prohibiting the identification of subtle yet coordinated CFD transcriptional changes (Figure 2H). In contrast, trackSeq provides information about fate and transcriptome directionality. In HSC ACD, for example, asymmetric lysosome inheritance predicts the future daughter CFD direction.12 trackSeq correlates sister transcriptome differences with fate directionality to average out undirected differences but accumulate directed differences (Figure 2H-I; supplemental Figure 2A-C). Indeed, of the 500 trackSeq candidates, 444 (89%) remained undetected in all other strategies (Figure 2B,J). For NOstrat and TSDstrat, we used the method by Lun et al,26 which models technical noise as the trend between mean and variance of gene expression. Alternatively, the coefficient of variation28 or coefficient of variation squared26 can be used, which did not change the conceptual advantage of trackSeq, with only 8%, 6%, or 4% of trackSeq candidates re-identified by NOstrat using variance, coefficient of variation, or coefficient of variation squared, respectively.
trackSeq detected drastically different candidates than even the already improved KINstrat (Figure 3B). Only 9 of 500 genes overlapped (Figure 2B), significantly less than expected by chance (hypergeometric test, P = .044). Importantly, lysosome levels without kinship information only explained 15% of genes detected by trackSeq (supplemental Figure 2D-F) and thus are not sufficient to discover ACD CFD regulators. This is due to missing kinship information and because sisters inheriting fewer lysosomes (LysoLow) of one sister pair can have higher lysosome levels than the LysoHigh sisters of other pairs (the same is true for genes). Thus, integrating cellular history information with scRNA-Seq data identifies gene candidates that would otherwise be missed.
trackSeq’s analysis is demanding as it requires users to track every cell’s TSD, kinship, and inheritance during isolation, molecular profiling, and the subsequent expression analysis. We therefore quantified whether all this information is indeed required or if all LysoHigh vs LysoLow cells could simply be pooled into collective wells without kinship information for complementary DNA library preparation. To simulate this pooling, we retrospectively removed single-cell information successively from trackSeq data (Figure 2K). Losing sister paired kinship information already lost 65.2% of trackSeq candidates (“Pooled trackSeq”) (Figure 2L). The additional loss of library quality and fate directionality information further worsens candidate identification, as “Pseudo bulk” and “Bulk” only re-identified 19.8% and 22.4%, respectively, of trackSeq candidates (Figure 2L). Thus, single-cell information of sister pair kinship and fate directionality, as well as single-cell library quality, is crucial for trackSeq performance. These are not available in other scRNA-Seq approaches currently used in the field, which would therefore not have trackSeq’s sensitivity in candidate identification.
Validating identified candidate genes
To show the relevance of trackSeq candidates and the cell fates they regulate, we analyzed their possible cooperation in functional networks, their differential protein expression, and differential sister cell CC progression.
As expected, the robustness of higher ranked trackSeq candidates increases, allowing increased selection stringency (supplemental Figure 2G-J). LysoLow candidates are less robust, likely due to their lower expression (supplemental Figure 4A), which suggests that these candidates are part of new transcriptional programs just starting in LysoLow cells. In contrast, LysoHigh cells remain more similar to the maternal state, and their transcriptional programs were already running and therefore expressed higher. First, we chose 4 candidates with different expression levels, potential stem cell function, and available antibodies to quantify protein levels. Two were LysoHigh candidates (higher in LysoHigh sisters; Tgm2, a transglutaminase with HSC-specific messenger RNA [mRNA] expression,24 and Ecd, a glycolysis activator29). The two LysoLow candidates (higher in LysoLow sisters) were Bace1 (regulates differentiation and proliferation in neural progenitors30) and Map2k4 (required for p38-signaling activation in embryonic stem cell differentiation31) (Figure 2I; supplemental Figure 2G,I-J; supplemental Figure 3A). Because all protein levels increased with CC progression, we compared daughter pairs after binning by TSD. As expected, protein levels were not different between symmetric cell division daughters at any CC stage but differed between ACD daughters for MAP2K4 and ECD (supplemental Figure 3C). The finding that 50% of the tested trackSeq mRNA candidates were also asymmetrically expressed at the protein level, and only in ACD daughters, confirms the candidate selection of trackSeq. Differences for LysoHigh candidate ECD increase later in the CC, likely due to increased mRNA expression in LysoHigh sisters. Expression for LysoLow candidate MAP2K4 proteins was higher in LysoHigh daughters in early CC intervals and differences decreased later in the CC. As previously described,32 this likely reflects the asymmetric inheritance of candidates’ proteins into LysoHigh daughters during ACD, and their loss in LysoLow daughters is compensated by their higher production first of mRNA and then of protein later in the CC. This compensation also agrees with the increased translation activity in LysoLow daughter cells.12
Next, we analyzed if trackSeq candidates are known to cooperate in molecular networks to identify cellular fates likely to be regulated by ACD. In addition, enrichment of trackSeq candidates in the same functional networks would further validate the relevance of their differential expression and function. We therefore queried the STRING database33 for known protein–protein interactions between the top 500 LysoHigh and LysoLow candidates, respectively (Figure 4A). A coordination of different candidates into functional modules would be indicated by their increased number of interactions over that of random genes. Indeed, LysoHigh genes contain 290 interactions, much more than random genes (Figure 4B), indicating their cooperation. In contrast, LysoLow genes are mostly weakly expressed, less varied (supplemental Figure 4A), and are not enriched for interactions.
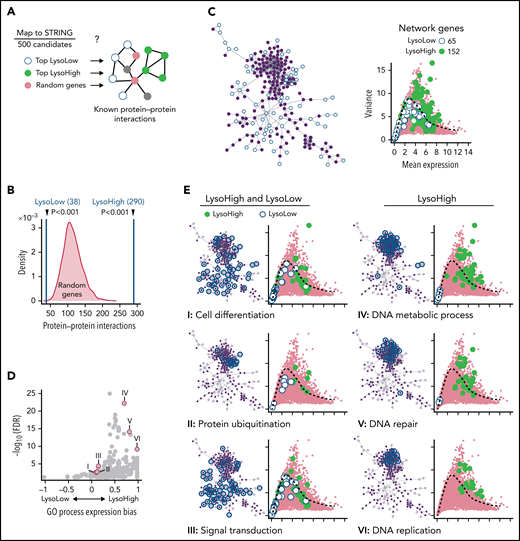
Categorization of identified CFD programs. (A) trackSeq detects functionally cooperating genes. STRING database queried for known protein–protein interactions of trackSeq candidates. Top 500 LysoHigh genes, top 500 LysoLow genes, and 1000 sets of 500 random genes as null distribution queried for interactions. (B) LysoHigh genes contain significantly more than random interactions. P values from null distribution. (C) trackSeq candidates form networks of 65 LysoLow (white) and 152 LysoHigh (green) genes (of top 500 candidates, respectively). (D) Functional enrichments in LysoHigh and LysoLow sisters. Expression bias: ratio of LysoHigh to LysoLow candidates in process, normalized by number of process genes in network. If >0, more LysoHigh candidates involved; if <0, more LysoLow candidates involved. (E) Functional predictions from network: HSC daughters modulate cell differentiation, protein catabolism, and signaling. LysoHigh network components suggest faster CC transition than in LysoLow sisters. Mean and variance of gene expression from Figure 2B, shown throughout figure. FDR, false discovery rate of process enrichment within network.
Categorization of identified CFD programs. (A) trackSeq detects functionally cooperating genes. STRING database queried for known protein–protein interactions of trackSeq candidates. Top 500 LysoHigh genes, top 500 LysoLow genes, and 1000 sets of 500 random genes as null distribution queried for interactions. (B) LysoHigh genes contain significantly more than random interactions. P values from null distribution. (C) trackSeq candidates form networks of 65 LysoLow (white) and 152 LysoHigh (green) genes (of top 500 candidates, respectively). (D) Functional enrichments in LysoHigh and LysoLow sisters. Expression bias: ratio of LysoHigh to LysoLow candidates in process, normalized by number of process genes in network. If >0, more LysoHigh candidates involved; if <0, more LysoLow candidates involved. (E) Functional predictions from network: HSC daughters modulate cell differentiation, protein catabolism, and signaling. LysoHigh network components suggest faster CC transition than in LysoLow sisters. Mean and variance of gene expression from Figure 2B, shown throughout figure. FDR, false discovery rate of process enrichment within network.
Because ACD CFD might induce exit from vs maintenance of the maternal state through a shared network, we decided to check protein–protein interactions between LysoLow and LysoHigh candidates together. Most candidate interactions originate from a single network (Figure 4C; supplemental Figure 5B), enriched for “Protein ubiquitination” and “Signal transduction” (Figure 4D-E) (eg, for Ras-, Wnt-, or Vegf signaling) (supplemental Figure 4C). LysoHigh candidates include ubiquitin ligases such as Uhrf1 (involved in HSC self-renewal34), Traf3, and Btrc (degrading IκBα35), all activators of both NF-κB signaling axes, which is essential for HSC survival.36Rrm2, Dut, Hells, and Uhrf1 (LysoHigh) are regulators of early hematopoiesis.37 Mitochondrial clearance and glycolysis are other essential HSC properties. “Protein ubiquitination” candidates (eg, interaction of the LysoHigh candidates Fbxo15 and Kifbp) suppress metabolic activation by degrading mitochondria,38 in line with asymmetric inheritance of mitophagosomes in HSC ACD.12 LysoHigh candidate Hells supports glycolysis and accelerates CC.39
“DNA metabolic process,” “DNA repair,” “DNA replication” (Figure 4E), and “Cell cycle” (supplemental Figure 4D) showed reduced expression in LysoLow daughter cells, suggesting slower CC progression in LysoLow sisters. This was unexpected because it had not been detected in HSC ACD daughters and because LysoLow sisters display increased metabolic activation.12 We therefore experimentally tested this prediction and imaged live HSCs expressing PCNAVENUS (Figure 5A) reporting G1/S and S/G2M CC phase transitions (Figure 5B). This enables CC phase length quantification (Figure 5C-D), which agreed well with transcriptome inferred CC phases (Figure 5E). Upon symmetric cell division, no difference between sister CC lengths could be detected (mean ± standard deviation, 17.9 ± 5.4 hours) (Figure 5F-G). In contrast, as predicted by trackSeq, CC was indeed longer in LysoLow HSC ACD daughters (mean difference, 2.3 hours; 19.9 ± 7.0 hours vs 17.7 ± 6.8 hours) due to an elongated G1 phase and to a lesser extent S phases. Importantly, inhibiting trackSeq candidates known to regulate the G1/S transition (Chd1l,40 Dctpp1,41 Rad9a,42 and Cdc25a43) (Figure 5H), and for which small molecule inhibitors were available (“Compound 5,”44 Pyrcoumin,45 NSC15520,46 and NSC663054,47 respectively), eliminated the systematic CC difference after ACD, less efficiently for Chd1l (Figure 5I), without changing overall CC lengths (supplemental Figure 5B). This shows the functional specificity of candidates identified by trackSeq.
![Validation of predicted CC progression differences. (A) Experimental workflow. (B) PCNAVENUS nuclear patterns identify CC phase transitions. Scale bar = 5 µm. (C) Correlation of CC phase durations and lysosomal inheritance between paired HSC daughters. (D) G1 symmetry (indicated by red line) of 152 symmetric (lysosome ratio ≤1.3×) and 96 ACD (lysosome ratio ≥1.6×, throughout figure) HSC daughter pairs. Sorted by LysoHigh G1 length (5 replicates). (E) Agreement between scRNA-Seq transcriptome-inferred and PCNAVENUS-measured CC state assignment for individual cells. S/G2M transition occurs earlier in scRNA-Seq compared with PCNAVENUS data. Percentage of cells in each CC phase (G1, S, and G2M) for every hour of TSD plotted for scRNA-Seq and PCNAVENUS derived data. (F) ACD correlates with CC elongation in LysoLow daughter due to G1 and to lesser extent S-phase expansion. P values from Wilcoxon matched-pairs signed-rank tests. Error bars: Tukey. (G) CC phase duration expansions between paired daughter cells (% relative to longer sister) sorted by relative elongation per pair. Some symmetric cell division outliers trimmed to maximize displayed dynamic range (CC, 1; G1, 1; S, 3; G2M, 1). (H-I) The systematic CC difference after ACD (asymmetric lysosome inheritance) is neutralized by inhibiting trackSeq candidates. (H) We identified trackSeq candidates that are known G1/S regulators with available small molecule inhibitors. (I) Inhibiting candidates neutralizes the systematic CC difference after ACD while unspecific inhibition of lysosomes and CC does not. Green line indicates lack of ACD CC effect. None (n = 82 cells [3 replicates]); dimethyl sulfoxide (DMSO) (n = 56 [5 replicates]); NH4Cl (1 μM, n = 38; 10 μM, n = 46 [2 replicates]); bafilomycin (0.5 nM, n = 42; 1 nM, n = 32 [2 replicates]); Compound 5 (0.2 μM, n = 54 [2 replicates]; 2 μM, n = 122 [4 replicates]); and NSC15520 (5 μM, n = 120; 50 μM, n = 106 [4 replicates]); Pyrcoumin (0.5 μM: n = 74; 5 μM: n = 122 [4 replicates]); NSC663246 (34 nM, n = 20 [1 replicate]; 340 nM, n = 102 [4 replicates]). Outliers (>100% elongation) omitted, full range shown in supplemental Figure 6. P values from Wilcoxon signed-rank test of LysoHigh vs LysoLow daughter CC. SCF, stem cell factor; TPO, thrombopoietin.](https://ash.silverchair-cdn.com/ash/content_public/journal/blood/140/13/10.1182_blood.2022016880/4/m_bloodbld2022016880f5.png?Expires=1769091182&Signature=UYz7tvJRA5WHoXsUYFGgDhnmLiVxZ32unsMv~Z6k10smMj0EJsa41afq8oHKFZLntC3P~UdG2qriBQVzkerUzUdgpVAHEcWRCtf-ojfh1eTsRJgRMdCB0QKWQjdaeEd8GWPxwgndXZNNRwLoGvagUshWmtOfRxQCpixHL0PVpdXcLu8D0~8MW3GH21Bxw~QyjmO5b0XOlYdGj2AJLLJpe~PQZ5-Mw3Ny-zJmo5Pw4FoEILq6MwXGXO1tDtbkm4OTxiCXRb2D81U6g4a3iYSY39c6p8d6unV0kodygM1ztsxF2G8~HADMU7n4RhqT~94xz5q2noha2FH4mkQLtEToDg__&Key-Pair-Id=APKAIE5G5CRDK6RD3PGA)
Validation of predicted CC progression differences. (A) Experimental workflow. (B) PCNAVENUS nuclear patterns identify CC phase transitions. Scale bar = 5 µm. (C) Correlation of CC phase durations and lysosomal inheritance between paired HSC daughters. (D) G1 symmetry (indicated by red line) of 152 symmetric (lysosome ratio ≤1.3×) and 96 ACD (lysosome ratio ≥1.6×, throughout figure) HSC daughter pairs. Sorted by LysoHigh G1 length (5 replicates). (E) Agreement between scRNA-Seq transcriptome-inferred and PCNAVENUS-measured CC state assignment for individual cells. S/G2M transition occurs earlier in scRNA-Seq compared with PCNAVENUS data. Percentage of cells in each CC phase (G1, S, and G2M) for every hour of TSD plotted for scRNA-Seq and PCNAVENUS derived data. (F) ACD correlates with CC elongation in LysoLow daughter due to G1 and to lesser extent S-phase expansion. P values from Wilcoxon matched-pairs signed-rank tests. Error bars: Tukey. (G) CC phase duration expansions between paired daughter cells (% relative to longer sister) sorted by relative elongation per pair. Some symmetric cell division outliers trimmed to maximize displayed dynamic range (CC, 1; G1, 1; S, 3; G2M, 1). (H-I) The systematic CC difference after ACD (asymmetric lysosome inheritance) is neutralized by inhibiting trackSeq candidates. (H) We identified trackSeq candidates that are known G1/S regulators with available small molecule inhibitors. (I) Inhibiting candidates neutralizes the systematic CC difference after ACD while unspecific inhibition of lysosomes and CC does not. Green line indicates lack of ACD CC effect. None (n = 82 cells [3 replicates]); dimethyl sulfoxide (DMSO) (n = 56 [5 replicates]); NH4Cl (1 μM, n = 38; 10 μM, n = 46 [2 replicates]); bafilomycin (0.5 nM, n = 42; 1 nM, n = 32 [2 replicates]); Compound 5 (0.2 μM, n = 54 [2 replicates]; 2 μM, n = 122 [4 replicates]); and NSC15520 (5 μM, n = 120; 50 μM, n = 106 [4 replicates]); Pyrcoumin (0.5 μM: n = 74; 5 μM: n = 122 [4 replicates]); NSC663246 (34 nM, n = 20 [1 replicate]; 340 nM, n = 102 [4 replicates]). Outliers (>100% elongation) omitted, full range shown in supplemental Figure 6. P values from Wilcoxon signed-rank test of LysoHigh vs LysoLow daughter CC. SCF, stem cell factor; TPO, thrombopoietin.
Validation of predicted CC progression differences. (A) Experimental workflow. (B) PCNAVENUS nuclear patterns identify CC phase transitions. Scale bar = 5 µm. (C) Correlation of CC phase durations and lysosomal inheritance between paired HSC daughters. (D) G1 symmetry (indicated by red line) of 152 symmetric (lysosome ratio ≤1.3×) and 96 ACD (lysosome ratio ≥1.6×, throughout figure) HSC daughter pairs. Sorted by LysoHigh G1 length (5 replicates). (E) Agreement between scRNA-Seq transcriptome-inferred and PCNAVENUS-measured CC state assignment for individual cells. S/G2M transition occurs earlier in scRNA-Seq compared with PCNAVENUS data. Percentage of cells in each CC phase (G1, S, and G2M) for every hour of TSD plotted for scRNA-Seq and PCNAVENUS derived data. (F) ACD correlates with CC elongation in LysoLow daughter due to G1 and to lesser extent S-phase expansion. P values from Wilcoxon matched-pairs signed-rank tests. Error bars: Tukey. (G) CC phase duration expansions between paired daughter cells (% relative to longer sister) sorted by relative elongation per pair. Some symmetric cell division outliers trimmed to maximize displayed dynamic range (CC, 1; G1, 1; S, 3; G2M, 1). (H-I) The systematic CC difference after ACD (asymmetric lysosome inheritance) is neutralized by inhibiting trackSeq candidates. (H) We identified trackSeq candidates that are known G1/S regulators with available small molecule inhibitors. (I) Inhibiting candidates neutralizes the systematic CC difference after ACD while unspecific inhibition of lysosomes and CC does not. Green line indicates lack of ACD CC effect. None (n = 82 cells [3 replicates]); dimethyl sulfoxide (DMSO) (n = 56 [5 replicates]); NH4Cl (1 μM, n = 38; 10 μM, n = 46 [2 replicates]); bafilomycin (0.5 nM, n = 42; 1 nM, n = 32 [2 replicates]); Compound 5 (0.2 μM, n = 54 [2 replicates]; 2 μM, n = 122 [4 replicates]); and NSC15520 (5 μM, n = 120; 50 μM, n = 106 [4 replicates]); Pyrcoumin (0.5 μM: n = 74; 5 μM: n = 122 [4 replicates]); NSC663246 (34 nM, n = 20 [1 replicate]; 340 nM, n = 102 [4 replicates]). Outliers (>100% elongation) omitted, full range shown in supplemental Figure 6. P values from Wilcoxon signed-rank test of LysoHigh vs LysoLow daughter CC. SCF, stem cell factor; TPO, thrombopoietin.
To also functionally validate a CC-independent trackSeq candidate, we identified CC-independent CFD programs by excluding 63 daughter pairs with pronounced CC differences (Figure 6A) from a second trackSeq candidate identification. This removed 294 of the original top 500 trackSeq candidates encoding the systematic CC effect (Figure 6B). The remaining 206 candidates were enriched for the Kyoto Encyclopedia of Genes and Genomes pathway “Extracellular matrix [ECM]-receptor interactions” with Itgb4 as a central node (Figure 6C), which we investigated further.
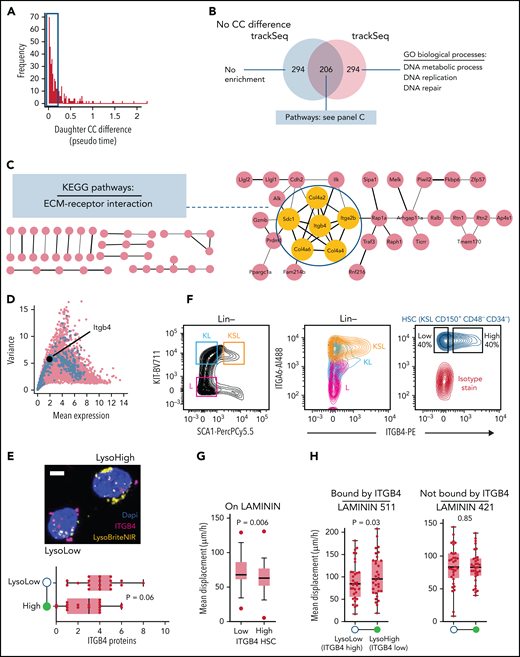
Experimental validation of trackSeq candidate Itgb4. (A) Identifying CC-independent expression differences. Histogram of absolute transcriptome-inferred pseudo time (ie, CC) difference between paired daughters. Cutoff at <0.2 excludes 63 pairs. (B) Venn diagram of top 500 trackSeq candidates including or excluding sister pairs with CC differences. Gene set size and pathway/process enrichments from STRING are shown. (C) Itgb4 is a central node of the ECM-receptor interaction pathway indicating a CC-independent putative niche retention mechanism regulated by ACD. A total of 206 CC-independent trackSeq candidates mapped to STRING database, with unconnected nodes omitted. Yellow nodes = candidates of the Kyoto Encyclopedia of Genes and Genomes (KEGG) pathway ECM-receptor interaction. (D) Itgb4 is a weakly expressed LysoLow trackSeq candidate. Plot as in Figure 2B; top 500 trackSeq candidate genes in blue. (E) Higher ITGB4 protein expression in ACD LysoLow than in LysoHigh HSC daughters. ITGB4 detection by proximity ligation assay immunostaining. Eighteen ACD (lysosome ratio >1.6×) pairs from 2 replicates. P value from paired t test. Whiskers = minimum–maximum. Example ACD HSC daughter pair after PLA (top). Scale bar = 5 μm. (F) Surface expression of ITGB4 and dimerization partner ITGA6 quantified by fluorescence-activated cell sorting. Their expression decreases during HSC differentiation (middle). ITGB4 expression varies in HSCs (right). (G) ITGB4-high HSCs are more adherent to LAMININ than ITGB4-low HSCs. Mean HSC displacement per time quantified by time-lapse imaging. t test. 53/48 ITGB4-low/high HSCs from 3 replicates. (H) Higher LAMININ adhesion of LysoLow (higher Itgb4 expression) than LysoHigh HSC daughters. Quantification of ACD (lysosome ratio >1.6×) HSC daughter displacement on LAMININ 511 (bound by ITGB4) or 421 (not bound by ITGB4). 32/33 pairs for LAMININ 511/421. Paired t tests from 3 replicates; error bars = minimum–maximum. GO, gene ontology.
Experimental validation of trackSeq candidate Itgb4. (A) Identifying CC-independent expression differences. Histogram of absolute transcriptome-inferred pseudo time (ie, CC) difference between paired daughters. Cutoff at <0.2 excludes 63 pairs. (B) Venn diagram of top 500 trackSeq candidates including or excluding sister pairs with CC differences. Gene set size and pathway/process enrichments from STRING are shown. (C) Itgb4 is a central node of the ECM-receptor interaction pathway indicating a CC-independent putative niche retention mechanism regulated by ACD. A total of 206 CC-independent trackSeq candidates mapped to STRING database, with unconnected nodes omitted. Yellow nodes = candidates of the Kyoto Encyclopedia of Genes and Genomes (KEGG) pathway ECM-receptor interaction. (D) Itgb4 is a weakly expressed LysoLow trackSeq candidate. Plot as in Figure 2B; top 500 trackSeq candidate genes in blue. (E) Higher ITGB4 protein expression in ACD LysoLow than in LysoHigh HSC daughters. ITGB4 detection by proximity ligation assay immunostaining. Eighteen ACD (lysosome ratio >1.6×) pairs from 2 replicates. P value from paired t test. Whiskers = minimum–maximum. Example ACD HSC daughter pair after PLA (top). Scale bar = 5 μm. (F) Surface expression of ITGB4 and dimerization partner ITGA6 quantified by fluorescence-activated cell sorting. Their expression decreases during HSC differentiation (middle). ITGB4 expression varies in HSCs (right). (G) ITGB4-high HSCs are more adherent to LAMININ than ITGB4-low HSCs. Mean HSC displacement per time quantified by time-lapse imaging. t test. 53/48 ITGB4-low/high HSCs from 3 replicates. (H) Higher LAMININ adhesion of LysoLow (higher Itgb4 expression) than LysoHigh HSC daughters. Quantification of ACD (lysosome ratio >1.6×) HSC daughter displacement on LAMININ 511 (bound by ITGB4) or 421 (not bound by ITGB4). 32/33 pairs for LAMININ 511/421. Paired t tests from 3 replicates; error bars = minimum–maximum. GO, gene ontology.
Itgb4 is the top LysoLow candidate (Figure 2I), indicating a putative ECM interaction mechanism regulated by ACD. This weakly expressed (Figure 6D) integrin b4 chain dimerizes with integrin a6 (Itga6, CD49f, a human HSC marker48) to specifically bind laminins.49,50 We used proximity ligation assay amplification for robust ITGB4 detection in HSC daughter cells after ACD. As for mRNA, ITGB4 protein levels were higher in LysoLow ACD daughters (Figure 6E). Interestingly, fluorescence-activated cell sorting quantification revealed that ITGA6 and ITGB4 expression decreased with hematopoietic differentiation (Figure 6F), and ITGB4 expression varied across HSCs. This suggests a possible function of ITGB4 in HSCs, likely by mediating adhesion to LAMININ. We therefore used live cell time-lapse imaging to quantify the adhesion vs cell displacement of HSCs and their daughters on specific laminins. As expected, ITGB4 expression correlated with adhesion of freshly isolated HSCs to LAMININ, as ITGB4-low HSCs were displaced more than ITGB4-high HSCs (Figure 6G). In addition, when cultured on LAMININ 511 that is specifically bound by ITGB4,51 LysoLow ACD HSC daughters (expressing more ITGB4) indeed moved less than their LysoHigh sisters (Figure 6H). In contrast, this difference could not be observed when cultured on LAMININ 421, which is not bound by ITGB4.51 This confirms both ITGB4-mediated HSC adhesion to LAMININ 511 and its asymmetric regulation downstream of ACD, and further validates the functional relevance of the gene candidate Itgb4, which was exclusively identified by trackSeq.
The experimental validation of the regulation and functional relevance of the first trackSeq candidates analyzed here shows the high potential value also of the many other trackSeq candidates. This treasure trove of potential HSC CFD regulator candidate genes is now available to the community in supplemental Data 4.
Discussion
We introduce trackSeq, a novel approach for combining scRNA-Seq data with single-cell kinship and dynamics history from time-lapse imaging, and report its superior sensitivity for CFD regulator identification. Literature-based and experimental validation of identified candidates confirm both the improved sensitivity of trackSeq for detecting small but relevant transcriptome differences and the functional relevance of the already analyzed candidates, and thus likely also of a large part of the provided long list of novel candidates for molecular regulation of the earliest HSC fate decisions.
Real-time and kinship data provided by trackSeq confirmed the validity of transcriptome-based inference of CC states and of sister comparisons for reducing cross-clonal noise, similar to previous work that used paired daughter/cousin comparisons on high-dimensional scRNA-Seq9,10 or on low-dimensional time series to filter out unwanted variance.6,11,12,17,52 TSD information of our scRNA-Seq profiles is now also a useful resource to study CC-dependent gene expression in HSCs similar to recent studies in human cell lines.53 trackSeq improved differential candidate gene identification with much lower expression and variance, as shown here by using the example of asymmetrically dividing HSCs. These candidates would have been missed even by sister analyses without information of individual cells’ dynamics history and CFD direction (trackSeq vs KINstrat) used in a previous study9 (Figure 2I). trackSeq identifies otherwise obscured candidates, several of which could already be functionally validated by experimental findings such as the differential oxidative phosphorylation between ACD HSC daughters12 and the differential CC phase lengths or cell adhesion quantified here. Similarly, only 3 of the top 10 biological processes found by STRING within the trackSeq top 500 candidates were also found by TSDstrat and KINstrat (supplemental Data 3). The improved candidate identification by trackSeq thus translates directly into processes discovery. It is therefore highly promising that the list of identified gene candidates provided here contains many other relevant CFD regulators for future functional validation.
LysoLow daughters undergo changes indicating the activation of HSCs, including translational and oxidative phosphorylation activation,12 and express candidates modulating adhesion and motility. The longer CC of LysoLow sisters was initially surprising due to their higher metabolic activation.12 However, lysosome abundance and CC length is indeed linked in yeast where lysosomes are required for G1/S phase progression.54 In neuronal progenitors, an extended G1 phase seems required for differentiation.55 It is interesting to speculate that the extended LysoLow G1 phase contributes to CFD induction by extending the time a cell is receptive for signaling inputs or can accumulate CFD regulatory proteins, for example. Indeed, G1 expansion causes lineage output imbalances of human HSC,56 and ACD increases the lineage output heterogeneity of mouse HSCs.12 Importantly, because trackSeq analyzes cells at different TSD, it allows analyzing if target programs are implemented at different times after division and detects convergence or divergence (supplemental Figure 6). We found that LysoLow candidates are lowly expressed, and their sister differences tend to diverge later in CC, suggesting novel transcriptional programs starting in LysoLow ACD daughters. In contrast, LysoHigh candidate expression is higher and sister differences tend to converge or remain stable with CC progression. The “DNA repair” process enriched in LysoHigh daughters in combination with their shorter lifetime and previously reported metabolic quiescence12 suggests their programmatic focus on genome integrity and the maintenance of the mother’s state.
The candidate identification of trackSeq as used here relies on paired daughter cell analysis, and thus on dividing cultured HSCs. HSCs periodically also leave their G0 state in vivo, increasingly so in response to stress. This is one major situation for HSC fate regulation and likely similar to HSCs starting to divide in vitro.
We used the ideal situation of ACD here to establish and validate trackSeq; however, its application is not limited to ACD. trackSeq can now also be used for any CFD in different cell types and species, provided that early reporters for the live identification of CFD exist.6,15,57 Although the comparison of closely related cells removes cross-clonal differences, trackSeq can also compare nonrelated cells that differ in their fate trajectory or cellular or molecular dynamics. One example is signaling activity dynamics, which regulate cell fates and require continuous live single-cell tracking for their quantification.58 Heterogeneous signaling activity dynamics exist in hematopoietic stem and progenitor cells.59 We have already used trackSeq to identify signaling dynamics-specific hematopoietic stem and progenitor cell gene target programs, in this case only using dynamics history but no kinship or fate directionality information.60 Finally, trackSeq is not restricted to scRNA-Seq but can be used with other single-cell omics approaches (eg, single-cell sequencing assay for transposase-accessible chromatin or single-cell methylation and transcriptome sequencing).61
Acknowledgments
The authors thank G. Camenisch, M. D. Hussherr, T. Lopes, M. Di Tacchio, C. Beisel, K. Eschbach, and M. Okoniewski for technical support, and J. Bernitz and B. Brachvogel for discussions.
This study was funded by the Swiss National Science Foundation (grant 179490, T.S.).
Authorship
Contribution: Conceptualization: T.S. and A.W.; methodology: A.W., D.L., T.K., B.G., C.D., B.S., M.L., and A.M.; investigation: A.W., Y.Z., M.L., and A.M.; data curation: A.W., Y.Z., T.K., G.C.O., and D.L.; formal analysis: A.W., Y.Z., and M.L.; software: A.W., D.L., and T.S.; visualization: A.W. and T.S.; supervision: T.S. and D.L.; resources: T.S. and N.A.; writing–original draft: A.W. and T.S.; writing–review and editing: T.S., D.L., T.K., B.G., and Y.Z.; project administration: T.S.; and funding acquisition, T.S.
Conflict-of-interest disclosure: The authors declare no competing financial interests.
Correspondence: T. Schroeder, Department of Biosystems Science and Engineering, ETH Zurich, Mattenstrasse 26, 4058 Basel, Switzerland; e-mail: timm.schroeder@bsse.ethz.ch.
The alerT algorithm is available under https://bsse.ethz.ch/csd/software/alerT. Figure 1D and supplemental Figure 1 contain published data from Nestorowa et al24 (http://blood.stemcells.cam.ac.uk/single_cell_atlas.html). Raw gene expression data are uploaded to the Gene Expression Omnibus database (accession number GSE167317). Raw time-lapse data are available upon reasonable request. Access to data is not restricted. Code necessary to reproduce the findings of this study is available under https://bsse.ethz.ch/csd/software/trackSeq.html.
The online version of this article contains a data supplement.
The publication costs of this article were defrayed in part by page charge payment. Therefore, and solely to indicate this fact, this article is hereby marked “advertisement” in accordance with 18 USC section 1734.

This feature is available to Subscribers Only
Sign In or Create an Account Close Modal