

Key Points
Full-length scRNA-seq identifies a detailed pre-HE to HE maturation trajectory marked by ACE (CD143).
Runx1b+ subaortic cells can support hematopoietic activity and consist of smooth muscle and PDGFRa expressing mesenchymal cells.

Abstract
In vitro generation and expansion of hematopoietic stem cells (HSCs) holds great promise for the treatment of any ailment that relies on bone marrow or blood transplantation. To achieve this, it is essential to resolve the molecular and cellular pathways that govern HSC formation in the embryo. HSCs first emerge in the aorta-gonad-mesonephros (AGM) region, where a rare subset of endothelial cells, hemogenic endothelium (HE), undergoes an endothelial-to-hematopoietic transition (EHT). Here, we present full-length single-cell RNA sequencing (scRNA-seq) of the EHT process with a focus on HE and dorsal aorta niche cells. By using Runx1b and Gfi1/1b transgenic reporter mouse models to isolate HE, we uncovered that the pre-HE to HE continuum is specifically marked by angiotensin-I converting enzyme (ACE) expression. We established that HE cells begin to enter the cell cycle near the time of EHT initiation when their morphology still resembles endothelial cells. We further demonstrated that RUNX1 AGM niche cells consist of vascular smooth muscle cells and PDGFRa+ mesenchymal cells and can functionally support hematopoiesis. Overall, our study provides new insights into HE differentiation toward HSC and the role of AGM RUNX1+ niche cells in this process. Our expansive scRNA-seq datasets represents a powerful resource to investigate these processes further.
Introduction
Hematopoietic stem cells (HSCs) sit at the apex of the blood system and are powerful treatment modalities for cancer and blood malignancies.1,2 Understanding the molecular programs underpinning their formation during embryogenesis is critical for the development of efficient protocols to generate and amplify HSCs in vitro. In mice, the first transplantable HSCs are generated intraembryonically in the region of the aorta-gonad-mesonephros (AGM) between embryonic day 10.5 (E)10.5 to E11.5.3-5 Within this narrow time window, specialized endothelial cells lining the dorsal aorta (DA), known as hemogenic endothelium (HE), transition to nonadherent hematopoietic cells via a process termed the endothelial-to-hematopoietic transition (EHT).6-10 Morphologically, the EHT produces intra-aortic hematopoietic clusters (IAHC) protruding from the endothelium into the lumen of the DA and other major arteries.11-13 Although HE is established as the cellular source of the first blood cells in vivo and in vitro,8,10,14 our knowledge of the molecular and cellular mechanisms regulating HSC emergence from HE remains incomplete.
The transcription factor RUNX1 controls the initiation and completion of EHT and is essential for establishing definitive hematopoiesis.15-19 The downstream RUNX1 target genes Gfi1/Gfi1b encode critical regulators of EHT that recruit histone-modifying complexes to silence the endothelial program in HE.20,21 The sequential expression of the transcriptional repressors GFI1/1B marks distinct stages of the EHT. GFI1 is expressed in HE, whereas GFI1B is mainly found in IAHC.21 In contrast, RUNX1 expression is detected during all stages of EHT.22,23 Additionally, RUNX1 expression is also found in subaortic mesenchyme.5,22,24 The exact identity and the potential role of these mesenchymal RUNX1+ cells are currently unknown.
Single-cell RNA sequencing (scRNA-seq) is a powerful tool to profile developmental pathways. Although this can now be done globally on whole organs and organisms,25-29 understanding pathways involving rare cell populations still greatly benefits from targeted approaches using enriched cell populations. We and others have previously taken the latter approach to start resolving molecular events leading up to HSC formation in the murine AGM.30-35 Much emphasis has been on the final steps of HSC commitment within the IAHC.11,31,33,35 However, the intricacies of DA HE differentiation before the initiation of EHT are not well defined. Reasons for this are the rarity of the HE population but also a lack of suitable cell surface markers for HE purification.
To gain insight into how DA HE progresses toward EHT, we used 2 transgenic reporter mouse models (Runx1bRFP and Gfi1Tomato/Gfi1bGFP)20,21,23,36,37 to isolate and profile a wide variety of phenotypic HEs. We reasoned that targeted scRNA-seq of Runx1b:RFP+ and Gfi1:Tomato+ phenotypic HE populations is essential to profile them in-depth because they represent only a small fraction of the total CDH5+ endothelial populations in the AGM (∼6% and 0.6%, respectively; supplemental Figure 1, available on the Blood Web site). We also profiled Runx1b:RFP+ AGM mesenchymal cells. To maximize data recovery, we adopted a full-length scRNA-seq protocol.38,39 The resulting dataset contains nearly 1200 fluorescence-activated cell sorted (FACS) cells, representing 9 E10.5 mouse AGM populations.
Our data capture a detailed HE differentiation continuum, covering pre-HE and HE stages. We found that this continuum is marked by angiotensin-I converting enzyme (ACE) expression and that pre-HE and HE can be discerned based on cell-cycle status. Additionally, we establish that the rare Runx1b:RFP+ subaortic mesenchymal population supports hematopoiesis and consists of smooth muscle and PDGFRa+ cells. This high-resolution single-cell data set covering HE and its surrounding niche in the mouse DA can be queried at http://shiny.cruk.manchester.ac.uk/AGM_scRNA/.
Materials and methods
Mouse embryos
Mouse work was performed following the UK Animal Scientific Procedures Act 1986 and was approved by the Animal Welfare and Ethics Review Body of the Cancer Research UK Manchester Institute. Gfi1GFP/Gfi1bGFP, Gfi1Tomato/Gfi1bGFP, and Runx1bRFP lines have been described previously.20,21,23,36 Embryos were genotyped and processed as previously described.20,21,23 Genotyping primers are listed in supplemental Table 1 (available on the Blood Web site).
Zebrafish experiments
Zebrafish work was performed by Azelead (France) following the EU guidelines for handling laboratory animals and was approved by the Animal Care and Use Committee (APAFIS#21063). Transgenic lines Tg(cd41:eGFP) and Tg(kdrl:caax-mCherry) have been described previously.40,41 Antisense ptn morpholino: 5'-CTGTAGTCTGAGGAATAGTTTGGTT-3' (GeneToolsLLC), negative control morpholino: 5'-CCTCTTACCTCAGTTACAATTTATA-3' or vehicle was injected into single-cell embryos, as previously described.42 Embryos were imaged using a Zeiss LSM510 and Celldiscoverer7.
Flow cytometry
LSR Fortessa X20, AriaIII, and FlowJo (BD Biosciences) were used for FACS analysis and sorting. Antibodies are listed in supplemental Table 1.
Ex vivo AGM assays
Reaggregation experiments: AGM cells were FACS depleted of the target population and reaggregated for 4 days in hanging drop culture as previously described.21 Aggregates were trypsinized and analyzed in colony-forming unit (CFU) assays as previously described.43 Coculture experiments: FACS isolated AGM cells were cocultured with vascular niche cells for 10 days as previously described.21,44,45
scRNA-seq and data processing
Cells were sorted into lysis buffer and snap-frozen. Libraries were prepared using a modified Smart-Seq2 protocol described previously46 and 38 bp or 75 bp paired-end sequenced on an Illumina NextSeq 500. FASTQ data were mapped to GRCm38 using STAR.47 Count matrix was obtained with HTSeq48 and loaded into the R environment with Scater.49 Published scRNA-seq data32,34 was downloaded from GEO (GSE112642, GSE137116). Detailed workflows are in the supplemental Methods.
Immunofluorescence
Embryos fixed in 4% formaldehyde were embedded in paraffin or snap-frozen. Staining and processing of frozen sections has been described previously.21,50 Staining of paraffin-embedded sections was performed on the Leica BOND RX as previously described.51 Antibodies are listed in supplemental Table 1. Image analyses were performed with QuPath52 (version 0.2.3).
Results
Full-length scRNA-seq improves data recovery
To determine if full-length scRNA-seq (Smart-seq2) offers significant advantages over 3'-based scRNA-seq, we used the same sorting strategy that we previously employed for 3'-based scRNA-seq of AGM cells.32 Briefly, we FACS isolated cell populations encompassing the EHT from Gfi1Tomato/Gfi1bGFP reporter mice21 (supplemental Figure 2A-B). The following E10.5 and E11.5 AGM populations were FACS isolated and sequenced using Smart-seq238,39: non-HE/endothelial cells (FACS-ENDOGfi1-het: CD41−CD45−TER119−CDH5+KIT−Gfi1:Tomato−Gfi1b:GFP-), HE (FACS-HEGfi1-het: CD41−CD45−TER119−CDH5+KIT-Gfi1:Tomato+Gfi1b:GFP−), cells undergoing EHT (FACS-EHTGfi1-het: CD41lowCD45−TER119−CDH5+KIT+Gfi1:Tomato+Gfi1b:GFP−), and IAHC (FACS-IAHCGfi1-het: CD41lowCD45−TER119−CDH5+KIT+Gfi1:Tomato+Gfi1b:GFP+) (Figure 1A; supplemental Figure 2C-D). A total of 456 cells were sequenced with a median depth of >1 million sequencing reads/cell with >90% mapping (supplemental Figure 3A). Compared with our previous 3'-study,32 we detected more genes (median: 5365 per cell vs 2498 per cell), lower dropout (median: 43% vs 76%), and increased coverage across transcripts (supplemental Figure 3B-D). This overall increased sensitivity is illustrated by the improved detection of Gfi1/1b transcripts (supplemental Figure 3E). Together, these data show that full-length scRNA-seq has clear benefits over 3'-based scRNA-seq.
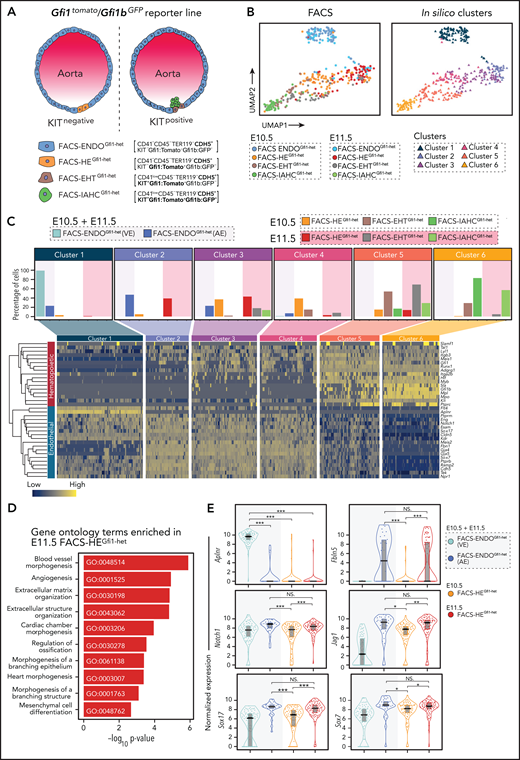
Distinct profile of E10.5 and E11.5 phenotypic HE. (A) Schematic representation of cell populations at different stages of EHT in dorsal aorta (DA) alongside corresponding phenotypic markers used for FACS single-cell sorting. (B) Uniform Manifold Approximation and Projection (UMAP) plots showing all the cells isolated from the E10.5 and E11.5 DA. FACS populations (left) and in silico clustering (right). (C) Top: Distribution of FACS-isolated populations in each cluster with background shaded according to the embryonic day of the samples. Bottom: Heat map illustrating the hematopoietic and endothelial gene expression profile of each cluster. Genes were clustered based on Pearson correlation, whereas the cells were grouped according to the clustering results. (D) Gene ontology (GO) analysis of genes upregulated in E11.5 FACS-HEGfi1-het compared with E10.5 FACS-HEGfi1-het. (E) Violin plot combined with box plot showing the normalized expression (log counts) of venous (Aplnr), arterial (Fbln5), and arterial fate promoting (Notch1, Jag1, Sox7, Sox17) genes in indicated populations. The shaded background behind the plot indicates the embryonic day origin of the cells. Medians are shown as a solid black line; gray boxes indicate the upper (75%) and lower (25%) percentile. *P < .05, **P < .01, ***P < .001 (2-tailed Student t test). NS, not significant.
Distinct profile of E10.5 and E11.5 phenotypic HE. (A) Schematic representation of cell populations at different stages of EHT in dorsal aorta (DA) alongside corresponding phenotypic markers used for FACS single-cell sorting. (B) Uniform Manifold Approximation and Projection (UMAP) plots showing all the cells isolated from the E10.5 and E11.5 DA. FACS populations (left) and in silico clustering (right). (C) Top: Distribution of FACS-isolated populations in each cluster with background shaded according to the embryonic day of the samples. Bottom: Heat map illustrating the hematopoietic and endothelial gene expression profile of each cluster. Genes were clustered based on Pearson correlation, whereas the cells were grouped according to the clustering results. (D) Gene ontology (GO) analysis of genes upregulated in E11.5 FACS-HEGfi1-het compared with E10.5 FACS-HEGfi1-het. (E) Violin plot combined with box plot showing the normalized expression (log counts) of venous (Aplnr), arterial (Fbln5), and arterial fate promoting (Notch1, Jag1, Sox7, Sox17) genes in indicated populations. The shaded background behind the plot indicates the embryonic day origin of the cells. Medians are shown as a solid black line; gray boxes indicate the upper (75%) and lower (25%) percentile. *P < .05, **P < .01, ***P < .001 (2-tailed Student t test). NS, not significant.
E10.5 and E11.5 phenotypic HE displays distinct transcriptional profiles
HE can be enriched by sorting cells coexpressing CDH5/VE-Cadherin and GFI1. Such double-positive cells are detected at a similar frequency in E10.5 and E11.5 AGMs.21 It is currently unclear if these phenotypically identical HE populations are transcriptionally identical. Uniform Manifold Approximation and Projection (UMAP)53 visualization of the sequenced FACS populations identified 6 robust clusters (C1-C6) (Figure 1B; supplemental Figure 4A-D; supplemental Table 2). C1, containing the bulk (71%) of the E10.5/E11.5 FACS-ENDOGfi1-het cells, clustered away from all other clusters and mainly consisted of cells with a venous endothelial transcriptome (Figure 1B; supplemental Figure 4E,F). FACS-ENDOGfi1-het cells with an arterial endothelial (AE) transcriptome resided in C2, which clustered closer to the EHT continuum (Figure 1B; supplemental Figure 4E,F).
FACS-HEGfi1-het cells contributed to 3 clusters (C2-C4) (Figure 1C) that likely represent HE cells entering EHT. They shared similar expression of endothelial genes (Cdh5, Kdr, Gja4), whereas expression of hematopoietic genes (Runx1, Itgb3, Myb) increased from C2 to C4 (supplemental Figure 4G). The majority of E10.5 FACS-HEGfi1-het was assigned to C3 and C4 and E11.5 FACS-HEGfi1-het was mainly assigned to C2 and C3 (Figure 1C). Gene ontology analysis of the differential expressed genes (DEGs) between E10.5 and E11.5 FACS-HEGfi1-het (supplemental Table 3) demonstrated that E11.5 FACS-HEGfi1-het was characterized by endothelial/vascular gene ontology terms (Figure 1D). Known markers/regulators of arterial fate (Notch1, Jag1, Sox7/17, Fbln5)54-58 were expressed higher in E11.5 FACS-HEGfi1-het vs E10.5 FACS-HEGfi1-het (Figure 1E). These data demonstrate that the phenotypically identical E10.5 and E11.5 FACS-HEGfi1-het are transcriptomically different. E10.5 FACS-HEGfi1-het cells display a robust hemogenic profile, whereas E11.5 FACS-HEGfi1-het has a more pronounced arterial identity.
Separation of E10.5 AGM cells into transcriptionally defined clusters
Having established that E10.5 FACS-HEGfi1-het possesses a strong hemogenic transcriptional profile, we next sought to create a detailed scRNA-seq dataset representing early EHT in the E10.5 DA. We focused on capturing different stages of HE differentiation. Therefore, we expanded our E10.5 panel of FACS populations with phenotypic endothelial and HE cells from both heterozygote and homozygote Runx1bRFP as well as homozygote Gfi1GFP/Gfi1bGFP reporter mice (FACS-ENDORunx1b-het, FACS-ENDORunx1b-KO, FACS-HERunx1b-het, FACS-HERunx1b-KO, and FACS-HEGfi1/1b-KO) (Figure 2A; supplemental Figures 2 and 5). The existence of a subpopulation of subaortic RUNX1+ mesenchymal cells has been reported previously,5,22,24 but their exact identity remains unknown. Therefore, we isolated FACS-mesenchyme (FACS-MES: CD41−CD45−TER119−CDH5−KIT−Runx1b:RFP+) cells from both heterozygote and homozygote Runx1bRFP reporter embryos (Figure 2A; supplemental Figure 5B,C).
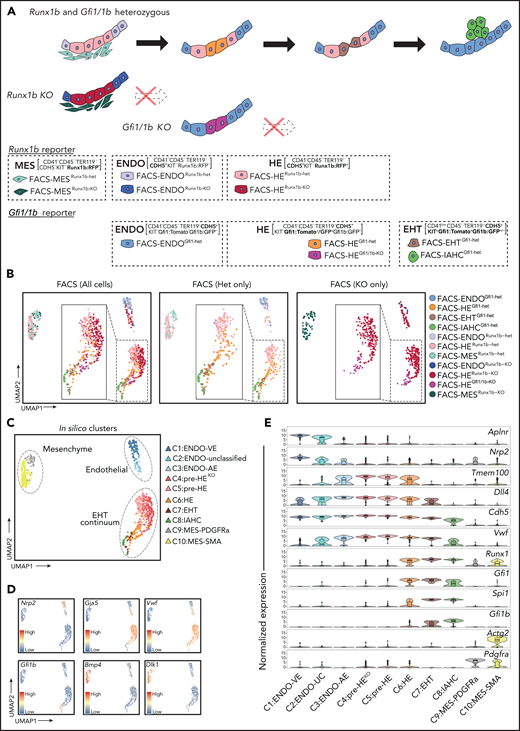
A single-cell resolution atlas of E10.5 AGM. (A) Schematic representation of FACS populations based on Runx1bRFP, Gfi1tomato/Gfi1bGFP, and Gfi1GFP/Gfi1bGFP reporter mouse models. Cells isolated from Runx1bRFP reporter include FACS-MESRunx1b-het (CD41−CD45−TER119−CDH5−KIT−Runx1b:RFP+), FACS-ENDORunx1b-het (CD41−CD45−TER119−CDH5+KIT−Runx1b:RFP-), and FACS-HERunx1b-het (CD41−CD45−TER119−CDH5+KIT−Runx1b:RFP+). Cells isolated from Runx1bKO include FACS-MESRunx1b-KO (CD41−CD45−TER119−CDH5−KIT−Runx1b:RFP+), FACS-ENDORunx1b-KO (CD41−CD45−TER119−CDH5+KIT−Runx1b:RFP−), and FACS-HERunx1b-KO (CD41−CD45−TER119−CDH5+KIT−Runx1b:RFP+). Cells isolated from Gfi1tomato/Gfi1bGFP are as described in Figure 1A. FACS-HEGfi1/1b-KO (CD41−CD45−TER119−CDH5+KIT−Gfi1:GFP+) was isolated from Gfi1GFP/Gfi1bGFP reporter. (B) Uniform Manifold Approximation and Projection (UMAP) plots showing all cells (left), heterozygote cells only (middle), and KO cells only (right). Cells are colored by FACS populations. (C) Two-dimensional UMAP with cells colored by in silico clustering. (D) Expression of venous endothelial (Nrp2), arterial endothelial (Gja5, Vwf), hematopoietic (Gfi1b), and mesenchymal (Bmp4, Dlk1) genes in the UMAP plot. (E) Violin plots combined with box and whisker plots showing the normalized expression (logcounts) of indicated genes in each cluster. The color coding is identical to panel C. Medians are shown as a solid black line; boxes indicate the upper (75%) and lower (25%) percentile; whiskers indicate ±1.5 times the interquartile range (IQR). Outliers (values > or <1.5 IQR) are shown as dots. AE, arterial endothelial; EHT, endothelial-to-hematopoietic transition; ENDO, endothelial; HE, hemogenic endothelium; IAHC, intra-aortic hematopoietic clusters; UC, unclassified; VE, venous endothelial.
A single-cell resolution atlas of E10.5 AGM. (A) Schematic representation of FACS populations based on Runx1bRFP, Gfi1tomato/Gfi1bGFP, and Gfi1GFP/Gfi1bGFP reporter mouse models. Cells isolated from Runx1bRFP reporter include FACS-MESRunx1b-het (CD41−CD45−TER119−CDH5−KIT−Runx1b:RFP+), FACS-ENDORunx1b-het (CD41−CD45−TER119−CDH5+KIT−Runx1b:RFP-), and FACS-HERunx1b-het (CD41−CD45−TER119−CDH5+KIT−Runx1b:RFP+). Cells isolated from Runx1bKO include FACS-MESRunx1b-KO (CD41−CD45−TER119−CDH5−KIT−Runx1b:RFP+), FACS-ENDORunx1b-KO (CD41−CD45−TER119−CDH5+KIT−Runx1b:RFP−), and FACS-HERunx1b-KO (CD41−CD45−TER119−CDH5+KIT−Runx1b:RFP+). Cells isolated from Gfi1tomato/Gfi1bGFP are as described in Figure 1A. FACS-HEGfi1/1b-KO (CD41−CD45−TER119−CDH5+KIT−Gfi1:GFP+) was isolated from Gfi1GFP/Gfi1bGFP reporter. (B) Uniform Manifold Approximation and Projection (UMAP) plots showing all cells (left), heterozygote cells only (middle), and KO cells only (right). Cells are colored by FACS populations. (C) Two-dimensional UMAP with cells colored by in silico clustering. (D) Expression of venous endothelial (Nrp2), arterial endothelial (Gja5, Vwf), hematopoietic (Gfi1b), and mesenchymal (Bmp4, Dlk1) genes in the UMAP plot. (E) Violin plots combined with box and whisker plots showing the normalized expression (logcounts) of indicated genes in each cluster. The color coding is identical to panel C. Medians are shown as a solid black line; boxes indicate the upper (75%) and lower (25%) percentile; whiskers indicate ±1.5 times the interquartile range (IQR). Outliers (values > or <1.5 IQR) are shown as dots. AE, arterial endothelial; EHT, endothelial-to-hematopoietic transition; ENDO, endothelial; HE, hemogenic endothelium; IAHC, intra-aortic hematopoietic clusters; UC, unclassified; VE, venous endothelial.
In HE, the Runx1b isoform precedes the expression of Gfi121 and both genes are essential for the initiation of EHT.8,15,21 To illustrate this developmental relationship between RUNX1 and GFI1, we isolated phenotypic Runx1b:RFP+Gfi1:GFP− E10.5 AGM HE (CD41−CD45−TER119−CDH5+KIT−Runx1b:RFP+Gfi1:GFP−) from Runx1bRFP/Gfi1GFP reporter embryos. Following 24 hours of aggregation culture, the Runx1b:RFP+Gfi1:GFP− HE gave rise to Runx1b:RFP+Gfi1:GFP+ HE and progenitors (supplemental Figure 6).
UMAP visualization of the sequenced FACS populations (Figure 2B) demonstrated that FACS-ENDO populations from different reporter models (FACS-ENDORunx1b-het, FACS-ENDORunx1b-KO, and FACS-ENDOGfi1-het) clustered together, indicating that batch effects were negligible (supplemental Figure 7A). We identified 3 distinct groups of robust clusters (Figure 2C), which we annotated based on marker gene expression and correlation to the FACS populations (Figure 2C-E; supplemental Figures 7 and 8; supplemental Table 4): 3 endothelial clusters (C1:ENDO-VE, C2:ENDO-unclassified, C3:ENDO-AE), 5 clusters encompassing the EHT-continuum (C4-C6:HE, C7:EHT, C8:IAHC), and 2 mesenchymal (MES) clusters (C9:MES-PDGFRa, C10:MES-SMA). Surprisingly some FACS-HERunx1b-het, with lower levels of CDH5, were assigned to C10:MES-SMA (supplemental Figure 9A). Subsequent immunofluorescence and FACS analyses confirmed that in the E10.5 AGM, a small proportion of the smooth muscle cell population is CDH5+ (supplemental Figure 9B-F).
Zhu et al have recently described an AGM pre-HE population.34 To determine if pre-HE is present in our dataset, we investigated to what extent our data correlate with the Zhu study (supplemental Figure 10). Overall, the 3 groups of clusters (Endo:C1-C3, HE-IAHC:C4-C8, MES:C9-10) correlated well with the equivalent groups in the Zhu data set. However, within the HE-IAHC group (C4-C8), there were notable differences with regard to cluster classification. We found that the HE cluster identified by Zhu et al is highly similar to C7:EHT in our dataset. The majority of cells in C7 express high amounts of CD41 (Itga2b), CD61 (Itgb3), Kit, and Gfi1b while also demonstrating a marked reduction (vs C4-C6) in the expression levels of endothelial genes including Kdr, Pecam1, Tmem100, and Cdh5 (supplemental Figure 8C). A substantial fraction of C7 originates from FACS-EHTGfi1-het (70%) and FACS-IAHCGfi1-het (19%) (supplemental Figure 8B). As such, the cells in C7 are no longer embedded in the endothelial lining of the AGM and are actively undergoing EHT and cannot be classified as HE. C6 mainly consists of FACS-HEGfi1 cell (81%; supplemental Figure 8B), displays low/absent expression of Itga2b, Itgb3, Kit, and Gfi1b and expresses high levels of endothelial transcripts (supplemental Figure 8C). This phenotype corresponds to HE cells that are embedded in the DA endothelial lining and do not yet show morphological changes indicative of EHT. Therefore, we designated the clusters in the EHT continuum as follows: C4:pre-HE Runx1KO (pre-HEKO), C5:pre-HE, C6:HE, C7:EHT, and C8:IAHC (Figure 2C).
Surprisingly, Runx1 transcripts were only detected in a small fraction (7.4%) of the FACS-HERunx1b-het cells in C5:pre-HE (supplemental Figure 11A), suggesting a poor correlation between Runx1b:RFP reporter and Runx1 expression and/or a low scRNA-seq Runx1 detection sensitivity. Immunofluorescent staining of E10.5 Runx1bRFP AGM sections for RFP and RUNX1 proteins demonstrated a good correlation in the DA (78% of RFP+ are RUNX1+, 81% of RUNX1+ are RFP+; supplemental Figure 11B,C). This indicates that even the full-length sequencing protocol is not sensitive enough to robustly detect low levels of Runx1 transcripts in the C5:pre-HE population.
Trajectory analysis of E10.5 EHT uncovers a detailed HE maturation continuum
To identify changes associated with HE differentiation, we focused on clusters C4 through C8, which cover the continuum from pre-HE cells to IAHC. Unlike the Runx1bKO pre-HE, which clustered separately from their Runx1bhet counterparts (Figure 2B,C; C4:pre-HEKO, C5:pre-HE), both the Gfi1/1bKO and Gfi1het HE populated the same cluster (Figure 2B,C; C6:HE). Therefore, we subdivided cluster C6 based on the Gfi1 genotype (C6:HEKO and C6:HE) before inferring a developmental trajectory (Figure 3A,B). As expected, endothelial transcripts (Cdh5, Kdr, Pecam1) decreased across the developmental trajectory, whereas hematopoietic transcripts (Gfi1, Mpo, Gfi1b) increased (supplemental Figure 12A). Although the pre-HE clusters (C4 and C5) did not cluster together with the endothelial clusters (C1-C3), they still displayed robust arterial gene expression (Vwf, Bmx, Hey2, and Jag1) (supplemental Figure 8C). This is expected because the cells in these clusters do not express significant amounts of Gfi1, which is instrumental for initiating the downregulation of the endothelial program.20,21 In both Runx1KO and Gfi1/1bKO mice, IAHC are absent21,22,59 and development arrests before EHT (C7). This is illustrated by the absence of KIT+ cells in E10.5 AGMs (supplemental Figure 12B,C). Interestingly, the KO clusters (C4:pre-HEKO, C6:HEKO) sit at different points in the pseudotime trajectory, illustrating that they are arrested at different pre-EHT stages. C4:pre-HEKO sits within the EHT continuum, whereas C6:HEKO seems to divert away from this trajectory (Figure 3A; supplemental Figure 12D). Altogether, these data show that we captured a detailed HE differentiation trajectory.
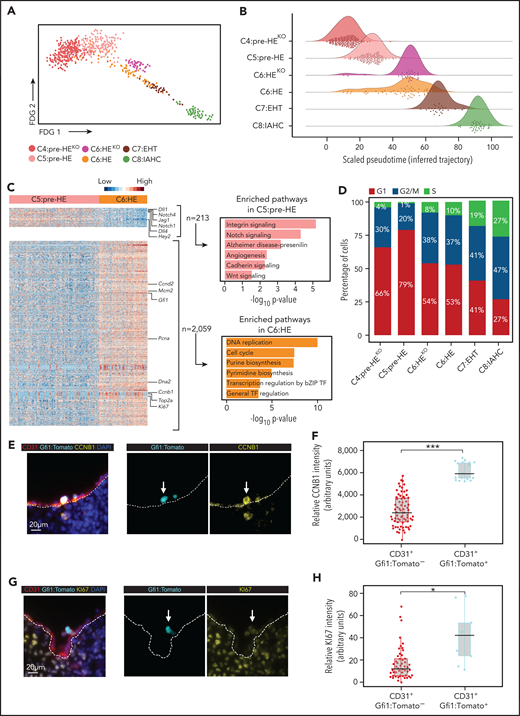
Cell-cycle progression is initiated before IAHC formation. (A) Force directed graph (FDG) visualization of all cells in the EHT continuum. (B) Density plot showing the distribution of cells across inferred trajectory (pseudotime: scaled from 0 to 100). (C) Left: Heatmap illustrating the differentially expressed genes (DEGs) between the heterozygous cells in C5:pre-HE and C6:HE based on 1.4 Log2 fold change and false discovery rate <0.05. Right: Panther pathway analysis of the upregulated genes in each cluster. (D) Distribution of the cell-cycle phase in indicated clusters. (E,G) A magnified image of immunofluorescent staining on frozen E10.5 dorsal aorta sections for CD31 (red), Gfi1:Tomato (cyan), and CCNB1 (E, yellow) or KI67 (G, yellow). (F,H) Quantification of CCNB1 (F) and KI67 (H) signal intensity in CD31 endothelial cells lining the entire dorsal aorta. Individual cells and medians are shown; gray boxes indicate the upper (75%) and lower (25%) percentile; whiskers indicate ±1.5 times the interquartile range (IQR). Two-tailed t test. *P < .05, ***P < .001.
Cell-cycle progression is initiated before IAHC formation. (A) Force directed graph (FDG) visualization of all cells in the EHT continuum. (B) Density plot showing the distribution of cells across inferred trajectory (pseudotime: scaled from 0 to 100). (C) Left: Heatmap illustrating the differentially expressed genes (DEGs) between the heterozygous cells in C5:pre-HE and C6:HE based on 1.4 Log2 fold change and false discovery rate <0.05. Right: Panther pathway analysis of the upregulated genes in each cluster. (D) Distribution of the cell-cycle phase in indicated clusters. (E,G) A magnified image of immunofluorescent staining on frozen E10.5 dorsal aorta sections for CD31 (red), Gfi1:Tomato (cyan), and CCNB1 (E, yellow) or KI67 (G, yellow). (F,H) Quantification of CCNB1 (F) and KI67 (H) signal intensity in CD31 endothelial cells lining the entire dorsal aorta. Individual cells and medians are shown; gray boxes indicate the upper (75%) and lower (25%) percentile; whiskers indicate ±1.5 times the interquartile range (IQR). Two-tailed t test. *P < .05, ***P < .001.
Pre-HSC-like gene signatures can be detected in HE
AGM IAHC contain cells with different differentiation signatures such as myeloid cells, pre-HSCs, and HSCs.11,32,34,60-62 To determine if a similar heterogeneity is present in HE, we screened the EHT continuum (C4-C8) for the presence of the following gene signatures: arterial,63 erythroid-myeloid progenitors,64 lymphoid-myeloid progenitors,65 pre-HSCs,31 and HSCs66 (supplemental Figure 13; supplemental Table 5). Within C8:IAHC, positive cells for all 4 hematopoietic signatures could be detected in a mutually exclusive way. Pre-HSC and HSC signatures could be detected in C7:EHT, whereas in C6:HE, only the pre-HSC signature could be discerned.
Cell-cycle status differentiates pre-HE from HE
Next, we sought to identify what distinguishes pre-HE from HE. To characterize changes relevant to normal HE progression, we excluded Runx1KO and Gfi1/1bKO cells and examined transcriptomic differences between C5:pre-HE and C6:HE. We identified 2272 DEGs with the majority upregulated in C6:HE (Figure 3C; supplemental Table 6). Pathways associated with AE identity were enriched in C5:pre-HE. These included integrin and cadherin signaling, which are important for cell–cell and cell–matrix interactions,67,68 and Notch and Wnt signaling, which both need to be downregulated to drive EHT forward.69-71 Strikingly, the upregulated genes in C6:HE were dominated by cell cycle-related pathways. We, therefore, analyzed the cell-cycle status of all clusters (C4-C8), including the KO cells. In line with previous findings, most C8:IAHC cells were in the G2/M or S phase72 (Figure 3D; supplemental Figure 13C). However, an increase in cycling cells could already be detected in C6:HE. Interestingly, C6:HEKO phenocopies its C6:HE heterozygous counterpart with regard to cell-cycle status (Figure 3D). We confirmed these results by immunofluorescence analysis of CCNB1 (marking G2/M)73 and KI67 (marking G1, S, G2/M)74 in E10.5 Gfi1-reporter embryos. CD31+Gfi1:Tomato+ expressed higher levels of CCNB1 and KI67 relative to CD31+Gfi1:Tomato− AE in the DA (Figure 3E-H). Similarly, we observed increased entry into the cell cycle at the late stages of HE differentiation upon in vitro hematopoietic differentiation of fluorescent, ubiquitination-based cell-cycle indicator mouse embryonic stem cells75 (supplemental Figure 13D). Together, these results indicate that as HE cells get closer to EHT, they start downregulating their arterial identity while entering the cell cycle. The latter does not appear to rely on GFI1.
ACE: a novel HE cell-surface enrichment marker
Currently, HE isolation is heavily reliant on transgenic reporter models.21,23,33,35,76-78 To identify HE cell-surface markers, for use in a wild-type context, we compared each cluster along the EHT trajectory to C3:ENDO-AE (supplemental Table 7). The resulting list of surface markers was screened for no/low expression in C1:ENDO-VE and antibody availability.
Neurl3 expression was observed in C6:HE-C8:IAHC, whereas CD27 and Flt3/CD135 were highly expressed in C8:IAHC. Neurl3 is a recently identified HE/pre-HSC marker,33CD27 has been shown to mark pre-HSC/HSC,79 and Flt3 marks early hematopoietic progenitors.80,81CD44, Procr/CD201, and Ace/CD143 were highly expressed in the pre-HE and HE populations (Figure 4A). Both CD44 and Procr were expressed throughout the AGM CDH5+ population from C1:ENDO-VE to C8:IAHC. In contrast, Ace was mainly restricted to the pre-HE to HE continuum (C4-C6), in particular to the pre-HE clusters (C4-C5). The Runx1bKO (C4:pre-HEKO) and Gfi1/1bKO HE (C6:HEKO) showed comparable Ace expression levels to their EHT competent counterparts (C5:pre-HE and C6:HE). Unlike CD4482 and PROCR,31 ACE has not been previously identified as a murine HE marker; therefore, we analyzed it further. Immunofluorescence for ACE on E10.5 AGM sections correlated well with the scRNA-seq data. ACE expression was exclusively seen in CD31+ DA cells within the AGM (Figure 4B), including the RUNX1+ and Gfi1:Tomato+ subsets (Figure 4C; supplemental Figure 14A) embedded within the CD31+ lining (likely HE). In contrast, CD31+ cells budding into the DA lumen (likely IAHC) showed reduced/absent ACE staining. Overall, we found that on average 27% of the CD31+ cells within the E10.5 DA lining coexpressed ACE (Figure 4B). We observed a similar ACE expression pattern in the E10.5 vitelline artery (supplemental Figure 14B), another known site of hematopoietic emergence.13,83 Next, we assessed the ability of ACE to enrich for Gfi1:Tomato+ AGM HE cells from the Gfi1Tomato/Gfi1bGFP transgenic reporter. In line with the scRNA-seq, ACE marked a smaller subpopulation of the LIN−KIT−CDH5+ cells compared with CD44 (supplemental Figure 15A-C). Consequently, gating on LIN−KIT−CDH5+ACE+ cells resulted in an improved enrichment of Gfi1:GFP+ cells compared with both LIN−KIT−CDH5+ and LIN−KIT−CDH5+CD44+ gating (Figure 4D).
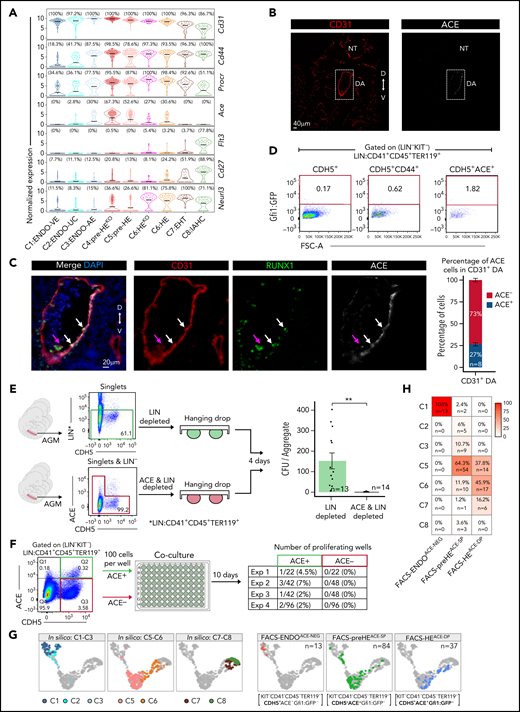
ACE (CD143) is an HE enrichment marker. (A) Violin plots showing the expression of shortlisted cell surface markers. Cd31 expression is shown for reference. The mean expression is indicated by the horizontal black line. The percentage of cells with non-zero expression (read count >0) is shown above each plot. (B) Representative immunofluorescence (IF) staining of formalin-fixed paraffin-embedded (FFPE) sections of E10.5 embryo sections for CD31 (red) and ACE (gray). D, dorsal; DA, dorsal aorta; NT, neural tube; V, ventral. (C) Left: IF staining of E10.5 AGM FFPE sections in panel B. CD31 (red), RUNX1 (green), and ACE (gray). Example IAHC cells are indicated with magenta arrow. White arrows indicate example RUNX1+ cells in the lining of the aorta. Right: Percentage of ACE+ cells in CD31+ E10.5 DA. (D) FACS plots showing the enrichment of E10.5 HE with CDH5+ alone (left), CDH5 and CD44 (middle), CDH5 and ACE (right). (E) Experimental design of hanging drop reaggregation AGM cultures with LIN (CD41+CD45+TER119+) depleted or LIN and ACE (LIN−CDH5+ACE+) depleted cells. CFU assays were performed after 4 days of culture. The numbers of replicates are indicated at the bottom of each column. Two-tailed Student t test was used to assess statistical significance. Error bars represent SEM. **P < .01. (F) Numbers of wells with proliferating cells following 10 days of coculture of FACS sorted LIN−KIT−CDH5+ACE+ or LIN−KIT−CDH5+ACE− cells (100 cells/well) on vascular niche cells. Exp, experiment. (G) UMAP computed from integrating cells from cluster C1-C8 (excluding KO cells and KO clusters) with scRNA-seq data obtained from sorted ACE+ and ACE− E10.5 AGM cells. Left: UMAP representation of the previously determined in silico clusters C1-C8 from Figure 2C (excluding KO cells and KO clusters). Right: scRNA-seq data obtained from sequencing ACE+ and ACE− cells. (H) Heatmap displaying the percentage of cells from the ACE scRNA-seq data mapped to the in silico clusters based on k-nearest-neighbor classifier approach. AE, arterial endothelial; EHT, endothelial-to-hematopoietic transition; ENDO, endothelial; HE, hemogenic endothelium; IAHC, intra-aortic hematopoietic clusters; UC, unclassified; VE, venous endothelial.
ACE (CD143) is an HE enrichment marker. (A) Violin plots showing the expression of shortlisted cell surface markers. Cd31 expression is shown for reference. The mean expression is indicated by the horizontal black line. The percentage of cells with non-zero expression (read count >0) is shown above each plot. (B) Representative immunofluorescence (IF) staining of formalin-fixed paraffin-embedded (FFPE) sections of E10.5 embryo sections for CD31 (red) and ACE (gray). D, dorsal; DA, dorsal aorta; NT, neural tube; V, ventral. (C) Left: IF staining of E10.5 AGM FFPE sections in panel B. CD31 (red), RUNX1 (green), and ACE (gray). Example IAHC cells are indicated with magenta arrow. White arrows indicate example RUNX1+ cells in the lining of the aorta. Right: Percentage of ACE+ cells in CD31+ E10.5 DA. (D) FACS plots showing the enrichment of E10.5 HE with CDH5+ alone (left), CDH5 and CD44 (middle), CDH5 and ACE (right). (E) Experimental design of hanging drop reaggregation AGM cultures with LIN (CD41+CD45+TER119+) depleted or LIN and ACE (LIN−CDH5+ACE+) depleted cells. CFU assays were performed after 4 days of culture. The numbers of replicates are indicated at the bottom of each column. Two-tailed Student t test was used to assess statistical significance. Error bars represent SEM. **P < .01. (F) Numbers of wells with proliferating cells following 10 days of coculture of FACS sorted LIN−KIT−CDH5+ACE+ or LIN−KIT−CDH5+ACE− cells (100 cells/well) on vascular niche cells. Exp, experiment. (G) UMAP computed from integrating cells from cluster C1-C8 (excluding KO cells and KO clusters) with scRNA-seq data obtained from sorted ACE+ and ACE− E10.5 AGM cells. Left: UMAP representation of the previously determined in silico clusters C1-C8 from Figure 2C (excluding KO cells and KO clusters). Right: scRNA-seq data obtained from sequencing ACE+ and ACE− cells. (H) Heatmap displaying the percentage of cells from the ACE scRNA-seq data mapped to the in silico clusters based on k-nearest-neighbor classifier approach. AE, arterial endothelial; EHT, endothelial-to-hematopoietic transition; ENDO, endothelial; HE, hemogenic endothelium; IAHC, intra-aortic hematopoietic clusters; UC, unclassified; VE, venous endothelial.
To confirm hemogenic activity within LIN−CDH5+ACE+ AGM cells, we first performed ACE depletion assays. LIN− (CD41−CD45−TER119−) E10.5 AGMs depleted, or not, of CDH5+ACE+ cells were matured as aggregates before being analyzed in CFU assays (Figure 4E). Robust colony formation was observed from the majority of the LIN− aggregates (n = 13 AGMs). In contrast, LIN−ACE− aggregates (n = 14 AGMs) did not contain CFU activity. Next, we FACS isolated LIN−CDH5+KIT−ACE+ and LIN−CDH5+KIT−ACE− cells from E10.5 AGMs and cocultured them (100 cells/well) on vascular niche cells.44,45 Hematopoietic activity was only observed in the ACE+ group (n = 4; Figure 4F). Finally, we performed scRNA-seq on FACS E10.5 AGM ACE+ (FACS-preHEACE-SP: CD41−CD45−TER119−CDH5+KIT−ACE+Gfi1:GFP− and FACS-HEACE-DP: CD41−CD45−TER119−CDH5+KIT−ACE+Gfi1:GFP+), and ACE− (FACS-ENDOACE-NEG: CD41−CD45−TER119−CDH5+KIT−ACE−Gfi1:GFP−) cells and projected the data on our existing E10.5 EHT UMAP (Figure 4G; supplemental Figure 15D,E). A total of 78.5% of all ACE+ sorted cells (n = 121, FACS-preHEACE-SP and FACS-HEACE-DP) clustered within the HE continuum (56.2% in C5:pre-HE, 22.3% in C6:HE). The remaining 21.5% populated C1 (1.7%), C2-C3 (11.5%), and C7-C8 (8.3%). FACS-preHEACE-SP predominantly clustered within C5:pre-HE (64.3%), whereas FACS-HEACE-DP mainly clustered within C6:HE (45.9%; Figure 4H). Altogether these results indicate that ACE can be used to enrich functional pre-HE and HE in lieu of transgenic reporters. Notably, Ace was not detected in our previous 3'-based scRNA-seq study,32 nor in the recent Zhu et al study34 (supplemental Figure 15F), further highlighting the higher gene detection rate in our study.
RUNX1+ mesenchymal cells support AGM hematopoiesis
Currently, little is known about the subpopulation of mesenchymal cells in the AGM that express the hematopoietic master regulator Runx1. To determine their potential role in hematopoiesis, we performed aggregation cultures and CFU assays with FACS CD45−TER119−CDH5− depleted, or not, of Runx1b:RFP+ E10.5 AGM cells (Figure 5A). Depletion of Runx1b:RFP+ mesenchymal cells resulted in a more than five-fold decrease in CFU potential (n = 7). These results indicate that Runx1b:RFP+ mesenchyme positively influences hematopoiesis.
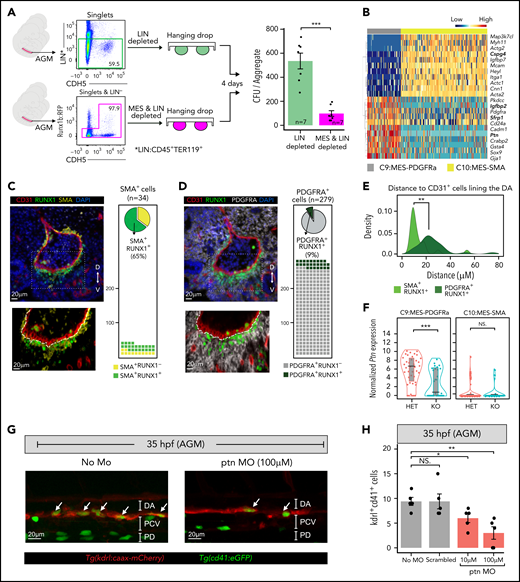
Identification of 2 different RUNX1 subpopulations in the subaortic mesenchyme. (A) Left: experimental design of E10.5 AGM hanging drop reaggregation cultures with LIN (CD45+TER119+) depleted, or LIN and MES (LIN−CDH5+Runx1b:RFP+) depleted cells. CFU assays were performed after 4 days of culture. Right: Bar graph depicting average colony number ± SEM. The number of assayed AGMs are indicated in the bars. ***P < .001 (2-taild Student t test). (B) Heatmap illustrating the top differentially expressed genes between the C9:MES-PDGFRa and C10:MES-SMA. Genes are clustered based on Pearson correlation and cells are grouped based on the in silico clusters. Genes coding for secreted proteins are highlighted in bold. (C-D) Top left: immunofluorescence (IF) staining of formalin-fixed paraffin-embedded (FFPE) E10.5 AGM sections for CD31 (red), RUNX1 (green) and SMA (yellow, C), or PDGFRA (gray, D). DA, dorsal aorta. Bottom left: ×100 magnification of the boxed region in the top panel. Right: quantification of SMA (C) and PDGFRA (D) positive cells within the top field of view. (E) Density plot depicting the distance of RUNX1+SMA+ and RUNX1+PDGFRA+ cells in relation to the endothelial (CD31+) cells lining the DA. (F) Violin plot combined with box plot showing the normalized expression (logcounts) of Pleiotrophin (Ptn) in Runx1 heterozygous (HET, Runx1bRFP/WT) or Runx1 knockout (KO, Runx1bRFP/RFP) C9 and C10 clusters. Medians are shown as a solid black line, gray boxes indicate the upper (75%) and lower (25%) percentile. (G) Representative 35 hpf confocal images of no morpholino control and ptn morpholino treated (100 μM) Tg(cd41:eGFP//kdrl:caax:mCherry) zebrafish embryos. Emerging HSPC (cd41, kdr double-positive cells) in the 35 hpf AGM are indicated with white arrows. (H) Quantification of the emerging HSPC (kdrl+cd41+) in the 35 hpf AGM of embryos treated with no morpholino (no MO), control scrambled morpholino (100 μM), and ptn morpholino (10 and 100 μM). Individual fish (dots) and mean ± SEM are shown. *P < .05, **P < .01 (2-tailed, unpaired Student t test). NS, not significant; SEM, standard error of the mean.
Identification of 2 different RUNX1 subpopulations in the subaortic mesenchyme. (A) Left: experimental design of E10.5 AGM hanging drop reaggregation cultures with LIN (CD45+TER119+) depleted, or LIN and MES (LIN−CDH5+Runx1b:RFP+) depleted cells. CFU assays were performed after 4 days of culture. Right: Bar graph depicting average colony number ± SEM. The number of assayed AGMs are indicated in the bars. ***P < .001 (2-taild Student t test). (B) Heatmap illustrating the top differentially expressed genes between the C9:MES-PDGFRa and C10:MES-SMA. Genes are clustered based on Pearson correlation and cells are grouped based on the in silico clusters. Genes coding for secreted proteins are highlighted in bold. (C-D) Top left: immunofluorescence (IF) staining of formalin-fixed paraffin-embedded (FFPE) E10.5 AGM sections for CD31 (red), RUNX1 (green) and SMA (yellow, C), or PDGFRA (gray, D). DA, dorsal aorta. Bottom left: ×100 magnification of the boxed region in the top panel. Right: quantification of SMA (C) and PDGFRA (D) positive cells within the top field of view. (E) Density plot depicting the distance of RUNX1+SMA+ and RUNX1+PDGFRA+ cells in relation to the endothelial (CD31+) cells lining the DA. (F) Violin plot combined with box plot showing the normalized expression (logcounts) of Pleiotrophin (Ptn) in Runx1 heterozygous (HET, Runx1bRFP/WT) or Runx1 knockout (KO, Runx1bRFP/RFP) C9 and C10 clusters. Medians are shown as a solid black line, gray boxes indicate the upper (75%) and lower (25%) percentile. (G) Representative 35 hpf confocal images of no morpholino control and ptn morpholino treated (100 μM) Tg(cd41:eGFP//kdrl:caax:mCherry) zebrafish embryos. Emerging HSPC (cd41, kdr double-positive cells) in the 35 hpf AGM are indicated with white arrows. (H) Quantification of the emerging HSPC (kdrl+cd41+) in the 35 hpf AGM of embryos treated with no morpholino (no MO), control scrambled morpholino (100 μM), and ptn morpholino (10 and 100 μM). Individual fish (dots) and mean ± SEM are shown. *P < .05, **P < .01 (2-tailed, unpaired Student t test). NS, not significant; SEM, standard error of the mean.
RUNX1+ subaortic cells contribute to the smooth muscle lineage and PDGFRa mesenchyme
The scRNA-seq analysis revealed 2 distinct Runx1b:RFP+ mesenchymal clusters (C9:MES-PDGFRa, C10:MES-SMA; Figure 2C-E), which contributed equally to the total Runx1+ mesenchymal population (supplemental Figure 16A). Upon Runx1b knockout (KO), the distribution shifted toward C10 (supplemental Figure 16A). Index FACS and scRNA-seq data revealed that in C9:MES-PDGFRa, the Runx1bRFP locus is less active than in C10:MES-SMA (supplemental Figure 16B).
DEG analysis of all the upregulated genes in the mesenchymal clusters in comparison with the other clusters (C9-C10 vs C1-C8) indicated that most of these genes were either specifically upregulated in C10 (48%) or upregulated in both C9:MES-PDGFRa and C10:MES-SMA (49%) (supplemental Figure 16C; supplemental Table 8). Enrichment analysis of the latter indicated a general mesenchymal identity, whereas analyses of the C10:MES-SMA upregulated genes suggested a smooth muscle cell identity (supplemental Figure 16D; supplemental Table 9). Only a small number of genes (n = 13), including Pdgfra, was upregulated specifically in C9:MES-PDGFRa.
The smooth muscle cell identity of C10 was further supported by gene set enrichment analysis (GSEA), showing a strong enrichment for “actin” and “smooth muscle” related pathways with high expression of Actg2, Acta2, Cnn1, and Mcam/CD146 (Figure 5B; supplemental Figure 16E,F). SMA (Figure 5C) and MCAM (supplemental Figure 16G) immunofluorescence showed that RUNX1+ smooth muscle cells were predominantly detected on the ventral side of the DA below the CD31+ endothelium. We also observed a thickening of the SMA and RFP layer around the DA in Runx1bKO sections (supplemental Figure 17A,B). GSEA revealed ribosomal transcripts to be enriched in C10Runx1b-KO vs C10Runx1b-het (supplemental Figure 17C). Subsequent screening of publicly available RUNX1 binding data84-88 suggests that at least some of these ribosomal genes (11/66) can be directly bound by RUNX1 (supplemental Table 10), as previously reported.89-91 Unbiased clustering on C10 revealed 2 subclusters (C10-A and C10-B; supplemental Figure 17D). C10-A consisted of both Runx1bhet (41%) and Runx1bKO (59%) cells, whereas C10-B predominantly harbored Runx1bhet cells (94%). Interestingly, most of the Runx1bKO cells (92%) are contained in C10-A. GSEA demonstrates enrichment of gene sets related to proliferation (MYC targets, mTOR signaling) in C10-A, whereas gene sets related to muscle cell identity/physiology are enriched in C10-B (supplemental Figure 17E). Hence, the C10Runx1b-KO cells appear to preferentially possess a gene expression profile compatible with an increased proliferation capacity. This could explain the higher number of subaortic RUNX1+ cells observed in Runx1-deficient embryos.
C9:MES-PDGFRa did not present a specific identity apart from the absence of smooth muscle cell characteristics (Figure 5B; supplemental Figure 16D). Spatially, the cells in C9:MES-PDGFRa resided below the smooth muscle layer and, like C10:MES-SMA, the C9:RUNX1+PDGFRA+ cells were predominantly detected on the ventral side of the DA (Figure 5C-E). DEG analysis between C9Runx1b-KO and C9Runx1b-het did not identify significantly enriched gene sets. This was reflected in clustering analysis that revealed no obvious subclusters in C9 (supplemental Figure 17F). However, we did observe that Ptn (Pleiotrophin) expression was not only significantly upregulated in C9 as a whole, but the highest expression was seen in C9Runx1b-het (Figure 5F). RUNX1 binding analysis using published data84-88 revealed the Ptn locus as a potential direct RUNX1 target (supplemental Table 11). PTN has been implicated in HSC self-renewal and retention in the bone marrow vascular niche.92 To determine if PTN can play a role during AGM hematopoietic ontogeny, we performed ptn knockdown experiments in developing zebrafish. ptn knockdown resulted in a substantial decrease of emerging hematopoietic cells (kdrl+cd41+) in the DA at the 35 hours post fertilization (hpf) stage followed by a significant reduction of hematopoietic stem and progenitor cells (HSPCs) in the caudal hematopoietic tissue at 55 hpf (Figure 5G,H; supplemental Figure 18). This indicates that PTN can play a role in the DA EHT. Together, these results reveal the identity of the RUNX1+ subaortic cells as smooth muscle cells and PDGFRa mesenchyme.
Discussion
Unraveling the molecular programs driving HSC formation during embryogenesis would be invaluable for developing protocols supporting in vitro generation and amplification of HSC to treat blood malignancies.1,2 Here, we present a high-resolution scRNA-seq dataset that encompasses sequential stages of blood formation in the mouse AGM region at the time of HSC formation. We focused on in-depth profiling of HE development and RUNX1B mesenchyme by analyzing FACS populations from Runx1 and Gfi1/1b reporter mouse models.
By combining full-length scRNA-seq with the functional and phenotypic characterization of the sequenced FACS populations, we were able to precisely stage E10.5 pre-HE and HE populations within the EHT continuum. These assignments differ from those previously published.34 Our data indicate that cells previously labeled as HE are more mature EHT cells and that cells previously labeled as pre-HE consist of both pre-HE and HE. The reassignment of HE cells to cells undergoing EHT suggests that the previously described differentiation bottleneck34 between pre-HE and HE could actually be a threshold between HE and the initiation of hematopoietic commitment (EHT). Our transcriptomic analyses also demonstrated that E11.5 HE has a strongly reduced hemogenic profile and is consequently less equipped to clear a potential bottleneck between HE and EHT. This unifies the seemingly contradictory observations that the AGM HE activity peaks around E10.5,93 whereas the frequency of phenotypic hemogenic endothelium (LIN−CDH5+Gfi1:Tomato+) is similar in the E10.5 and E11.5 AGM.21
We also found cell-cycle status to be a distinguishing feature between pre-HE and HE and identified ACE as an enrichment marker for both populations. We uncovered that Ace transcript expression is mainly restricted to pre-HE/HE and compares favorably to the previously identified HE markers CD44 and Procr whose expression is detected in a wider range of AGM CDH5+ cells (endothelial to IAHC). In humans, ACE marks prehematopoietic mesoderm, aortic endothelial cells, and HSPCs.94,95 In the E10.5 mouse AGM, we observed ACE expression exclusively in the endothelial lining of the DA and vitelline artery, which contain pre-HE and HE, whereas no robust ACE expression was observed anywhere else including in the more committed hematopoietic cell in IAHC.
The exclusive expression of ACE in the DA and vitelline artery lining suggests that it may contribute to a unique microenvironment promoting hematopoiesis. ACE converts angiotensin-1 into angiotensin-2, which in turn activates angiotensin-2 receptors (AT1, AT2).96 Two recent reports97,98 have implicated the endothelin-renin-angiotensin system (which includes ACE) in AGM hematopoiesis. In human and mouse, Atgr1 (coding for AT1) expression has been detected in subaortic DA cells.97,98 In line with this, we observed Atgr1 expression in the RUNX1+ mesenchymal population, particularly in the smooth muscle fraction (C10:SMA; supplemental Figure 19). Julien et al98 have recently shown that angiotensin-2 mediated activation of AT1 can promote the emergence of hematopoietic progenitors in mouse para-aortic splanchnopleure cultures. Therefore, angiotensin-2 mediated signaling through AT1 on C10:SMA cells could, partially, explain our observation that Runx1b:RFP+ mesenchyme can support hematopoietic activity.
The PDGFRa+ mesenchymal (C9:MES-PDGFRa) fraction of the Runx1b:RFP+ mesenchyme can also play a role in stimulating hematopoiesis. We found that PTN, a secreted growth factor that plays a role in adult hematopoiesis,92 is expressed by Runx1b:RFP+PDGFRa+ mesenchymal cells in a RUNX1-dependent way. Our observation that ptn knockdown, in developing zebrafish, significantly inhibits HSPC emergence in the AGM and suggests that local mesenchymal PTN production in the AGM plays a role in the EHT process.
Finally, our findings were greatly facilitated by employing high coverage full-length scRNA-seq on defined cell populations. Phenotypic knowledge of the sequenced populations regarding protein expression and transcriptionally active loci (as determined using reporter models) provided an invaluable extra layer of information to aid interpretation of the scRNA-seq data. Overall, our data constitute a comprehensive atlas of EHT, which can be interrogated by the community to further our understanding of this process.
Acknowledgments
The authors thank the following facilities of the Cancer Research UK Manchester Institute for technical support: Advanced Imaging, Biological Resources Unit, Flow Cytometry, and the Molecular Biology Core Facility.
The study was supported by Cancer Research UK, C5759/A20971 (G.L.). Research in the Kouskoff laboratory is supported by the Medical Research Council (MR/P000673/1, MR/T000384/1) and the Biotechnology and Biological Sciences Research Council (BB/R007209/1).
Authorship
Contribution: M.Z.H.F., W.H.N., M.L., R.T., R.P., and R.M. designed and performed experiments; M.Z.H.F. performed the scRNA-seq data analysis; M.Z.H.F., W.H.N., M.L., and R.T. analyzed the data and wrote the initial draft; M.Z.H.F., W.H.N., and M.L. wrote, reviewed, and generated the figures of the manuscript; I.A. and P.S. provided resources and reagents; N.D.K. and L.F. performed zebrafish experiments; S.M.B. and M.R. supervised bioinformatic analyses; and V.K. and G.L. designed and supervised the research project, analyzed the data, and wrote the manuscript.
Conflict-of-interest disclosure: The authors declare no competing interests.
Correspondence: Georges Lacaud, Cancer Research UK Manchester Institute, Room 33G71, Aldreley Park, Alderley Edge, Macclesfield SK10 4TG, United Kingdom; e-mail: georges.lacaud@cruk.manchester.ac.uk.
The online version of this article contains a data supplement.
There is a Blood Commentary on this article in this issue.
The publication costs of this article were defrayed in part by page charge payment. Therefore, and solely to indicate this fact, this article is hereby marked “advertisement” in accordance with 18 USC section 1734.

This feature is available to Subscribers Only
Sign In or Create an Account Close Modal