

Key Points
Extramedullary tissues harbor reservoirs of HSCs/MPPs and nonproliferative progenitors without ongoing hematopoiesis.
The functional bias of PB HSPCs toward erythropoiesis is mediated by CD71+ HSCs/MPPs and suppressed with age and disease.

Abstract
Rare hematopoietic stem and progenitor cell (HSPC) pools outside the bone marrow (BM) contribute to blood production in stress and disease but remain ill-defined. Although nonmobilized peripheral blood (PB) is routinely sampled for clinical management, the diagnosis and monitoring potential of PB HSPCs remain untapped, as no healthy PB HSPC baseline has been reported. Here we comprehensively delineate human extramedullary HSPC compartments comparing spleen, PB, and mobilized PB to BM using single-cell RNA-sequencing and/or functional assays. We uncovered HSPC features shared by extramedullary tissues and others unique to PB. First, in contrast to actively dividing BM HSPCs, we found no evidence of substantial ongoing hematopoiesis in extramedullary tissues at steady state but report increased splenic HSPC proliferative output during stress erythropoiesis. Second, extramedullary hematopoietic stem cells/multipotent progenitors (HSCs/MPPs) from spleen, PB, and mobilized PB share a common transcriptional signature and increased abundance of lineage-primed subsets compared with BM. Third, healthy PB HSPCs display a unique bias toward erythroid-megakaryocytic differentiation. At the HSC/MPP level, this is functionally imparted by a subset of phenotypic CD71+ HSCs/MPPs, exclusively producing erythrocytes and megakaryocytes, highly abundant in PB but rare in other adult tissues. Finally, the unique erythroid-megakaryocytic–skewing of PB is perturbed with age in essential thrombocythemia and β-thalassemia. Collectively, we identify extramedullary lineage-primed HSPC reservoirs that are nonproliferative in situ and report involvement of splenic HSPCs during demand-adapted hematopoiesis. Our data also establish aberrant composition and function of circulating HSPCs as potential clinical indicators of BM dysfunction.
Introduction
In adults, hematopoiesis occurs in the bone marrow (BM), where >99% of hematopoietic stem and progenitor cells (HSPCs) reside,1,2 giving rise to all mature blood cells. Rare HSPCs are also found outside the BM, in extramedullary tissues such as spleen, lung, and liver or circulating in peripheral blood (PB).3-5 However, very little is known about the cellular composition of extramedullary and circulating human HSPCs, their function, and their contribution to hematopoiesis in healthy individuals.
In adulthood, HSPC migration and differentiation outside the BM, also called extramedullary hematopoiesis (EMH), is associated with hematopoietic stress and has mostly been studied in mouse models. The spleen is one of the most common sites for EMH in anemia,6-8 myeloproliferative disorders,9 during pregnancy,10-13 and with chronic inflammation/infection.14,15 Under stress, splenic stem cell factor and CXCL12 attract BM HSPCs to infiltrate the spleen.10,16,17 At steady-state, spleen HSPCs comprise BM-derived circulating HSPCs transiently occupying a distinct niche but likely also long-term residents of this tissue, as shown by parabiosis experiments18 and the identification of progenitor cell types found exclusively in spleen.6,8,19 Phenotypic hematopoietic stem cells (HSCs) are significantly less frequent in mouse and human spleen than in BM but have similar long-term repopulating capacity18 or long-term culture-initiating capacity,20 respectively. Finally, clinical observations suggest differences in EMH in mice and humans, particularly under stress, with mice much more likely to activate splenic erythropoiesis than humans.21 Overall, the cellular dynamics and molecular regulation of HSPCs inside the spleen remain largely unexplored, especially in humans.
Much research has focused on signals that mobilize BM HSCs into PB.22 HSPC migration and activity in PB fluctuates, following a light–dark cycle,23 peaking in humans postmeridian.24 In mice, most steady-state circulating PB HSPCs show no long-term repopulating potential,25 often fail to re-enter the BM,18,26,27 or change phenotype after their egress.27 In humans, increased frequencies of CD34+ cells in PB are observed in many hematopoietic diseases, notably in sickle cell anemia and β-thalassemia, and in cardiovascular, autoimmune, and rheumatologic conditions,21,28-34 although with very few studies providing further resolution of CD34+ subsets. It has long been assumed that steady-state PB HSPC composition mirrors that of the BM, but no baseline steady-state circulating HSPC composition has been reported to date.
Here we report unique cellular, molecular, and functional features of adult human extramedullary HSPCs at steady-state; in granulocyte colony-stimulating factor (G-CSF)–mobilized PB (mPB), the most widely used source for clinical HSC transplantation; and in disease. Collectively, we profiled >155 000 single CD19–CD34+ HSPCs by single-cell RNA-sequencing (scRNA-seq), 33 000 single HSPCs by Cellular Indexing of Transcriptomes and Epitopes by Sequencing (CITE-seq), and 9 000 single phenotypic HSC/multipotent progenitors (MPPs) in functional assays. We define steady-state noncycling progenitors and HSC/MPP lineage-priming as hallmarks of extramedullary HSPCs. Moreover, HSPCs circulating in PB largely consist of cells committed to erythroid (Ery) / megakaryocytic (Meg) differentiation, many of which are molecularly akin to HSCs/MPPs, in a unique configuration that becomes perturbed with age and disease.
Methods
Human samples
Human samples used in this study are summarized in supplemental Table 1 (available on the Blood Web site). BM, spleen, and PB from consented deceased organ donors (ODs) with no clinical signs of acute infection and spleen from patients with hereditary spherocytosis (HS) were harvested at the Cambridge University Hospitals NHS Trust Addenbrooke’s Hospital in accordance with regulated procedures approved by the relevant Research and Ethics Committees (REC 15/EE/0152 and REC 07/MRE05/44, respectively). PB from healthy living donors (LDs) and patients with essential thrombocythemia (ET) was collected with informed consent by the NHS Blood and Transfusion (NHSBT) Centre in Cambridge from either: (1) leukocyte cones that are a byproduct of platelet apheresis (REC 12/EE/0040); (2) whole blood leukoreduction filters; or (3) venipuncture (REC 07/MRE05/44 and REC 18/EE/0199). PB from patients with transfusion-dependent β-thalassemia was sampled at Ospedale San Raffaele in Milan with informed consent under the TIGET09 protocol. Frozen BM and G-CSF–mobilized PB cells were purchased from Lonza and Stemcell Technologies. Sample preparation, antibody staining, cell sorting, and phenotyping by flow and mass cytometry are described in the supplemental Methods.
RNA-seq
For scRNA-seq (10X Genomics [10X]) and CITE-seq (TotalSeqTM, Biolegend and 10X) , up to 30 000 CD19–CD34+ HSPCs from each tissue and donor (supplemental Table 9) were sorted into 300 μL phosphate-buffered saline/3% fetal calf serum. After centrifugation, cells were resuspended in 47 μL of phosphate-buffered saline + 0.04% bovine serum albumin for library prep using the Chromium Single Cell 3′ reagents (10X).
Single-cell–sorted phenotypic HSCs/MPPs from OD1 and OD2 and CD71+ PB HSCs/MPPs were sequenced with the Smart-seq2 protocol (supplemental Table 9) as described elsewhere.35 This protocol was also used for bulk RNA-seq (20 cells) of CD71– and CD71+ PB HSCs/MPPs. In this case, technical triplicates were sequenced for each population and donor (n = 4).
Library preparation and bioinformatics analysis are described in the supplemental Methods and supplemental Tables 2 to 4.
Cell culture assays
Single-cell assays testing for myeloid (My), Ery, Meg, and lymphoid differentiation were performed as described elsewhere.35 Single-cell cultures specifically promoting Ery and Meg lineage differentiation were modified from a published protocol.36 Bulk colony assays were performed by using the MegaCult-C kit or MethoCult (H4034) medium following the manufacturer’s instructions (Stemcell Technologies). Further details on cell culture assays and their analysis are described in the supplemental Methods.
Mice and xenotransplantation assays
Mice of the NOD.Cg-PrkdcscidIl2rgtm1Wjl/SzJ strain (NSG) were obtained from Charles River Laboratories or bred in-house. Animals were housed in a specific-pathogen-free animal facility. Experiments were conducted under the project license PIL P846C00DB, regulated by the UK Home Office and the Animals (Scientific Procedures) Act 1986 Amendment Regulations 2012 following ethical review by the University of Cambridge Animal Welfare and Ethical Review Body.
Xenotransplantation was performed on age-matched female NSG mice as described in the supplemental Methods.
Statistical analysis
After examination of data distribution and variance between groups, the appropriate statistical tests were performed with GraphPad Prism (version 7 or higher; GraphPad Software), R (version 3.4.0 or higher; R Foundation for Statistical Computing), or Python 3.8.6 (Python Software Foundation). Statistics for each analysis are described in each relevant section.
Results
HSPC composition in extramedullary tissues is skewed toward early progenitors
Human spleen and PB contain rare and, to date, poorly characterized phenotypic CD34+ HSPCs and HSCs/MPPs (supplemental Figure 1A-C). To comprehensively characterize extramedullary HSPC composition at steady state, we performed 10X scRNA-seq on CD19–CD34+ HSPCs isolated from matched BM, PB, and spleen from young ODs with no clinical signs of acute infection and unmatched PB from 6 healthy volunteers (supplemental Table 1; supplemental Figure 1D). Given the abundance of CD19+CD34+ B-cell progenitors in the spleen (supplemental Figure 1A), these were excluded from all tissues to ensure profiling of sufficient numbers of all other HSPC subsets.
To generate a reference map of all analyzed hematopoietic tissues, we combined all cells from all donors using the Seurat integration method.37 Leiden clusters38 were annotated based on the following: (1) highly expressed marker genes; (2) “lineage scores” derived from published gene sets of highly purified HSPC subsets39; and (3) cluster position along a diffusion pseudotime axis (Figure 1A-C; supplemental Figure 1E-I; supplemental Table 2a-b). Surface protein expression from CITE-seq data from 2 donors (Figure 1D) further confirmed cluster annotation and verified that transcriptionally defined HSCs/MPPs overlapped with phenotypic HSCs/MPPs (CD34+CD38–CD45RA–) with high expression of known HSC markers such as CD90 and CD110.
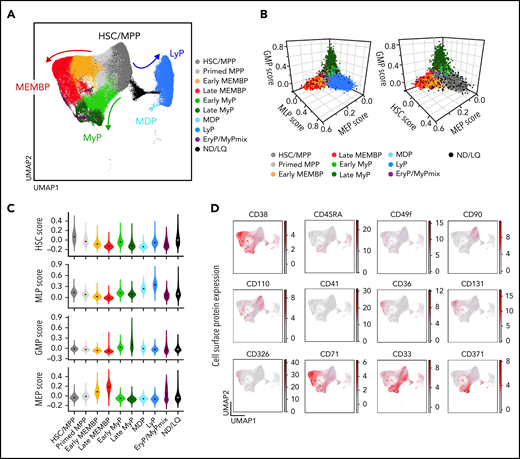
Single-cell transcriptomic landscape of human adult HSPCs across medullary and extramedullary hematopoietic tissues. Analysis of 10X Genomics scRNA-seq and CITE-seq data from 117 200 CD19–CD34+ HSPCs isolated from BM, nonmobilized PB, and spleen of adult donors. (A) Uniform Manifold Approximation and Projection (UMAP) of the multisite HSPC landscape after exclusion of mature cells (see Methods). Clusters were annotated by using known lineage and stem cell marker genes found among the most differentially expressed genes in each cluster (supplemental Table 2a). Clusters with similar cell identity are shown as HSPC groups using different cluster colors. Detailed cluster composition is shown in supplemental Figure 1F, and HSCP grouping is summarized in supplemental Table 2c. (B-C) Three-dimensional plots (B) and violin plots (C) of lineage- and HSC-scores calculated for each cell by using published gene sets enriched in prospectively isolated HSPC subsets39 (see Methods). (D) CITE-seq data from 2 BMs (OD3, 9 477 cells; OD4, 12 500 cells) and 1 spleen (OD4, 11 822 cells). UMAPs highlighting selected surface protein expression across the HSPC landscape. HSC/MPP, hematopoietic stem cell/multipotent progenitor; EryP, Ery progenitor; GMP, granulocyte-monocyte progenitor; LyP, lymphoid progenitor; MDP, monocyte/dendritic cell progenitor; MEMBP, megakaryocyte/erythroid/mast cell/basophil progenitor; MEP, megakaryocyte/erythroid progenitor; MyP, My progenitor; ND/LQ, cluster of lower quality which identity could not be defined using known marker genes; GMP, granulocyte-monocyte progenitor; MEP, megakaryocyte/erythroid progentitor; MLP, multilymphoid progenitor.
Single-cell transcriptomic landscape of human adult HSPCs across medullary and extramedullary hematopoietic tissues. Analysis of 10X Genomics scRNA-seq and CITE-seq data from 117 200 CD19–CD34+ HSPCs isolated from BM, nonmobilized PB, and spleen of adult donors. (A) Uniform Manifold Approximation and Projection (UMAP) of the multisite HSPC landscape after exclusion of mature cells (see Methods). Clusters were annotated by using known lineage and stem cell marker genes found among the most differentially expressed genes in each cluster (supplemental Table 2a). Clusters with similar cell identity are shown as HSPC groups using different cluster colors. Detailed cluster composition is shown in supplemental Figure 1F, and HSCP grouping is summarized in supplemental Table 2c. (B-C) Three-dimensional plots (B) and violin plots (C) of lineage- and HSC-scores calculated for each cell by using published gene sets enriched in prospectively isolated HSPC subsets39 (see Methods). (D) CITE-seq data from 2 BMs (OD3, 9 477 cells; OD4, 12 500 cells) and 1 spleen (OD4, 11 822 cells). UMAPs highlighting selected surface protein expression across the HSPC landscape. HSC/MPP, hematopoietic stem cell/multipotent progenitor; EryP, Ery progenitor; GMP, granulocyte-monocyte progenitor; LyP, lymphoid progenitor; MDP, monocyte/dendritic cell progenitor; MEMBP, megakaryocyte/erythroid/mast cell/basophil progenitor; MEP, megakaryocyte/erythroid progenitor; MyP, My progenitor; ND/LQ, cluster of lower quality which identity could not be defined using known marker genes; GMP, granulocyte-monocyte progenitor; MEP, megakaryocyte/erythroid progentitor; MLP, multilymphoid progenitor.
Considering that CD19+CD34+ B-cell progenitors were purposely not profiled here, our multi-tissue HSPC landscape overall resembles that described for human HSPC hierarchies in fetal, neonatal, and adult life.40-44 Strikingly, spleen and PB displayed HSPC compositions clearly distinct from BM in the HSC/MPP compartment and in the committed progenitor branches, as shown by analysis of the following: (1) cluster-independent cellular distributions (Figure 2A; supplemental Figure 2A); (2) normalized cell counts for each cluster (supplemental Table 2c); or (3) HSPC group (Figure 2B). Inter-individual variability in cluster abundance was highest in PB (supplemental Figure 2B) but comparable to that previously reported for healthy donor BM.40
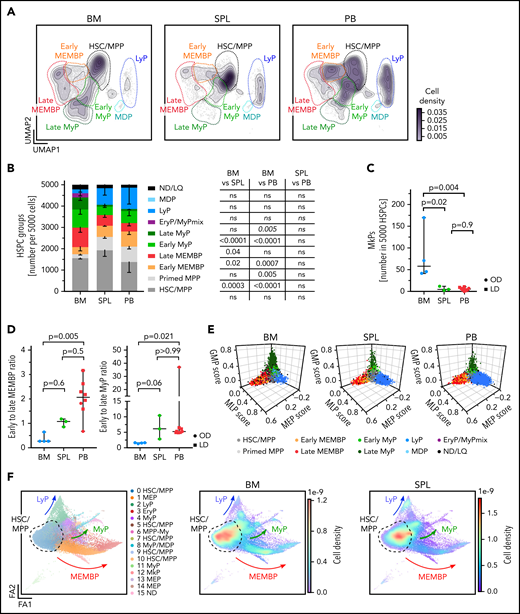
Distinct HSPC composition in BM, spleen (SPL), and PB. (A-E) Analysis of 10X scRNA-seq data from 117 200 cells, combining all donors but comparing different tissues (BM, 34 967 cells; SPL, 22 068 cells; PB, 60 165 cells). (A) Two-dimensional kernel density of cells across the Uniform Manifold Approximation and Projection (UMAP) coordinates of each tissue, displayed as contours filled by a color gradient. (B) Bar graph of the relative composition of HSPC groups in BM, SPL, and PB. Each group was defined as shown in Figure 1. Mean ± standard deviation is shown. (C) Relative number of megakaryocyte progenitors (MkPs) (cluster 22) in each tissue. (D) The ratio of early to late progenitors of the MEMB (left) or My (right) branch is shown. Kruskal-Wallis; Dunn’s multiple comparison test. (E) Three-dimensional plots show lineage scores as in Figure 1B for each tissue. (F) Force Directed Graph computed by using CITE-seq protein data of 2 BM (OD3, 9 477 cells; OD4, 12 500 cells) and 1 SPL (OD4, 11 822 cells). Left, Leiden clusters as annotated based on known surface marker expression (supplemental Figure 2D). Right: density visualization of the distinct cell distributions for each tissue in different areas of the landscape. For panels B and C, 1-way analysis of variance with post hoc Tukey test, except for LyP and EryP/MyPmix clusters (not normally distributed, italic text), for which a Kruskal-Wallis test with Dunn’s multiple comparison was used. Data in panels C and D are given as median ± 95% confidence interval. OD, organ donors; LD, living donor; ns, not significant (P > .05).
Distinct HSPC composition in BM, spleen (SPL), and PB. (A-E) Analysis of 10X scRNA-seq data from 117 200 cells, combining all donors but comparing different tissues (BM, 34 967 cells; SPL, 22 068 cells; PB, 60 165 cells). (A) Two-dimensional kernel density of cells across the Uniform Manifold Approximation and Projection (UMAP) coordinates of each tissue, displayed as contours filled by a color gradient. (B) Bar graph of the relative composition of HSPC groups in BM, SPL, and PB. Each group was defined as shown in Figure 1. Mean ± standard deviation is shown. (C) Relative number of megakaryocyte progenitors (MkPs) (cluster 22) in each tissue. (D) The ratio of early to late progenitors of the MEMB (left) or My (right) branch is shown. Kruskal-Wallis; Dunn’s multiple comparison test. (E) Three-dimensional plots show lineage scores as in Figure 1B for each tissue. (F) Force Directed Graph computed by using CITE-seq protein data of 2 BM (OD3, 9 477 cells; OD4, 12 500 cells) and 1 SPL (OD4, 11 822 cells). Left, Leiden clusters as annotated based on known surface marker expression (supplemental Figure 2D). Right: density visualization of the distinct cell distributions for each tissue in different areas of the landscape. For panels B and C, 1-way analysis of variance with post hoc Tukey test, except for LyP and EryP/MyPmix clusters (not normally distributed, italic text), for which a Kruskal-Wallis test with Dunn’s multiple comparison was used. Data in panels C and D are given as median ± 95% confidence interval. OD, organ donors; LD, living donor; ns, not significant (P > .05).
BM contained more My (Figure 2A-B) and Meg progenitors (Figure 2C) than extramedullary tissues, with the former having significantly higher Meg-priming scores than extramedullary Meg progenitors (supplemental Figure 2C). Spleen and PB harbored significantly fewer late progenitors of the My and megakaryocyte/erythroid/mast cell/basophil (MEMB) lineage than BM (Figure 2A-B), resulting in a marked shift in the ratios of early to late progenitors between tissues (Figure 2D). In addition, “primed MPPs,” a subset of HSCs/MPPs with marked My or Ery/Meg lineage-priming, were significantly enriched at extramedullary sites. All specific features of progenitor composition in extramedullary tissues were confirmed in a cluster-independent manner by: (1) using the lineage-scores (Figure 2E); (2) building an embedding based exclusively on 198 protein markers (done for 2 BMs and 1 spleen; Figure 2F; supplemental Figure 2D-E; supplemental Table 2d-e); and (3) comparing spleen and PB data to the benchmark Human Cell Atlas BM data set40 (see Methods) (supplemental Figure 2F-H; supplemental Table 2f). All extramedullary features were also observed using different quality control parameters (not shown); upon regression of cell cycle genes (supplemental Table 2g; supplemental Figure 3A-F); and with an independent batch correction method (ComBat45) (supplemental Table 2h; supplemental Figure 3G-H). In summary, HSPC composition at extramedullary sites markedly differs from that of BM.
Minimal in situ proliferation of Ery and My progenitors at extramedullary sites
Given the striking relative lack of late extramedullary progenitors compared with BM, we next investigated the cell cycle and differentiation dynamics of human extramedullary HSPCs. Most progenitor clusters in spleen and PB had significantly decreased proportions of cycling cells (S-G2-M phase) compared with BM by transcriptome-based cell cycle assignment (Figure 3A; supplemental Figure 4A; supplemental Table 2b). Ki67/DAPI flow cytometry confirmed the almost complete absence of CD19–CD34+CD38+ progenitors in S-G2-M at extramedullary sites (Figure 3B-C).
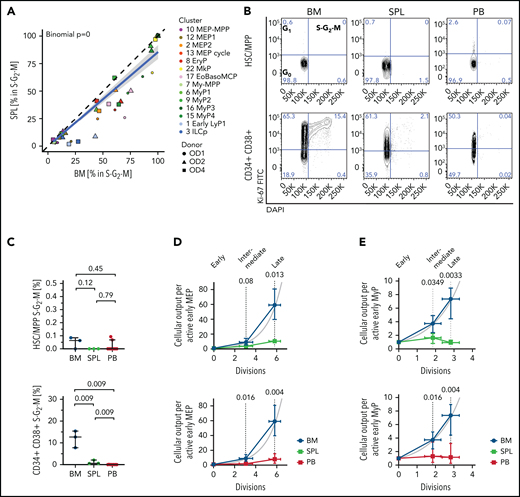
Low proliferation of progenitors in extramedullary tissues compared with BM. (A,D-E) Analysis of 10X scRNA-seq data from 117 200 cells, combining all donors but comparing different tissues. (A) Percentage of cells in S-G2-M phase (assigned by cell cycle phase scoring as described previously72) in matched BM and spleen (SPL) from the same donor for each indicated progenitor cluster. Two-sided exact binomial test. (B) Representative flow cytometry plots of BM (left), SPL (middle), and PB (right) CD19–CD34+CD38–CD45RA– HSCs/MPPs (top row) or CD19–CD34+CD38+ progenitor cells (bottom row) in G0 (Ki-67–DAPI–), G1 (Ki-67+DAPI–), and S-G2-M (Ki-67+DAPI+) cell cycle phases. (C) Frequency of phenotypic HSCs/MPPs (top row) or CD19–CD34+CD38+ progenitor cells (bottom right) from each tissue in S-G2-M phase (Ki-67+DAPI+) assessed by flow cytometry. Median ± 95% confidence interval is shown. A 2-tailed unpaired t test was used to compare BM and SPL (normal distribution), and 2-tailed Mann-Whitney U tests were used to compare BM/SPL with PB (not normally distributed); n = 3 nonmatched BM and SPL tissues, n = 9 PBs measured over 8 experiments. (D-E) Estimated cellular output from early to late progenitors of the MEMB (D) and the My (E) branch calculated from the number of active cells assuming all divisions are symmetric divisions toward differentiation (see Methods). Gray line indicates theoretical exponential expansion; vertical error bars indicate the range observed in the different tissues; and horizontal error bars indicate the standard deviation of the estimated number of divisions for each expansion stage. EoBasoMCP; eosinophil/basophil/mast cell progenitor; EryP, Ery progenitor; ILCp, innate lymphoid cell progenitor; LyP, lymphoid progenitor; MkP, megakaryocyte progenitors; MEP, megakaryocyte-erythroid progenitor; MPP, multipotent progenitor; MyP, myeloid progenitor.
Low proliferation of progenitors in extramedullary tissues compared with BM. (A,D-E) Analysis of 10X scRNA-seq data from 117 200 cells, combining all donors but comparing different tissues. (A) Percentage of cells in S-G2-M phase (assigned by cell cycle phase scoring as described previously72) in matched BM and spleen (SPL) from the same donor for each indicated progenitor cluster. Two-sided exact binomial test. (B) Representative flow cytometry plots of BM (left), SPL (middle), and PB (right) CD19–CD34+CD38–CD45RA– HSCs/MPPs (top row) or CD19–CD34+CD38+ progenitor cells (bottom row) in G0 (Ki-67–DAPI–), G1 (Ki-67+DAPI–), and S-G2-M (Ki-67+DAPI+) cell cycle phases. (C) Frequency of phenotypic HSCs/MPPs (top row) or CD19–CD34+CD38+ progenitor cells (bottom right) from each tissue in S-G2-M phase (Ki-67+DAPI+) assessed by flow cytometry. Median ± 95% confidence interval is shown. A 2-tailed unpaired t test was used to compare BM and SPL (normal distribution), and 2-tailed Mann-Whitney U tests were used to compare BM/SPL with PB (not normally distributed); n = 3 nonmatched BM and SPL tissues, n = 9 PBs measured over 8 experiments. (D-E) Estimated cellular output from early to late progenitors of the MEMB (D) and the My (E) branch calculated from the number of active cells assuming all divisions are symmetric divisions toward differentiation (see Methods). Gray line indicates theoretical exponential expansion; vertical error bars indicate the range observed in the different tissues; and horizontal error bars indicate the standard deviation of the estimated number of divisions for each expansion stage. EoBasoMCP; eosinophil/basophil/mast cell progenitor; EryP, Ery progenitor; ILCp, innate lymphoid cell progenitor; LyP, lymphoid progenitor; MkP, megakaryocyte progenitors; MEP, megakaryocyte-erythroid progenitor; MPP, multipotent progenitor; MyP, myeloid progenitor.
Because early progenitors of the MEMB and My branches are overrepresented in extramedullary tissues compared with BM (Figure 2B,D), we estimated the relative numbers of actively proliferating cells in each cluster and calculated the lower bound expansion along each branch. In BM, progenitor production grew exponentially, at a rate consistent with ∼6 and 3 differentiating divisions from the earliest to latest stages of the MEMB and My branches, respectively (Figure 3D-E), in keeping with active hematopoiesis. In spleen or PB, we modeled very limited progenitor expansion that is incompatible with sustained ongoing hematopoiesis at these sites. In line with the greater proliferative output of BM, division-associated gene sets were enriched in BM early MEMB progenitors and My progenitors compared with extramedullary sites (supplemental Figure 4B; supplemental Table 3a-d; supplemental Table 4b-e). However, despite not being proliferative in situ, PB megakaryocyte/erythroid progenitors (MEPs) remain responsive to cytokine stimulation in vitro, entering cell cycle with similar kinetics as BM MEPs and producing colonies of similar type and size (supplemental Figure 4C-E). In conclusion, whereas extramedullary progenitors retain the capacity to cycle and differentiate, in situ active hematopoiesis is minimal in PB and spleen.
Most spleen HSCs/MPPs are lineage-primed
Given the distinct cellular microenvironments of BM and spleen, we hypothesized that HSCs/MPPs in these anatomical locations would differ in their cellular composition and molecular properties. Because distinct abundances of transcriptionally defined HSC/MPP clusters 0 and 4 were noted in BM and spleen (supplemental Figure 5A), we reclustered all HSCs/MPPs from matching BM and spleen of the same individuals using the Self Assembling Manifolds (SAM) algorithm.46 Consistently across donors, unsupervised clustering yielded 1 cluster containing mainly BM cells (termed “medullary”, SAM0-med) and 1 cluster largely constituted of cells from spleen (termed “extramedullary”, SAM1-extramed) (Figure 4A-B; supplemental Figure 5B; supplemental Table S2i). Within the HSC/MPP space, 90% ± 7.5% of all spleen cells were of the extramedullary type, whereas 82% ± 13% of BM cells were of the medullary type (Figure 4C).
![Unique transcriptional and cell surface protein characteristics of extramedullary HSCs/MPPs. (A-E,G) Analysis of 10X scRNA-seq data from 16 651 transcriptionally defined HSCs/MPPs (sum of clusters 0, 4, 5, 11, and 21 from Figure 1A) combining matched BM and spleen (SPL) from the same individuals (OD1, 3812 cells; OD2, 3460 cells; OD4, 9379 cells). (A) Uniform Manifold Approximation and Projections (UMAPs) of HSCs/MPPs clustered according to SAM (k-means = 2; top panels colored according to SAM cluster, bottom panels according to tissue). (B) Bar graphs of the proportions of BM- and SPL-derived HSCs/MPPs in the SAM0-med and SAM1-extramed clusters. (C) Proportions of SAM0-med and SAM1-extramed HSCs/MPPs in the HSC/MPP space of each tissue. (D) Analysis of genes differentially expressed between the SAM0-med (n = 7068 cells) and SAM1-extramed (n = 9583 cells) clusters. Pre-ranked Gene Set Enrichment Analysis (GSEA) of population-specific signatures (left; cord blood long-term HSC [CB LT-HSC] and short-term HSC [ST-HSC] from Laurenti et al,47 BM LT-HSC (unpublished), other from Laurenti et al39) and lineage-priming modules (right; from Velten et al43) comparing SAM0-med with SAM1-extramed HSCs/MPPs. Selected lineage-priming modules are shown. All gene sets are listed in supplemental Table 4g. (E) Volcano plot of differentially expressed surface proteins (P < .05; log-fold change >0.5) in SAM0-med and SAM1-extramed HSCs/MPPs from CITE-seq data of OD4. (F) Pseudo-time of all transcriptionally defined HSCs/MPPs in each tissue. Kruskal-Wallis test with multiple comparison. (G) GSEA of C2 curated MSigDB pathways (false discovery rate <0.05 by preranked GSEA) on differentially expressed genes between SAM0-med (n = 7068 cells) and SAM1-extramed (n = 9583 cells) HSCs/MPPs. Selected gene sets are shown. All gene sets are listed in supplemental Table 4h. (H) scRNA-seq data from four mPB CD19–CD34+ HSPCs (28 026 cells) were integrated with the same BMs and nonmobilized PBs as in Figure 2. The cell density across the UMAP coordinates of each tissue is displayed as contours filled by a color gradient. Different HSPC groups are indicated by dashed lines. (I-J) Gene signatures of medullary- and extramedullary-type HSCs/MPPs were used to compute a BM- or SPL-type identity score for each HSC/MPP cell of the multi-tissue landscape. Box plots show the ratio between BM- and SPL-type scores for each sample (“identity ratio”). Notches indicate the 95% confidence interval of the median (middle line). (I) The identity ratio was calculated for BM and SPL HSCs/MPPs taken from our 10X multi-tissue landscape and then validated by using transcriptionally defined HSCs/MPPs from the Human Cell Atlas BM data set (HCA BM)40 as well as Smart-seq2 (SS2) data from single-cell sorted phenotypic HSCs/MPPs (CD19–CD34+CD38–CD45RA–) from BM (SS2 BM) and SPL (SS2 SPL) of OD1 and OD2. (J) Boxplots show the identity ratio for BM (10X BM), nonmobilized PB (10X PB), and mPB (10X mPB) calculated using only the data integration containing these tissues. Mean ± standard deviation is shown in panels B and C. Two-tailed paired t test. *P = .02. LyP, lymphoid progenitor; MDP, monocyte/dendritic cell progenitor; MEMBP, MEMB progenitor; MLP, multilymphoid progenitor; MyP, My progenitor; NES, normalized enrichment score; PID, Pathway Interaction Database; WP, WikiPathways.](https://ash.silverchair-cdn.com/ash/content_public/journal/blood/139/23/10.1182_blood.2021013450/3/m_bloodbld2021013450f4.png?Expires=1766770514&Signature=FAJovUhOtmpV5NEN-5f90NS4ifFEbCCr~r1bfPpRBrgL9KgLUQLAVF9kwuHiIxLD77gUxT8odmnF-2XU0eY1V5l-knjKWn1CCC-xzY1KgeKMtV0uHCN1wkNfsYVwUAtFovDwLhZt2VtCxsW6ZRxIIMa9BdYMtjShzRE4yUGAurEmjN0pF3WSGsf51bX1jB1w~tto5JwJd1xL1MnGmgKvGesgOacMrSRPVwRv5jrkJXItsCwdpKHpwnWOCT52FHK-3x0kbDOHT2fDce1xbORFTRLbmYUyho29vF02V4Fju9eNQ6dSsSK02PG0nTkg6e6Q86JMPJYXB3hic7lwOwujyQ__&Key-Pair-Id=APKAIE5G5CRDK6RD3PGA)
Unique transcriptional and cell surface protein characteristics of extramedullary HSCs/MPPs. (A-E,G) Analysis of 10X scRNA-seq data from 16 651 transcriptionally defined HSCs/MPPs (sum of clusters 0, 4, 5, 11, and 21 from Figure 1A) combining matched BM and spleen (SPL) from the same individuals (OD1, 3812 cells; OD2, 3460 cells; OD4, 9379 cells). (A) Uniform Manifold Approximation and Projections (UMAPs) of HSCs/MPPs clustered according to SAM (k-means = 2; top panels colored according to SAM cluster, bottom panels according to tissue). (B) Bar graphs of the proportions of BM- and SPL-derived HSCs/MPPs in the SAM0-med and SAM1-extramed clusters. (C) Proportions of SAM0-med and SAM1-extramed HSCs/MPPs in the HSC/MPP space of each tissue. (D) Analysis of genes differentially expressed between the SAM0-med (n = 7068 cells) and SAM1-extramed (n = 9583 cells) clusters. Pre-ranked Gene Set Enrichment Analysis (GSEA) of population-specific signatures (left; cord blood long-term HSC [CB LT-HSC] and short-term HSC [ST-HSC] from Laurenti et al,47 BM LT-HSC (unpublished), other from Laurenti et al39) and lineage-priming modules (right; from Velten et al43) comparing SAM0-med with SAM1-extramed HSCs/MPPs. Selected lineage-priming modules are shown. All gene sets are listed in supplemental Table 4g. (E) Volcano plot of differentially expressed surface proteins (P < .05; log-fold change >0.5) in SAM0-med and SAM1-extramed HSCs/MPPs from CITE-seq data of OD4. (F) Pseudo-time of all transcriptionally defined HSCs/MPPs in each tissue. Kruskal-Wallis test with multiple comparison. (G) GSEA of C2 curated MSigDB pathways (false discovery rate <0.05 by preranked GSEA) on differentially expressed genes between SAM0-med (n = 7068 cells) and SAM1-extramed (n = 9583 cells) HSCs/MPPs. Selected gene sets are shown. All gene sets are listed in supplemental Table 4h. (H) scRNA-seq data from four mPB CD19–CD34+ HSPCs (28 026 cells) were integrated with the same BMs and nonmobilized PBs as in Figure 2. The cell density across the UMAP coordinates of each tissue is displayed as contours filled by a color gradient. Different HSPC groups are indicated by dashed lines. (I-J) Gene signatures of medullary- and extramedullary-type HSCs/MPPs were used to compute a BM- or SPL-type identity score for each HSC/MPP cell of the multi-tissue landscape. Box plots show the ratio between BM- and SPL-type scores for each sample (“identity ratio”). Notches indicate the 95% confidence interval of the median (middle line). (I) The identity ratio was calculated for BM and SPL HSCs/MPPs taken from our 10X multi-tissue landscape and then validated by using transcriptionally defined HSCs/MPPs from the Human Cell Atlas BM data set (HCA BM)40 as well as Smart-seq2 (SS2) data from single-cell sorted phenotypic HSCs/MPPs (CD19–CD34+CD38–CD45RA–) from BM (SS2 BM) and SPL (SS2 SPL) of OD1 and OD2. (J) Boxplots show the identity ratio for BM (10X BM), nonmobilized PB (10X PB), and mPB (10X mPB) calculated using only the data integration containing these tissues. Mean ± standard deviation is shown in panels B and C. Two-tailed paired t test. *P = .02. LyP, lymphoid progenitor; MDP, monocyte/dendritic cell progenitor; MEMBP, MEMB progenitor; MLP, multilymphoid progenitor; MyP, My progenitor; NES, normalized enrichment score; PID, Pathway Interaction Database; WP, WikiPathways.
Unique transcriptional and cell surface protein characteristics of extramedullary HSCs/MPPs. (A-E,G) Analysis of 10X scRNA-seq data from 16 651 transcriptionally defined HSCs/MPPs (sum of clusters 0, 4, 5, 11, and 21 from Figure 1A) combining matched BM and spleen (SPL) from the same individuals (OD1, 3812 cells; OD2, 3460 cells; OD4, 9379 cells). (A) Uniform Manifold Approximation and Projections (UMAPs) of HSCs/MPPs clustered according to SAM (k-means = 2; top panels colored according to SAM cluster, bottom panels according to tissue). (B) Bar graphs of the proportions of BM- and SPL-derived HSCs/MPPs in the SAM0-med and SAM1-extramed clusters. (C) Proportions of SAM0-med and SAM1-extramed HSCs/MPPs in the HSC/MPP space of each tissue. (D) Analysis of genes differentially expressed between the SAM0-med (n = 7068 cells) and SAM1-extramed (n = 9583 cells) clusters. Pre-ranked Gene Set Enrichment Analysis (GSEA) of population-specific signatures (left; cord blood long-term HSC [CB LT-HSC] and short-term HSC [ST-HSC] from Laurenti et al,47 BM LT-HSC (unpublished), other from Laurenti et al39) and lineage-priming modules (right; from Velten et al43) comparing SAM0-med with SAM1-extramed HSCs/MPPs. Selected lineage-priming modules are shown. All gene sets are listed in supplemental Table 4g. (E) Volcano plot of differentially expressed surface proteins (P < .05; log-fold change >0.5) in SAM0-med and SAM1-extramed HSCs/MPPs from CITE-seq data of OD4. (F) Pseudo-time of all transcriptionally defined HSCs/MPPs in each tissue. Kruskal-Wallis test with multiple comparison. (G) GSEA of C2 curated MSigDB pathways (false discovery rate <0.05 by preranked GSEA) on differentially expressed genes between SAM0-med (n = 7068 cells) and SAM1-extramed (n = 9583 cells) HSCs/MPPs. Selected gene sets are shown. All gene sets are listed in supplemental Table 4h. (H) scRNA-seq data from four mPB CD19–CD34+ HSPCs (28 026 cells) were integrated with the same BMs and nonmobilized PBs as in Figure 2. The cell density across the UMAP coordinates of each tissue is displayed as contours filled by a color gradient. Different HSPC groups are indicated by dashed lines. (I-J) Gene signatures of medullary- and extramedullary-type HSCs/MPPs were used to compute a BM- or SPL-type identity score for each HSC/MPP cell of the multi-tissue landscape. Box plots show the ratio between BM- and SPL-type scores for each sample (“identity ratio”). Notches indicate the 95% confidence interval of the median (middle line). (I) The identity ratio was calculated for BM and SPL HSCs/MPPs taken from our 10X multi-tissue landscape and then validated by using transcriptionally defined HSCs/MPPs from the Human Cell Atlas BM data set (HCA BM)40 as well as Smart-seq2 (SS2) data from single-cell sorted phenotypic HSCs/MPPs (CD19–CD34+CD38–CD45RA–) from BM (SS2 BM) and SPL (SS2 SPL) of OD1 and OD2. (J) Boxplots show the identity ratio for BM (10X BM), nonmobilized PB (10X PB), and mPB (10X mPB) calculated using only the data integration containing these tissues. Mean ± standard deviation is shown in panels B and C. Two-tailed paired t test. *P = .02. LyP, lymphoid progenitor; MDP, monocyte/dendritic cell progenitor; MEMBP, MEMB progenitor; MLP, multilymphoid progenitor; MyP, My progenitor; NES, normalized enrichment score; PID, Pathway Interaction Database; WP, WikiPathways.
Extramedullary HSCs/MPPs differed from medullary HSCs/MPPs by 2 main features. First, extramedullary HSCs/MPPs were largely more lineage-primed than their BM counterparts. Gene signatures and surface markers of long-term HSCs43,47 were significantly enriched in medullary HSCs/MPPs. In contrast, extramedullary HSCs/MPPs had higher expression of gene sets associated with short-term HSCs and lineage-committed progenitors,39,43,47 the master regulator of quiescence exit CDK6, and of surface proteins associated with HSC differentiation and activation (Figure 4D-E; supplemental Figure 5C; supplemental Tables 3e-I and 4f-g). Spleen HSCs/MPPs were also significantly shifted downstream in the pseudotime trajectory of our multi-tissue reference map (Figure 4F) but were equally quiescent to BM HSCs according to flow cytometry (Figure 3B-C). Second, extramedullary HSCs/MPPs were marked by expression of surface proteins and gene sets linked to altered cytoskeleton organization, cell migration, and adhesion (Figure 4E,G; supplemental Figure 5C; supplemental Tables 3e-I and 4h). Comparison of sorter-purified phenotypic HSCs/MPPs from spleen and BM via Smart-seq2 analysis confirmed the altered expression of cytoskeletal genes and transcriptional priming of splenic HSCs/MPPs (supplemental Figure 5D; supplemental Tables 3j and 4i-j).
A shared transcriptional HSC/MPP identity in spleen, PB, and mPB
We next investigated the nature of HSCs/MPPs in nonmobilized PB and G-CSF mPB. When comparing the 10X scRNA-seq HSPC landscapes from 4 mPBs (28 026 cells) to BM and steady-state PB, HSCs/MPPs and early progenitors were expectedly most abundant in mPB (Figure 4H; supplemental Figure 5E-G; supplemental Table 2j-k). To assess if PB and mPB HSCs/MPPs are globally more akin to BM or spleen HSCs/MPPs, we derived a scoring method using the top differentially expressed genes between SAM0-med and SAM1-extramed HSCs/MPPs (see Methods) (supplemental Table 3f-h). Ratios of these scores >1 and <1, respectively, indicated medullary and extramedullary identities, including when benchmarked on independent data sets (Smart-seq2 BM and spleen HSCs/MPPs and Human Cell Atlas BM data set) (Figure 4I).
Interestingly, HSCs/MPPs circulating in PB at steady-state and recently mobilized from the BM by G-CSF displayed a strong extramedullary identity (Figure 4J). Features of HSC/MPP medullary and extramedullary identity were also partially observed in early lineage progenitors, and to a lower extent in late progenitors (supplemental Table 4k), and they displayed complex patterns of expression dependent on anatomical location and G-CSF stimulation (supplemental Figure 5H; supplemental Table 3k-l).
In summary, the vast majority of extramedullary HSCs/MPPs (spleen, PB, and mPB) share elements of a transcriptional identity distinct from that of BM HSCs/MPPs, linked to lineage-priming, short-term repopulation capacity, and different mechanical and adhesive properties of HSCs/MPPs outside the BM microenvironment.
Spleen HSPCs contribute to the erythropoietic response in chronic anemia
We next sought to assess whether extramedullary HSPC composition and function are modified under severe hematopoietic stress conditions. We analyzed splenic HSPCs from two patients with hereditary spherocytosis (HS) displaying splenomegaly due to chronic anemia (supplemental Table 1; supplemental Figure 6A) by 10X scRNA-seq (9 939 cells) (supplemental Figure 6B; supplemental Table 2l-m) and single-cell functional assays. Single phenotypic HSCs/MPPs in HS spleens produced more Ery colonies in vitro than those in control spleens (Figure 5A) and displayed stronger transcriptional Ery-priming (Figure 5B; supplemental Table 3m). Furthermore, despite variability in progenitor composition between donors (supplemental Figure 6C), splenic HSPCs in both HS spleens had a noticeably higher ratio of early Ery to My progenitors than control samples (Figure 5C). Importantly, whereas the lower bound expansion along the My branch did not change, differentiation along the Ery branch was estimated to be increased in HS spleens compared with controls, albeit not to the levels modeled in BM (Figure 5D). Altogether, these data indicate that splenic HSPCs contribute to erythropoiesis in response to anemia in humans.
![Spleen (SPL) HSPCs in the anemia erythroid response. (A) Colonies derived from single phenotypic HSCs/MPPs from control spleen (Ctrl SPL; n = 234 single cells from 3 donors) and spleens of patients with hereditary spherocytosis (HS; n = 198 single cells from 2 donors) seeded into medium supporting My, Ery, Meg, and lymphoid (measured by growth of natural killer cell [NK]) differentiation (see Methods). Mean ± standard deviation is shown. (B) CD19–CD34+ HSPCs (n = 9 939 cells) from 2 patients with HS were sequenced using the 10X scRNA-seq platform and were integrated with control spleen data (same as in Figure 2). Uniform Manifold Approximation and Projections and cluster annotation of the HSPC landscape are shown in supplemental Figure 6B-C. Volcano plot shows the differentially expressed genes (false discovery rate <0.05, log-fold change >0.2) between transcriptionally defined HSCs/MPPs from control and HS spleens. Genes associated with Ery lineage commitment are shown in red. (C) Ratio of early megakaryocyte/erythroid/mast cell/basophil (MEMB) to early My progenitors in control and HS spleens. Median ± 95% confidence interval is shown. (D) Normalized estimated cellular output from early to late progenitors of the MEMB (left) and the My (right) branch calculated as for Figure 3D-E (see Methods). Gray line indicates theoretical exponential expansion; vertical error bars indicate the range observed in the different tissues; and horizontal error bars indicate the standard deviation of the estimated number of divisions for each expansion stage. Control spleens are the same as in Figure 3D-E. Undiff, undifferentiated.](https://ash.silverchair-cdn.com/ash/content_public/journal/blood/139/23/10.1182_blood.2021013450/3/m_bloodbld2021013450f5.png?Expires=1766770514&Signature=c1PaWop2BR1st6NMlDzpeH-g2-m37BBZKqddwGzTW9Okrn2-tLzfV~tybnV4EB7Hl-hGmwyNGSAWSow-hiLZFBof7fx-2Wf9XuZwGXxM3T54m9Wke1xvk1JFcDdUfZD58HI5y7waDkSaEO9nQgZw3br698ffnK7QywrmpbjHDNf82mmLtYQznOWzuTIM1ryfv0apv4H9wh8N4VB3XO0sQf7zGV~8IJhibrKwiIqHWOOYa4BrZdM8SDOBzXPyVTDX7fl-KRwkqblN4~iPOi8tPZn0TkiZKH800R8kgTNNw16hY6ePP9YI8rF-McpqiLEHETLb0HFuaeh64AvWGgShlg__&Key-Pair-Id=APKAIE5G5CRDK6RD3PGA)
Spleen (SPL) HSPCs in the anemia erythroid response. (A) Colonies derived from single phenotypic HSCs/MPPs from control spleen (Ctrl SPL; n = 234 single cells from 3 donors) and spleens of patients with hereditary spherocytosis (HS; n = 198 single cells from 2 donors) seeded into medium supporting My, Ery, Meg, and lymphoid (measured by growth of natural killer cell [NK]) differentiation (see Methods). Mean ± standard deviation is shown. (B) CD19–CD34+ HSPCs (n = 9 939 cells) from 2 patients with HS were sequenced using the 10X scRNA-seq platform and were integrated with control spleen data (same as in Figure 2). Uniform Manifold Approximation and Projections and cluster annotation of the HSPC landscape are shown in supplemental Figure 6B-C. Volcano plot shows the differentially expressed genes (false discovery rate <0.05, log-fold change >0.2) between transcriptionally defined HSCs/MPPs from control and HS spleens. Genes associated with Ery lineage commitment are shown in red. (C) Ratio of early megakaryocyte/erythroid/mast cell/basophil (MEMB) to early My progenitors in control and HS spleens. Median ± 95% confidence interval is shown. (D) Normalized estimated cellular output from early to late progenitors of the MEMB (left) and the My (right) branch calculated as for Figure 3D-E (see Methods). Gray line indicates theoretical exponential expansion; vertical error bars indicate the range observed in the different tissues; and horizontal error bars indicate the standard deviation of the estimated number of divisions for each expansion stage. Control spleens are the same as in Figure 3D-E. Undiff, undifferentiated.
Spleen (SPL) HSPCs in the anemia erythroid response. (A) Colonies derived from single phenotypic HSCs/MPPs from control spleen (Ctrl SPL; n = 234 single cells from 3 donors) and spleens of patients with hereditary spherocytosis (HS; n = 198 single cells from 2 donors) seeded into medium supporting My, Ery, Meg, and lymphoid (measured by growth of natural killer cell [NK]) differentiation (see Methods). Mean ± standard deviation is shown. (B) CD19–CD34+ HSPCs (n = 9 939 cells) from 2 patients with HS were sequenced using the 10X scRNA-seq platform and were integrated with control spleen data (same as in Figure 2). Uniform Manifold Approximation and Projections and cluster annotation of the HSPC landscape are shown in supplemental Figure 6B-C. Volcano plot shows the differentially expressed genes (false discovery rate <0.05, log-fold change >0.2) between transcriptionally defined HSCs/MPPs from control and HS spleens. Genes associated with Ery lineage commitment are shown in red. (C) Ratio of early megakaryocyte/erythroid/mast cell/basophil (MEMB) to early My progenitors in control and HS spleens. Median ± 95% confidence interval is shown. (D) Normalized estimated cellular output from early to late progenitors of the MEMB (left) and the My (right) branch calculated as for Figure 3D-E (see Methods). Gray line indicates theoretical exponential expansion; vertical error bars indicate the range observed in the different tissues; and horizontal error bars indicate the standard deviation of the estimated number of divisions for each expansion stage. Control spleens are the same as in Figure 3D-E. Undiff, undifferentiated.
Functional Ery-Meg skewing of HSCs/MPPs is a distinctive feature of healthy PB
Due to their rarity, little is known about the function of purified HSCs/MPPs that circulate in healthy individuals’ blood. HSCs/MPPs with repopulating capacity were detected 8 and 16 weeks post-transplantation (Figure 6A; supplemental Figure 7A; supplemental Table 5) but were very rare, ∼60 and 3 times lower than that reported for similar phenotypic populations in cord blood48 and mPB,49 respectively. This low repopulation frequency of PB HSCs is consistent with the overall transcriptional features of extramedullary HSCs/MPPs.
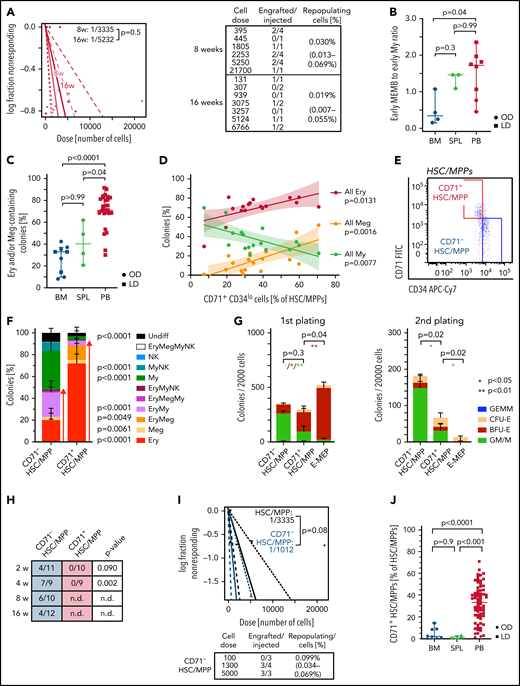
Multipotent repopulating HSCs/MPPs and quiescent CD71+ HSC-like cells with restricted erythroid/megakaryocyte differentiation potential coexist in steady-state PB. (A) Frequency of repopulating cells in PB HSCs/MPPs calculated by using Extreme Limiting Dilution Analysis73 statistics at 8 weeks (2 experiments, n = 17) and 16 weeks (2 experiments, n = 10) posttransplantation. The table indicates doses of cells injected and number of NSG mice with human cell engraftment in their BM (see Methods). (B) Ratio of early megakaryocyte/erythroid/mast cell/basophil (MEMB, sum cluster 2, 12) to early myeloid (My,sum cluster 6, 9) progenitors in all tissues. (C-D) Colonies derived from single phenotypic HSCs/MPPs from BM (n = 913 single cells from 7 samples), spleen (SPL; n = 234 single cells from 3 samples), and PB (n = 3 034 single cells; 27 independent PBs over 16 experiments) seeded into medium supporting Ery, Meg, lymphoid, and My differentiation (see Methods). (C) Frequency of colonies containing Ery and/or Meg cells for each tissue as assessed by flow cytometry. (D) Relationship between the percentage of all Ery-, Meg-, and My-containing colonies and the proportion of CD71+CD34lo cells within the phenotypic PB HSC/MPP pool. Linear regression and 95% confidence interval are indicated by solid line and shaded area, respectively. n = 17 PBs. (E) Representative pseudocolor plot for flow cytometry isolation of CD71– and CD71+ HSCs/MPPs in PB gated on phenotypic HSCs/MPPs (CD19–CD34+CD38–CD45RA– cells as defined in supplemental Figure 1D). (F) Percentage of colonies generated by CD71– (n = 872 single cells; 15 independent PBs) and CD71+ (n = 1 109 single cells; 18 independent PBs) HSCs/MPPs. P values comparing CD71– and CD71+ HSC/MPP colony output are shown. Two-tailed Mann-Whitney test. (G) Serial replating of PB CD71– or CD71+ HSCs/MPPs and CD71+ MEPs (E-MEPs) in methylcellulose medium. Colony numbers per indicated number of seeded cells after first (left) and secondary (right) plating are shown. n = 4 PBs over 3 experiments. Paired, 2-tailed t test. *P < .05, **P < .01. (H) Ratio of NSG mice engrafted to total mice tested at the indicated time points after transplantation of CD71– and CD71+ phenotypic PB HSCs/MPPs. P values comparing engraftment of CD71– and CD71+ HSCs/MPPs were determined by 2-tailed Fisher’s exact test and are shown below each time point. (I) Frequency of repopulating cells within all phenotypic PB HSCs/MPPs (same as Figure 6A) and CD71– HSCs/MPPs at 8 weeks after transplantation using Extreme Limiting Dilution Analysis statistics. (J) Percentage of CD71+ cells within the phenotypic HSC/MPP pool of BM (n = 8), SPL (n = 4), and PB (n = 65). One-way analysis of variance; Tukey’s multiple comparison. Data in panels B and C are given as median ± 95% confidence interval; Kruskal-Wallis and Dunn’s multiple comparison tests. Data in panels F, G, and J are given as mean ± standard deviation. BFU-E, burst forming unit erythroid; CFU-E, colony forming unit erythroid; GEMM, granulocyte, erythrocyte, monocyte, megakaryocyte; GM/M granulocyte monocyte/monocyte; LD; living donor; n.d., not determined; NK, natural killer; OD, organ donor; ns, not significant (P > .05); undiff, undifferentiated.
Multipotent repopulating HSCs/MPPs and quiescent CD71+ HSC-like cells with restricted erythroid/megakaryocyte differentiation potential coexist in steady-state PB. (A) Frequency of repopulating cells in PB HSCs/MPPs calculated by using Extreme Limiting Dilution Analysis73 statistics at 8 weeks (2 experiments, n = 17) and 16 weeks (2 experiments, n = 10) posttransplantation. The table indicates doses of cells injected and number of NSG mice with human cell engraftment in their BM (see Methods). (B) Ratio of early megakaryocyte/erythroid/mast cell/basophil (MEMB, sum cluster 2, 12) to early myeloid (My,sum cluster 6, 9) progenitors in all tissues. (C-D) Colonies derived from single phenotypic HSCs/MPPs from BM (n = 913 single cells from 7 samples), spleen (SPL; n = 234 single cells from 3 samples), and PB (n = 3 034 single cells; 27 independent PBs over 16 experiments) seeded into medium supporting Ery, Meg, lymphoid, and My differentiation (see Methods). (C) Frequency of colonies containing Ery and/or Meg cells for each tissue as assessed by flow cytometry. (D) Relationship between the percentage of all Ery-, Meg-, and My-containing colonies and the proportion of CD71+CD34lo cells within the phenotypic PB HSC/MPP pool. Linear regression and 95% confidence interval are indicated by solid line and shaded area, respectively. n = 17 PBs. (E) Representative pseudocolor plot for flow cytometry isolation of CD71– and CD71+ HSCs/MPPs in PB gated on phenotypic HSCs/MPPs (CD19–CD34+CD38–CD45RA– cells as defined in supplemental Figure 1D). (F) Percentage of colonies generated by CD71– (n = 872 single cells; 15 independent PBs) and CD71+ (n = 1 109 single cells; 18 independent PBs) HSCs/MPPs. P values comparing CD71– and CD71+ HSC/MPP colony output are shown. Two-tailed Mann-Whitney test. (G) Serial replating of PB CD71– or CD71+ HSCs/MPPs and CD71+ MEPs (E-MEPs) in methylcellulose medium. Colony numbers per indicated number of seeded cells after first (left) and secondary (right) plating are shown. n = 4 PBs over 3 experiments. Paired, 2-tailed t test. *P < .05, **P < .01. (H) Ratio of NSG mice engrafted to total mice tested at the indicated time points after transplantation of CD71– and CD71+ phenotypic PB HSCs/MPPs. P values comparing engraftment of CD71– and CD71+ HSCs/MPPs were determined by 2-tailed Fisher’s exact test and are shown below each time point. (I) Frequency of repopulating cells within all phenotypic PB HSCs/MPPs (same as Figure 6A) and CD71– HSCs/MPPs at 8 weeks after transplantation using Extreme Limiting Dilution Analysis statistics. (J) Percentage of CD71+ cells within the phenotypic HSC/MPP pool of BM (n = 8), SPL (n = 4), and PB (n = 65). One-way analysis of variance; Tukey’s multiple comparison. Data in panels B and C are given as median ± 95% confidence interval; Kruskal-Wallis and Dunn’s multiple comparison tests. Data in panels F, G, and J are given as mean ± standard deviation. BFU-E, burst forming unit erythroid; CFU-E, colony forming unit erythroid; GEMM, granulocyte, erythrocyte, monocyte, megakaryocyte; GM/M granulocyte monocyte/monocyte; LD; living donor; n.d., not determined; NK, natural killer; OD, organ donor; ns, not significant (P > .05); undiff, undifferentiated.
Not only are early progenitors markedly overrepresented in PB HSPCs compared with BM (Figure 2D), but, unlike in BM, early MEMB progenitors vastly dominate over early My progenitors (Figure 6B; supplemental Figure 7B). We thus tested whether this overrepresentation of nonproliferative early MEMB progenitors is associated with lineage skewing in phenotypic PB HSCs/MPPs. For this, we index-sorted 4 181 single HSCs/MPPs from BM, spleen, and PB and cultured them in medium promoting simultaneous differentiation into My, Ery, Meg, and lymphoid (natural killer) lineages.35 Phenotypic HSCs/MPPs from all tissues gave rise to a range of uni- or oligo-lineage colonies (supplemental Figure 7C-D). Notably, >70% of PB HSC/MPP–derived colonies contained Ery and/or Meg cells, with a particularly high proportion of unilineage Ery colonies, significantly more than in BM and spleen (Figure 6C; supplemental Figure 7D).
Analysis of index-sorting data highlighted a strong positive correlation between the proportions of Ery- or Meg-containing colonies and the percentage of PB HSCs/MPPs expressing high levels of CD71 and low levels of CD34 (Figure 6D; supplemental Figure 7E). Prospective isolation of CD71+CD34lo cells (hereafter termed CD71+ HSCs/MPPs) from the PB HSC/MPP pool (Figure 6E) confirmed that they almost exclusively differentiated toward the Ery/Meg lineage (Figure 6F; supplemental Figure 8A-C), whereas CD71–CD34hi cells (CD71– HSCs/MPPs) had a balanced lineage output. CD71+ HSCs/MPPs clustered in a specific area of extramedullary HSC/MPP cluster 0 in the multitissue landscape (supplemental Figure 8D) and displayed several features distinguishing them from both CD71– HSCs/MPPs and classically defined Ery/Meg progenitors such as common myeloid progenitors (CMPs) and MEPs. Despite being quiescent (supplemental Figure 8E), CD71+ HSCs/MPPs expressed significantly higher levels of Ery/Meg–associated gene sets than CD71– HSCs/MPPs (supplemental Figure 8F; supplemental Tables 3n and 4l-m). CD71+ HSCs/MPPs were delayed in their first division in vitro compared with MEPs (supplemental Figure 8G) and expressed signaling and mitochondrial proteins to levels similar to those of CD71– HSCs/MPPs but significantly lower than CMP/MEPs (supplemental Figure 8H). CD71+ HSCs/MPPs also produced more bi-potent Ery-Meg colonies than MEPs (supplemental Figure 8I), and their serial replating was intermediate between that of CD71– HSCs/MPPs and MEPs (Figure 6G). Only CD71– HSCs/MPPs expressed high levels of CD90 on their cell surface and gave rise to myelo-lymphoid reconstitution in NSG mice, whereas CD71+ HSCs/MPPs were largely CD90– and failed to engraft even in the short term (Figure 6H-I; supplemental Figure 8J-K; supplemental Table 5).
Our data show that, whereas very rare bona fide HSCs do circulate in blood (a small proportion of CD71– HSCs/MPPs), most phenotypic PB HSCs/MPPs are quiescent, lowly active cells committed to the Ery/Meg lineage, with broad molecular similarity to HSCs but no self-renewal capacity in vivo (CD71+ HSCs/MPPs). Strikingly, CD71+ HSCs/MPPs predominate in nonmobilized PB, whereas they are rare in BM and spleen (Figure 6J; supplemental Figure 8L). Altogether, we show that in contrast to BM and spleen, PB HSPC composition is uniquely skewed toward Ery/Meg differentiation both at the HSC/MPP and the progenitor level.
The Ery-Meg skewing of healthy PB HSCs/MPPs is conserved with age but suppressed in disease
Given that aging and disease lead to BM HSC lineage skewing,50,51 we next checked whether the molecular, phenotypic, and functional composition of the PB HSC/MPP pool was perturbed with age. Transcriptionally defined HSCs/MPPs of older PB donors had markedly higher BM- to spleen-type score ratios than younger donors (<35 years) (Figure 7A). Age had no significant effect on: (1) frequencies of phenotypic HSCs/MPPs (Figure 7B); (2) the abundance or function of CD71+ HSCs/MPPs (supplemental Figure 9A-B); or (3) colony formation efficiency or differentiation balance within the entire PB HSCs/MPPs pool (Figure 7C; supplemental Figure 9C). However, PB HSCs/MPPs from older individuals produced significantly smaller Ery colonies than HSCs/MPPs from young donors (Figure 7D), indicating decreased proliferation potential with age. Accordingly, compared with younger donors, PB Ery progenitors from older donors expressed significantly lower levels of Ery lineage master regulators (GATA-1, KLF, and MYC) and genes of the CDK4-6/cyclin D complex, key for cell cycle progression as well as Ery differentiation52 (Figure 7E; supplemental Table 3o-p).
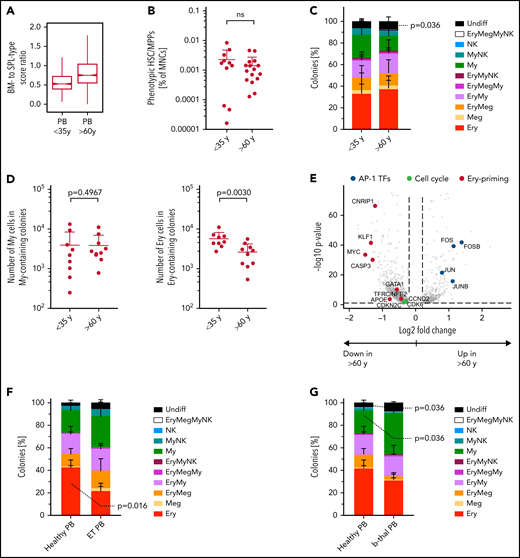
PBs unique erythroid/megakaryocyte–biased differentiation output becomes imbalanced with age and disease. (A) Ratio between BM- and spleen (SPL)-type identity scores in PB HSCs/MPPs according to age group. Notches indicate the 95% confidence interval of the median (middle line). (B) Frequencies of phenotypic HSCs/MPPs (CD19–CD34+CD38–CD45RA–) in PB mononuclear cells (MNCs) by age group (n = 27, same data as in supplemental Figure 1B). (C) Percentage of colonies generated by single-cell–sorted phenotypic HSCs/MPPs from nonmobilized PB (same as in Figure 6C), grouped by age: <35 years, n = 942 single cells from 9 independent PBs; >60 years, n = 700 single cells from 8 independent PBs. (D) Median size of all My colonies (My, left) and all erythroid colonies (Ery, right) generated from nonmobilized PB HSCs/MPPs, grouped according to age as in panel C. (E) Volcano plot showing selected genes differentially expressed (false discovery rate <0.05) in Ery progenitors (cluster 8) of PB donors aged <35 years and aged >60 years. (F) Percentage of colonies generated by single-cell sorted phenotypic HSCs/MPPs from nonmobilized PB of healthy individuals (n = 445 cells, 5 individuals) and patients with ET (n = 349 cells, 5 individuals) over 5 experiments. (G) Percentage of colonies generated by single-cell sorted phenotypic HSCs/MPPs from nonmobilized PB of healthy individuals (same as in panel F) and patients with β-thalassemia (b-thal) (n = 271 cells, 3 individuals) over 3 experiments. Data in panels B, C, D, F, and G are given as mean ± standard deviation. Two-tailed Mann-Whitney U test. Undiff, undifferentiated; Meg, megakaryocyte; NK, natural killer; ns, not significant; Undiff, undifferentiated.
PBs unique erythroid/megakaryocyte–biased differentiation output becomes imbalanced with age and disease. (A) Ratio between BM- and spleen (SPL)-type identity scores in PB HSCs/MPPs according to age group. Notches indicate the 95% confidence interval of the median (middle line). (B) Frequencies of phenotypic HSCs/MPPs (CD19–CD34+CD38–CD45RA–) in PB mononuclear cells (MNCs) by age group (n = 27, same data as in supplemental Figure 1B). (C) Percentage of colonies generated by single-cell–sorted phenotypic HSCs/MPPs from nonmobilized PB (same as in Figure 6C), grouped by age: <35 years, n = 942 single cells from 9 independent PBs; >60 years, n = 700 single cells from 8 independent PBs. (D) Median size of all My colonies (My, left) and all erythroid colonies (Ery, right) generated from nonmobilized PB HSCs/MPPs, grouped according to age as in panel C. (E) Volcano plot showing selected genes differentially expressed (false discovery rate <0.05) in Ery progenitors (cluster 8) of PB donors aged <35 years and aged >60 years. (F) Percentage of colonies generated by single-cell sorted phenotypic HSCs/MPPs from nonmobilized PB of healthy individuals (n = 445 cells, 5 individuals) and patients with ET (n = 349 cells, 5 individuals) over 5 experiments. (G) Percentage of colonies generated by single-cell sorted phenotypic HSCs/MPPs from nonmobilized PB of healthy individuals (same as in panel F) and patients with β-thalassemia (b-thal) (n = 271 cells, 3 individuals) over 3 experiments. Data in panels B, C, D, F, and G are given as mean ± standard deviation. Two-tailed Mann-Whitney U test. Undiff, undifferentiated; Meg, megakaryocyte; NK, natural killer; ns, not significant; Undiff, undifferentiated.
Next, we assessed whether the unique lineage-skewing of PB is affected by disease. Given recent reports of Meg bias in myelofibrosis and essential thrombocythemia (ET) BM HSCs,53-55 we measured the phenotypic (supplemental Figure 9D) and functional composition of circulating PB HSCs/MPPs from patients with ET. ET PB HSCs/MPPs showed a shifted differentiation balance, with significantly decreased proportions of Ery colonies compared with healthy PB (Figure 7F), independently of the JAK2 mutational status of individual cells within the sample (supplemental Figure 9E). Interestingly, increased My production at the expense of the Ery lineage was also observed in PB HSCs/MPPs of anemic patients with β-thalassemia (Figure 7G; supplemental Figure 9F). These data suggest that disease-driven microenvironmental changes and/or BM hematopoietic dysfunction lead to a shift in the differentiation balance of PB HSCs/MPPs across a range of diseases, opening the way for new clinical diagnostic strategies.
Discussion
Here we report largely distinct HSPC compositions in human BM and extramedullary sites. Unlike BM, PB and spleen are not sites of active hematopoiesis at steady state. Instead, they harbor poised cellular reservoirs centered around quiescent but lineage-primed HSCs/MPPs and early progenitors with suppressed proliferation. Extramedullary HSPCs remain capable of expansion differentiation, both in vitro and in vivo, as shown here in the context of chronic anemia–induced stress erythropoiesis. Our data provide proof-of-principle evidence of participation, albeit likely limited, of spleen HSPCs to human demand-adapted hematopoiesis.
Major challenges to the functional characterization of human extramedullary HSPCs are their inherent rarity and sampling within ethical guidelines (ie, requirement for large PB volumes and invasiveness of spleen sampling). We have overcome some of these limitations by using single-cell methods and by leveraging tissue collection from ODs and healthy living donors wherever ethically possible (BM and PB). We observed slight changes between OD and living donor–derived hematopoietic tissues (supplemental Note 1), likely originating from traumatic death circumstances leading to pro-inflammatory cytokine56,57 and catecholamine58,59 release. We therefore cannot exclude that some molecular features observed here in OD spleen are influenced by death-induced cellular responses. Importantly, however, all key features of extramedullary HSPCs were observed independently of sample source and with effect sizes well beyond those observed for differences between organ and living donors. Hence, we infer that, collectively, our data highlight general inter-tissue differences of physiological relevance.
We provide evidence that rare but transplantable HSCs/MPPs exist in human PB, only so far postulated from mouse models,5 and define a transcriptional identity for PB, mPB, and spleen HSCs/MPPs, indicative of their biology. Collectively, our data indicate that most extramedullary HSCs/MPPs are of the short-term HSC, lineage-primed type. They also differ from their BM counterparts in genes and cell surface proteins linked to activation, cell adhesion, and cytoskeleton reorganization. The latter may confer increased motility60-63 and loss in cell polarity and HSC function, similar to that of aged mouse HSCs,64 and/or lead to changes in extramedullary HSCs/MPPs lineage-priming.65 Many of these features are also observed in mPB HSCs, suggesting they are acquired rapidly upon mobilization, hence likely due to either the loss of interaction with the BM niche10 or the effects of G-CSF itself. Future work will have to develop new tools to study how the dynamics of HSC/MPP tissue residency links to the acquisition of specific extramedullary features.
We also report a unique functional bias of PB HSPCs toward erythropoiesis. This is initiated at the HSC/MPP level and driven by Ery/Meg–biased CD71+ HSC-like cells almost exclusively found in PB. CD71 is an early marker for HSC activation66 and Ery differentiation, used to enrich human Ery and/or Meg-primed CMP/MEP populations from numerous tissues across development.36,43,48,67 However, in adult human BM and spleen, <15% of phenotypic HSCs/MPPs contain CD71+ cells. Predominance of CD71+ HSCs/MPPs in homeostatic PB may thus reflect either enhanced BM egress relative to other HSC/MPP subsets, or functional biases induced by a changing environment, including adaptation to different iron levels.68,69 Collectively, we identify a circulating reservoir of adult MPPs/progenitors, likely seeding spleen, skin, and/or lung in which erythropoiesis and megakaryopoiesis have, respectively, been observed under stress conditions.3,70
Nonmobilized PB is by far the easiest to sample of all hematopoietic tissues. Hence, it is ideally suited for early diagnosis, prevention, and patient management in disease, hematologic or not, bypassing the needs for invasive tissue biopsies. To date, the clinical potential for PB HSPC screening remains untapped, largely due to lack of understanding of circulating HSPC biology. Here we have established a healthy HSPC baseline in humans and shown phenotypic and functional imbalances in circulating HSCs/MPPs from the elderly and in patients with ET and β-thalassemia. Recently, we also reported My-skewing in PB progenitors from patients with chronic lymphocytic leukemia.71 With single-cell technologies becoming increasingly embedded into clinical protocols, our data warrant further investigation of PB HSPC subsets in large cohorts of patients at high resolution, with the purpose of identifying novel diagnostic or monitoring biomarkers.
Acknowledgments
The authors thank the deceased donors, their families, and the Cambridge Biorepository for Translational Medicine for access to human tissue (BM, PB, and spleen samples), Rachel Linger for consenting platelet donors, Dr Anna Godfrey for provision of ET patient samples, the Cambridge Blood and Stem Cell Biobank (specifically, Joanna Baxter and the team of nurses consenting and collecting PB samples from living donors), Andrew Hindmarsh and Ayesha Noorani for collecting HS spleen tissues, the Cambridge National Institute of Health Research (NIHR) BRC Cell Phenotyping Hub for their flow cytometry services and advice, the Cancer Research UK (CRUK) Cambridge Institute genomics centre for sequencing, Irina Mohorianu and her team for help with bioinformatic datasets, and Akifumi Kiyota at the International Research Center for Medical Sciences, Kumamoto University, for technical assistance in the CyTOF experiments.
E.L. is supported by a Sir Henry Dale fellowship from Wellcome/Royal Society (107630/Z/15/Z). Research in the laboratory of E.L. is supported by Wellcome (107630/Z/15/Z), Biotechnology and Biological Sciences Research Council (BB/P002293/1), European Hematology Association, the Britain Israel Research and Academic Exchange Partnership (BIRAX), and Royal Society. Research in the laboratories of E.L. and B.G. is supported by core support grants by Wellcome and Medical Research Council (MRC) to the Wellcome-MRC Cambridge Stem Cell Institute (203151/Z/16/Z). This research was funded in whole, or in part, by the Wellcome Trust. Research in the laboratory of H.T. is supported by KAKEN Grant-in-Aid for Scientific Research for Young Scientists (A) (15H05669), Early-Career Scientists (19K17833), and challenging Exploratory Research (18K19520). N.M. was supported by the Japan Society for the Promotion of Science Short-term Postdoctoral Fellowship and a Deutsche Forschungsgemeinschaft (DFG) Research Fellowship (ME 5209/1-1), N.K.W. and B.G. were supported by grants from Blood Cancer UK (18002), Wellcome (206328/Z/17/Z), CRUK (C1163/A21762), and MRC (MR/S036113/1). A.C. is supported by Wellcome, A.S. by a Cambridge Cancer Centre fellowship, E.M. by a Wellcome Fellowship, L.J. by NIHR, and K.T.M. by the Chan Zuckerberg Initiative. M.H. is funded by Wellcome (107931/Z/15/Z), The Lister Institute for Preventive Medicine, and NIHR and Newcastle-Biomedical Research Centre. F.M.-A. is supported by grants from ETH Zurich (PHRT 2018-421), University of Zurich (FtG 2016-18), Zurich Cancer League, and Promedica. M.F. is supported by the British Heart Foundation via a basic science senior fellowship (FS/18/53/33863). G.F. and M.R.L. are supported by Telethon San Raffaele–Telethon Institute for Gene Therapy Core Grant (2016-2021).
Authorship
Contribution: N.M. and E.L. conceptualized the study; N.M., A.S., N.K.W., A.C., V.C., E.F.C., G.M., T.M., F.M.-A. and K.T.M. provided the methodology; N.M., H.P.B., K.S., M.Q.L., L.J., and E.L. performed the formal analysis; N.M., A.S., N.K.W., A.C., V.C., E.F.C., G.M., D.H., T.M., F.M.-A., and K.T.M. performed the investigations; E.M., K.S.-P., M.R.L., G.F., and M.F. provided the resources; N.M., H.P.B., and E.L. wrote the first draft; N.M., H.P.B., and E.L. wrote and edited the review; N.M., H.B. and E.L. visualized the study; G.F., M.H., H.T., K.S.-P., B.G., M.F., and E.L. supervised the study; E.L. were the project administrators; and B.G., M.H., and E.L acquired the funding.
Conflict-of-interest disclosure: The authors declare no competing financial interests.
Correspondence: Elisa Laurenti, Jeffrey Cheah Biomedical Centre, Puddicombe Way, Cambridge CB2 0AW, United Kingdom; e-mail: el422@cam.ac.uk.
Sequencing files and metadata associated with 10X Genomics single-cell RNA-sequencing are deposited at the European Nucleotide Archive, accessible via BioStudies (identifiers SUBS4 and SUBS10): https://www.ebi.ac.uk/biostudies/studies/S-SUBS4, https://www.ebi.ac.uk/biostudies/studies/S-SUBS10, or via Gene Expression Omnibus (accession number GSE190067). The data can also be explored by the interactive Web portals: http://bioinf.stemcells.cam.ac.uk:3838/laurenti/ExtramedHSPCs. amd http://bioinf.stemcells.cam.ac.uk:3838/laurenti/mobPB_HSPCs/. Data from Smart-seq2 data sets are available at Gene Expression Omnibus with accession numbers GSE143567 (BM/spleen phenotypic HSCs/MPPs) and GSE131409 and associated superseries (CD71–/CD71+ HSCs/MPPs). All code is publicly available at https://github.com/elisa-laurenti/ExtramedHSPC.
The online version of this article contains a data supplement.
There is a Blood Commentary on this article in this issue.

This feature is available to Subscribers Only
Sign In or Create an Account Close Modal