

Key Points
RIG-I inhibition protects the ATRA- and inflammation-induced stressed stromal niche during HSC engraftment.
RIG-I regulates BMSC function by altering the RIG-I-Trim25-Keap1-NRF2 complex.

Abstract
Bone marrow–derived mesenchymal stem cells (BMSCs) support bone formation and constitute the stromal niche in regulating hematopoietic stem cells (HSCs). Stromal niche dysfunction affects HSC engraftment during transplantation; however, the underlying mechanisms remain elusive. In the present study, we found that all-trans retinoic acid (ATRA) and inflammation stress upregulated retinoic acid–inducible gene I (RIG-I) in BMSCs. Excess RIG-I expression damaged the clonogenicity, bone-forming ability of BMSCs and particularly their stromal niche function that supports HSC expansion in vitro and engraftment in vivo. Mechanistically, RIG-I elevation promoted the degradation of NRF2, a checkpoint for antioxidant cellular response, by altering the RIG-I-Trim25-Keap1-NRF2 complex, leading to reactive oxygen species (ROS) accumulation and BMSC damage. Genetic inhibition of RIG-I sustained NRF2 protein levels and reduced ROS levels in ATRA-treated BMSCs, thus preserving their clonogenicity, bone-forming ability, and stromal niche function in supporting HSC engraftment in mice. More importantly, RIG-I inhibition recovered the ATRA-treated stromal niche function to enhance HSC engraftment and emergency myelopoiesis for innate immunity against the bacterium Listeria monocytogenes during transplantation. Overall, we identified a noncanonical role of RIG-I in the regulation of the stromal niche for HSC transplantation.
Introduction
Hematopoietic stem cell transplantation (HSCT) serves as a life-saving treatment for hematopoietic malignancies, aplastic anemia, and other diseases.1-3 However, patients after transplant have myelosuppression, and delayed hematologic recovery or graft failure increases the risk of infection and hemorrhage.4,5 Bone marrow–derived mesenchymal stem/stromal cells (BMSCs) form a critical cellular component of the stromal niche to support HSC maintenance and engraftment after transplantation.6-8 BMSCs generate fibroblastic colonies (colony-forming unit–fibroblasts [CFU-F]); differentiate into adipocytes, osteoblasts, and chondrocytes in vitro9,10; and support bone formation in vivo.11-13 Furthermore, BMSCs are the primary source of growth factors that support HSC maintenance, regeneration, and engraftment.7,14,15 Transplantation of BMSCs facilitates HSCT by recovering the damaged stromal niche in murine and human studies.16-18 However, the mechanism of sustaining BMSC function remains elusive.
A range of insults, including infection and inflammation, radiation, and drug treatments, interfere with BMSCs and subsequently affect HSCT.19 All-trans retinoic acid (ATRA), the acid form of vitamin A, activates retinoic acid receptors (RARs)20,21 in embryonic development, neural differentiation,22,23 HSC regulation,24-27 and cancer treatment.28 ATRA and ATRA-based combination therapies are used to treat acute promyelocytic leukemia29 and other hematologic diseases.30-32 Furthermore, RARγ deletion in stromal cells causes myeloproliferative syndrome in mice.33 Therefore, it is important to explore how ATRA treatment regulates BMSC function in bone formation and stromal niche function to support HSCs. ATRA upregulates retinoic acid–inducible gene I (RIG-I), to inhibit proliferation and impact the stemness in leukemia cells34-36; interestingly, genetic deletion of Rig-I leads to progressive myeloproliferative disorder in mice.37 Furthermore, inflammation stress activates RIG-I as an interferon (IFN)-stimulated gene to recognize viral RNA in the cytoplasm and initiate an antiviral response.34,38 Whether ATRA treatment or inflammation-induced RIG-I upregulation influences BMSC function remains unclear.
In the present study, we demonstrated that ATRA and inflammation stress upregulated RIG-I in BMSCs, which led to suppression of nuclear factor erythroid 2-related factor 2 (NRF2) and damaged the functions of BMSCs related to bone formation and stromal niche formation, for supporting HSCT.
Materials and methods
Mice
Rig-I knockout mice were previously described.37LepR-Cre, R26-tdTomato, and Scf-GFP mice were purchased from the Jackson Laboratory. All mouse strains used in this study were 8 to 12 weeks old with a C57BL/6J genetic background. ATRA (R2625, 0.3 mg per mouse; Sigma) or corn oil control was intraperitoneally injected every 3 days as indicated. Parathyroid hormone (1-34) (A1129, 80 μg/kg body weight; APExBIO), NAC (HY-B0215, 130 μg/kg body weight; MCE), or phosphate-buffered saline (vehicle control) was intraperitoneally injected as indicated. A total of 1 × 10⁴ CFUs of Listeria monocytogenes (10403s) was intravenously injected, and lipopolysaccharide (LPS) (L2880, 1 mg/kg body weight; Sigma) was intraperitoneally injected as indicated. Animals were blindly included in the experiments according to genotyping results. All animal experiments were performed according to protocols approved by the Institutional Animal Care and Use Committee.
BMSC culture
BMSCs were cultured in Dulbecco’s modified Eagle medium low-glucose medium (CORNING) with 20% fetal bovine serum (Gibco) and 10 µM Rho kinase (ROCK) inhibitor (S1049; Selleck).
In vivo stromal niche function analysis
CD45.1+ bone marrow (BM) cells (1 × 10⁶) were transplanted into lethally irradiated C57BL/6J, Rig-I+/+, or Rig-I−/− mice, which were pretreated with corn oil or ATRA every 3 days for 6 times within 15 days as indicated. After an 8-week recovery, CD45.1+ BM cells in the recipients were analyzed, and 1 × 10⁶ recovered CD45.1+ BM cells were transplanted into secondary lethally irradiated CD45.2+ recipient mice with 2 × 10⁵ CD45.2+ fresh BM cells.
Transplantation and repopulation assay
Adult recipient mice were irradiated with an Orthovoltage X-ray source delivering approximately 2 equal doses of 4.5 Gy at least 3 hours apart. Peripheral blood was collected from the tail vein every 4 weeks after the transplantation.
Results
Retinoic acid impairs the clonogenicity and differentiation capacities of BMSCs
RNA sequencing (RNA-seq) analysis showed that ATRA treatment significantly upregulated RA-responsive genes but downregulated osteogenesis-, adipogenesis-, and chondrogenesis-related genes in BMSCs (Figure 1A). Furthermore, ATRA treatment reduced the CFU-F activity of BMSCs (Figure 1B) and inhibited their differentiation capacities in osteogenesis (Figure 1C), adipogenesis (Figure 1D), and chondrogenesis (Figure 1E), which was further confirmed by the decreased expression of osteogenesis-, adipogenesis-, and chondrogenesis-related genes in BMSCs during induced differentiation (supplemental Figure 1A-C, available on the Blood Web site).

Retinoic acid impairs the clonogenicity and differentiation capacities of BMSCs. (A) Heatmap of gene expressions in control or ATRA-treated BMSCs. (B) Representative images (i) and quantification (ii) of CFU-F colonies formed by BMSCs pretreated with ATRA, as indicated; n = 6 biologically independent replicates. (C) Alizarin red S staining (i) and quantification (ii) in BMSCs after induced osteoblastic differentiation. The osteogenic medium was administrated with vehicle or ATRA, as indicated; n = 3 biologically independent replicates. (D) Oil red O staining (i) and quantification (ii) in BMSCs after induced adipogenic differentiation; n = 3 biologically independent replicates. (E) Alcian blue staining (i) and quantification (ii) in BMSCs after induced chondrogenic differentiation; n = 3 biologically independent replicates. (F) Outline of the experimental strategy (i). Representative fluorescence-activated cell sorter (FACS) plots (ii) and quantification (iii) of BMSCs from control or ATRA-treated mice; n = 5 mice per group. (G) Cell death of BMSCs treated with vehicle or ATRA for 48 hours; n = 4 biologically independent replicates. (H) Outline of the experimental strategy (i). Representative FACS plots (ii) and quantification (iii) of Lepr-Cre; tdTomato+ BMSCs from control or ATRA-treated LepR-Cre; tdTomato mice; n = 4 mice per group. (I) Representative images (i) and quantitative measurements of micro-CT analysis (ii) of femurs from control or ATRA-treated mice, as indicated; n = 6 mice per group. (J) Schematic of experimental strategy and fracture sites (left). Representative confocal z-stack projection montages from the callus at the fracture sites in control or ATRA-treated LepR-Cre; tdTomato mice, at 2 weeks after fracturing. The co-localization (yellow) of Tomato (red) and OPN (green) (right, top) as well as Tomato (red) and SOX9 (green) (right, bottom). Error bars indicated mean ± standard deviation (SD). Two-tailed Student t tests were used to assess statistical significance (F-I). *P < .05; **P < .01; ***P < .001. Repeated-measures 1-way (B-E) analysis of variance (ANOVA) followed by Dunnett’s test for multiple comparisons, ‡P < .05; ‡‡P < .01; ‡‡‡P < .001; ‡‡‡‡P < .0001.
Retinoic acid impairs the clonogenicity and differentiation capacities of BMSCs. (A) Heatmap of gene expressions in control or ATRA-treated BMSCs. (B) Representative images (i) and quantification (ii) of CFU-F colonies formed by BMSCs pretreated with ATRA, as indicated; n = 6 biologically independent replicates. (C) Alizarin red S staining (i) and quantification (ii) in BMSCs after induced osteoblastic differentiation. The osteogenic medium was administrated with vehicle or ATRA, as indicated; n = 3 biologically independent replicates. (D) Oil red O staining (i) and quantification (ii) in BMSCs after induced adipogenic differentiation; n = 3 biologically independent replicates. (E) Alcian blue staining (i) and quantification (ii) in BMSCs after induced chondrogenic differentiation; n = 3 biologically independent replicates. (F) Outline of the experimental strategy (i). Representative fluorescence-activated cell sorter (FACS) plots (ii) and quantification (iii) of BMSCs from control or ATRA-treated mice; n = 5 mice per group. (G) Cell death of BMSCs treated with vehicle or ATRA for 48 hours; n = 4 biologically independent replicates. (H) Outline of the experimental strategy (i). Representative FACS plots (ii) and quantification (iii) of Lepr-Cre; tdTomato+ BMSCs from control or ATRA-treated LepR-Cre; tdTomato mice; n = 4 mice per group. (I) Representative images (i) and quantitative measurements of micro-CT analysis (ii) of femurs from control or ATRA-treated mice, as indicated; n = 6 mice per group. (J) Schematic of experimental strategy and fracture sites (left). Representative confocal z-stack projection montages from the callus at the fracture sites in control or ATRA-treated LepR-Cre; tdTomato mice, at 2 weeks after fracturing. The co-localization (yellow) of Tomato (red) and OPN (green) (right, top) as well as Tomato (red) and SOX9 (green) (right, bottom). Error bars indicated mean ± standard deviation (SD). Two-tailed Student t tests were used to assess statistical significance (F-I). *P < .05; **P < .01; ***P < .001. Repeated-measures 1-way (B-E) analysis of variance (ANOVA) followed by Dunnett’s test for multiple comparisons, ‡P < .05; ‡‡P < .01; ‡‡‡P < .001; ‡‡‡‡P < .0001.
To investigate how ATRA regulates BMSCs in vivo, we injected wild-type C57BL/6J mice with ATRA. Notably, ATRA injection significantly reduced the number of BMSCs as identified by the expression of PDGFRα39 and CD5140 (Figure 1F) because of increased cell death (Figure 1G). Consistently, ATRA treatment reduced the number of LepR+ BMSCs in Lepr-Cre;tdTomato reporter mice41 (Figure 1H). As BMSCs represent the major source of cells for bone formation, we performed microcomputed tomography (micro-CT) analysis and found that ATRA treatment significantly decreased the ratio of bone volume, trabecular number, and connectivity density but increased the trabecular spacing and structure model index in the distal femur metaphysis (Figure 1I). Osteopontin (OPN)-expressing bone cells consistently decreased by 69% in the distal femur metaphysis after ATRA treatment (supplemental Figure 1D). We further introduced mid-diaphyseal femur fracture in Lepr-Cre;tdTomato reporter mice, to investigate the regeneration ability of BMSCs after ATRA treatment. Notably, Tomato+ BMSCs produced considerably fewer OPN+ bone cells and Sox9+ chondrocytes in ATRA-treated mice at 2 weeks after bone fracture (Figure 1J). Moreover, ATRA treatment also reduced ovariectomy-induced adipogenesis in mice (supplemental Figure 1E).
Retinoic acid impairs the stromal niche function in supporting HSC engraftment during transplantation
We observed that serial ATRA injections damaged BMSCs, impaired HSC quiescence, and reduced HSC pool size in vivo (supplemental Figure 2A-H), whereas ATRA treatment increased HSC quiescence in vitro (supplemental Figure 2I), suggesting that ATRA might influence the stromal niche function. To evaluate the in vivo effect of ATRA in regulating the stromal niche for HSCT, we carried out a transplantation assay to measure the recovery of donor-derived hematopoiesis in ATRA-treated recipients. Fresh bone marrow mononuclear cells (BMNCs, CD45.1+) were transplanted into lethally irradiated recipient mice, which were pretreated with ATRA or vehicle control (Figure 2A). ATRA-pretreated recipients showed lower recovery of CD45.1+ donor-derived long-term HSCs (LT-HSCs; Lin–Sca1+c-KIT+CD34–FLK2–) and HSCs (Lin–Sca1+c-KIT+CD48–CD150+) at 8 weeks after transplantation, but donor-derived short-term HSCs and multipotent progenitors did not show significant differences (Figure 2B). Donor-derived HSCs showed impaired quiescence in ATRA-pretreated recipients (Figure 2C). Furthermore, we performed a competitive repopulation assay using BMNCs (CD45.1+), which were recovered in ATRA-pretreated recipients or control recipients for 8 weeks, together with fresh competitor BMNCs (CD45.2+), to transplant into wild-type recipients (CD45.2+; Figure 2A). BMNCs recovered in the ATRA-pretreated recipients showed significantly lower engraftment during the 16-week observation in all 3 lineages (Figure 2D) and reduced donor-derived hematopoietic stem and progenitor cells at 4 weeks after transplantation (Figure 2E-F) than did BMNCs recovered in control recipients. These results indicated that ATRA treatment might damage the stromal niche for HSC engraftment. Furthermore, BMSCs could not recover their number and function to support the HSCs until 4 weeks after ATRA treatment (supplemental Figure 2J-P), suggesting that ATRA treatment had a sustained effect on HSC niche damage. We also noticed that, after transplantation, parathyroid hormone treatment recovered bone loss but not HSC engraftment in ATRA-pretreated recipients (supplemental Figure 2Q-U), suggesting that ATRA treatment might affect the stromal niche, independent of interfering osteoblasts.
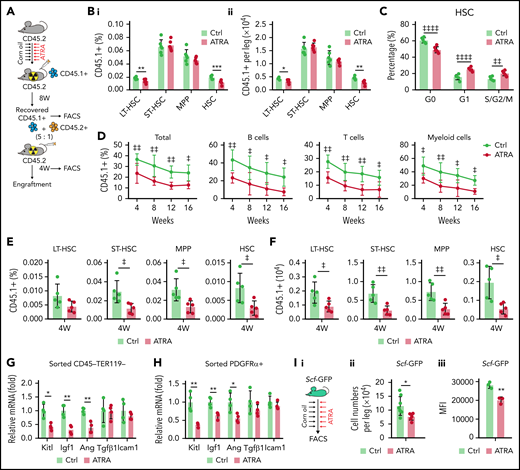
Retinoic acid impairs the hematopoietic stem cell niche function of BMSCs. (A) Schematic of experimental design for in vivo HSC niche function after ATRA treatment. Wild-type CD45.2+ mice, pretreated with vehicle or ATRA, consecutively 6 times, were lethally irradiated and transplanted with 1 × 10⁶ CD45.1+ BMNCs for recovery. After 8 weeks of recovery, 1 × 10⁶ recovered CD45.1+ BMNCs were mixed with 2 × 10⁵ fresh CD45.2+ BMNCs for competitive reconstitution analysis. (B-C) The percentage (i) and absolute numbers (ii) of CD45.1+ donor-derived hematopoietic stem and progenitor cells (HSPCs) (B) and cell cycle of engrafted CD45.1+HSCs (C) in the BM after an 8-week recovery in recipients pretreated with vehicle or ATRA, as indicated; n = 6 mice per group. (D) Engraftment analysis of total engrafted CD45.1+ donor cells (Total), B cells (B220+), T cells (CD3+), and myeloid cells (Gr1+Mac1+) at indicated weeks after transplantation; n = 3 donor mice per group and 6 recipient mice per group. (E-F) The percentage (E) and absolute numbers (F) of CD45.1+ donor-derived HSPCs in the BM of recipients at 4 weeks after secondary transplantation; n = 5 mice per group. (G-H) Quantitative polymerase chain reaction (qPCR) analysis of niche factors in sorted CD45–Ter119– stromal cells (G) and PDGFRα+ BMSCs (H) from control and ATRA-treated mice, respectively; n = 4 mice per group. (I) Schematic of experimental design for Scf-GFP mice treated with ATRA or control vehicle (i); absolute numbers (ii; Ctrl mice n = 8, ATRA-treated mice n = 6), and GFP mean fluorescence intensity (iii, n = 3 mice) of CD45–Ter119–CD31–Scf-GFP+ cells in Scf-GFP mice treated with vehicle or ATRA, as indicated. (J) Schematic of experimental design for HSC in vitro expansion when cocultured with BMSCs pretreated with vehicle or ATRA, as indicated. (K) Absolute numbers of in vitro–expanded LT-HSCs, as indicated; n = 3 biologically independent replicates. (L) Engraftment analysis of total engrafted CD45.1+ donor cells (Total), B cells (B220+), T cells (CD3+), and myeloid cells (Gr1+Mac1+) at indicated weeks after transplantation; n = 3 donor mice and n = 5-6 recipient mice per group. (M) Schematic of experimental design for HSC cotransplantation with BMSCs sorted from control or ATRA-pretreated mice, as indicated; as seen in panels N to P. (N) Representative images of LepR-Cre; tdTomato+ intrafemur-injected BMSCs in the BM at 2 weeks after injection; Tomato (red), CD150 (green), and lineage/CD48 (blue) (scale bar, 15 µm). (O) The percentage (i) and absolute numbers (ii) of engrafted CD45.1+ donor-derived HSPCs in recipients at 8 weeks after transplantation (n = 4–5 mice). (P) The recovery of hematopoietic mononuclear cells in the peripheral blood of recipients at 4 weeks after transplantation. Error bars indicated mean ± SD. Two-tailed Student t tests were used to assess statistical significance (B, E, F, G, H, I, and O). *P < .05; **P < .01; ***P < .001. Repeated-measures 2-way ANOVA (C, D, L, and P) followed by Dunnett’s test for multiple comparisons, ‡P < .05; ‡‡P < .01; ‡‡‡P < .001; ‡‡‡‡P < .0001. LT-HSC, long-term HSC; ST-HSC, short-term HSC; MPP, multipotent progenitor.
Retinoic acid impairs the hematopoietic stem cell niche function of BMSCs. (A) Schematic of experimental design for in vivo HSC niche function after ATRA treatment. Wild-type CD45.2+ mice, pretreated with vehicle or ATRA, consecutively 6 times, were lethally irradiated and transplanted with 1 × 10⁶ CD45.1+ BMNCs for recovery. After 8 weeks of recovery, 1 × 10⁶ recovered CD45.1+ BMNCs were mixed with 2 × 10⁵ fresh CD45.2+ BMNCs for competitive reconstitution analysis. (B-C) The percentage (i) and absolute numbers (ii) of CD45.1+ donor-derived hematopoietic stem and progenitor cells (HSPCs) (B) and cell cycle of engrafted CD45.1+HSCs (C) in the BM after an 8-week recovery in recipients pretreated with vehicle or ATRA, as indicated; n = 6 mice per group. (D) Engraftment analysis of total engrafted CD45.1+ donor cells (Total), B cells (B220+), T cells (CD3+), and myeloid cells (Gr1+Mac1+) at indicated weeks after transplantation; n = 3 donor mice per group and 6 recipient mice per group. (E-F) The percentage (E) and absolute numbers (F) of CD45.1+ donor-derived HSPCs in the BM of recipients at 4 weeks after secondary transplantation; n = 5 mice per group. (G-H) Quantitative polymerase chain reaction (qPCR) analysis of niche factors in sorted CD45–Ter119– stromal cells (G) and PDGFRα+ BMSCs (H) from control and ATRA-treated mice, respectively; n = 4 mice per group. (I) Schematic of experimental design for Scf-GFP mice treated with ATRA or control vehicle (i); absolute numbers (ii; Ctrl mice n = 8, ATRA-treated mice n = 6), and GFP mean fluorescence intensity (iii, n = 3 mice) of CD45–Ter119–CD31–Scf-GFP+ cells in Scf-GFP mice treated with vehicle or ATRA, as indicated. (J) Schematic of experimental design for HSC in vitro expansion when cocultured with BMSCs pretreated with vehicle or ATRA, as indicated. (K) Absolute numbers of in vitro–expanded LT-HSCs, as indicated; n = 3 biologically independent replicates. (L) Engraftment analysis of total engrafted CD45.1+ donor cells (Total), B cells (B220+), T cells (CD3+), and myeloid cells (Gr1+Mac1+) at indicated weeks after transplantation; n = 3 donor mice and n = 5-6 recipient mice per group. (M) Schematic of experimental design for HSC cotransplantation with BMSCs sorted from control or ATRA-pretreated mice, as indicated; as seen in panels N to P. (N) Representative images of LepR-Cre; tdTomato+ intrafemur-injected BMSCs in the BM at 2 weeks after injection; Tomato (red), CD150 (green), and lineage/CD48 (blue) (scale bar, 15 µm). (O) The percentage (i) and absolute numbers (ii) of engrafted CD45.1+ donor-derived HSPCs in recipients at 8 weeks after transplantation (n = 4–5 mice). (P) The recovery of hematopoietic mononuclear cells in the peripheral blood of recipients at 4 weeks after transplantation. Error bars indicated mean ± SD. Two-tailed Student t tests were used to assess statistical significance (B, E, F, G, H, I, and O). *P < .05; **P < .01; ***P < .001. Repeated-measures 2-way ANOVA (C, D, L, and P) followed by Dunnett’s test for multiple comparisons, ‡P < .05; ‡‡P < .01; ‡‡‡P < .001; ‡‡‡‡P < .0001. LT-HSC, long-term HSC; ST-HSC, short-term HSC; MPP, multipotent progenitor.
As BM niche cells produce multiple growth factors to support HSCs, our transcriptional data further showed that ATRA treatment significantly reduced the expression of multiple niche factors, including stem cell factor (Scf, Kitl), insulin-like growth factor 1 (Igf1), and angiogenin (Ang) in sorted CD45–Ter119– stromal cells (Figure 2G) and PDGFRα+ BMSCs (Figure 2H). To further confirm this, we used Scfgfp knock-in mice42 and found that the frequency of Scf-GFP+ cells and Scf-GFP intensity were reduced in BMSCs after ATRA treatment (Figure 2I; supplemental Figure 2V-X). However, ATRA treatment did not influence the cell number or niche factor expression in endothelial cells (supplemental; Figure 2Y-Z).
We next evaluated the ability of ATRA-treated BMSCs to maintain and expand functional HSCs in vitro (Figure 2J). Compared with HSCs without stromal cell support, BMSCs efficiently expanded HSCs in serum-free media in vitro. However, ATRA-treated BMSCs lost their ability to support HSC expansion in vitro (Figure 2K). We further conducted competitive transplantation to assess the ability of BMSCs to support the self-renewal function of in vitro–expanded HSCs. HSCs cocultured with BMSCs showed greater repopulation capacity at 16 weeks after transplantation in all 3 lineages than HSCs without BMSC support. However, with respect to repopulation, HSCs cocultured with ATRA-pretreated BMSCs did not differ from HSCs without stromal cell support (Figure 2L).
Furthermore, we explored the role of BMSCs in supporting HSC engraftment during transplantation (Figure 2M). Intrafemur-injected BMSCs infused into the BM niche (Figure 2N) facilitated HSC engraftment (Figure 2O) and promoted the recovery of hematopoietic mononuclear cells in the peripheral blood (Figure 2P). However, BMSCs from ATRA-treated mice completely lost their ability to support HSC engraftment and hematopoietic recovery (Figure 2O-P).
Overall, ATRA impairs the HSC niche function of BMSCs in supporting HSC expansion in vitro and recovery of hematopoiesis after transplantation in vivo.
Retinoic acid inhibits NRF2 to increase reactive oxygen species levels and impair the function of BMSCs
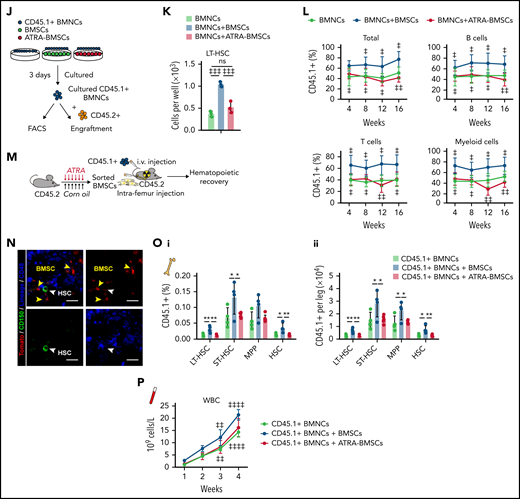
To explore the molecular insights of ATRA-treated BMSCs, we analyzed the RNA-seq data and found that in vitro ATRA treatment robustly reduced expression of genes involved in bone morphogenesis, chondrocyte development, wound healing, and HSC regulation but increased expression of oxidative stress– and cell death–associated genes in BMSCs (Figure 3A-B). In line with this, after ATRA treatment, the BMSCs showed increased reactive oxygen species (ROS) levels in 2',7'-dichlorodihydrofluorescein diacetate (H2DCFDA) staining43 (Figure 3C). ROS accumulation impairs the stem cell properties of BMSCs,44,45 and the CFU-F activity and niche factor expression were enriched in ROSlow BMSCs (supplemental Figure 3A-C). Therefore, we hypothesized that ATRA might impair BMSC clonogenicity and differentiation by enhancing cellular ROS levels. To this end, we used the antioxidant N-acetyl-l-cysteine (NAC) to reduce the increased cellular ROS levels in ATRA-treated BMSCs (Figure 3D). Notably, NAC treatment successfully rescued the CFU-F activity (Figure 3E), osteogenesis ability (Figure 3F-G), and adipogenesis and chondrogenesis capacities (supplemental Figure 3D-G) of the ATRA-treated BMSCs. Furthermore, NAC treatment also rescued the BMSCs in ATRA-treated mice, in the aspects of ROS levels, cell number, and CFU-F activity (Figure 3H-K). More importantly, NAC treatment recovered the expression of niche factors in BMSCs (Figure 3L), HSC engraftment and quiescence (Figure 3M-N), and hematopoietic mononuclear cell recovery in the peripheral blood (supplemental Figure 3H) of ATRA-pretreated recipients.

Retinoic acid inhibits NRF2 to increase ROS levels and impair the function of BMSCs. Heatmap (A) and gene set enrichment analysis (GSEA) (B) of the indicated genes in control or ATRA-treated BMSCs in vitro. (C) Representative FACS plot (i) and quantification (ii) of cellular ROS levels in BMSCs, determined using H2DCFDA staining after ATRA treatment, as indicated; n = 4 biologically independent replicates. (D) ROS levels in BMSCs after ATRA and NAC treatment, as indicated; n = 3 biologically independent replicates. (E) Representative images (i) and quantification (ii) of CFU-F colonies formed by BMSCs treated with ATRA and NAC, as indicated; n = 5 biologically independent replicates. (F-G) Alizarin Red S staining (i) and quantification (ii) (F) and qPCR analysis of osteoblastic genes (G) in BMSCs, after induced osteoblastic differentiation. The osteogenic medium was administrated with vehicle or ATRA, as indicated; n = 3 biologically independent replicates. (H) Schematic of experimental design for NAC and ATRA treatment in vivo, as seen in panels I to N. (I-J) Representative FACS plot (i) and quantification (ii) of cellular ROS levels in BMSCs (I) and absolute numbers of BMSCs (J) in indicated mice; n = 5 mice per group. (K) Representative images (i) and quantification (ii) of CFU-F colonies formed by BMSCs from indicated mice; n = 3 mice per group. (L) qPCR analysis of HSC niche factors in sorted PDGFRα+ BMSCs from indicated mice; n = 4–6 biologically replicates. (M-N) The absolute numbers of recovered CD45.1+ donor-derived HSPCs (M) and cell cycle of CD45.1+ donor-derived HSCs (N) in recipient mice at 8 weeks after transplantation; n = 4-6 mice. (O-P) GSEA analysis of NRF2 pathways (O) and heatmap of NRF2-induced genes (P) in BMSCs after ATRA treatment. (Q) Western blots (i) and quantification (ii) for NRF2 protein levels in BMSCs after ATRA treatment. (R) Western blots for NRF2 in BMSCs with empty vector (EV) or NRF2 overexpression (OE) and vehicle control or ATRA treatment, as indicated. (S) ROS levels in BMSCs with EV or NRF2-OE and vehicle control or ATRA treatment as indicated; n = 3 biologically independent replicates. (T) qPCR analysis of HSC niche factors in BMSCs with EV or NRF2-OE and vehicle control or ATRA treatment, as indicated; n = 3 biologically independent replicates. (U) Chip-qPCR of Scf and Igf1 enrichment in BMSC anti-NRF2 precipitates as indicated. Error bars indicate mean ± SD. Black bars represent individual genes in rank order. NES, normalized enrichment score; FDR, false discovery rate. (B, O) Repeated-measures 1-way ANOVA (C-F, I-M, Q, and U) or 2-way (G, N, S, and T) ANOVA followed by Dunnett’s test for multiple comparisons, ‡P < .05; ‡‡P < .01; ‡‡‡P < .001; ‡‡‡‡P < .0001.
Retinoic acid inhibits NRF2 to increase ROS levels and impair the function of BMSCs. Heatmap (A) and gene set enrichment analysis (GSEA) (B) of the indicated genes in control or ATRA-treated BMSCs in vitro. (C) Representative FACS plot (i) and quantification (ii) of cellular ROS levels in BMSCs, determined using H2DCFDA staining after ATRA treatment, as indicated; n = 4 biologically independent replicates. (D) ROS levels in BMSCs after ATRA and NAC treatment, as indicated; n = 3 biologically independent replicates. (E) Representative images (i) and quantification (ii) of CFU-F colonies formed by BMSCs treated with ATRA and NAC, as indicated; n = 5 biologically independent replicates. (F-G) Alizarin Red S staining (i) and quantification (ii) (F) and qPCR analysis of osteoblastic genes (G) in BMSCs, after induced osteoblastic differentiation. The osteogenic medium was administrated with vehicle or ATRA, as indicated; n = 3 biologically independent replicates. (H) Schematic of experimental design for NAC and ATRA treatment in vivo, as seen in panels I to N. (I-J) Representative FACS plot (i) and quantification (ii) of cellular ROS levels in BMSCs (I) and absolute numbers of BMSCs (J) in indicated mice; n = 5 mice per group. (K) Representative images (i) and quantification (ii) of CFU-F colonies formed by BMSCs from indicated mice; n = 3 mice per group. (L) qPCR analysis of HSC niche factors in sorted PDGFRα+ BMSCs from indicated mice; n = 4–6 biologically replicates. (M-N) The absolute numbers of recovered CD45.1+ donor-derived HSPCs (M) and cell cycle of CD45.1+ donor-derived HSCs (N) in recipient mice at 8 weeks after transplantation; n = 4-6 mice. (O-P) GSEA analysis of NRF2 pathways (O) and heatmap of NRF2-induced genes (P) in BMSCs after ATRA treatment. (Q) Western blots (i) and quantification (ii) for NRF2 protein levels in BMSCs after ATRA treatment. (R) Western blots for NRF2 in BMSCs with empty vector (EV) or NRF2 overexpression (OE) and vehicle control or ATRA treatment, as indicated. (S) ROS levels in BMSCs with EV or NRF2-OE and vehicle control or ATRA treatment as indicated; n = 3 biologically independent replicates. (T) qPCR analysis of HSC niche factors in BMSCs with EV or NRF2-OE and vehicle control or ATRA treatment, as indicated; n = 3 biologically independent replicates. (U) Chip-qPCR of Scf and Igf1 enrichment in BMSC anti-NRF2 precipitates as indicated. Error bars indicate mean ± SD. Black bars represent individual genes in rank order. NES, normalized enrichment score; FDR, false discovery rate. (B, O) Repeated-measures 1-way ANOVA (C-F, I-M, Q, and U) or 2-way (G, N, S, and T) ANOVA followed by Dunnett’s test for multiple comparisons, ‡P < .05; ‡‡P < .01; ‡‡‡P < .001; ‡‡‡‡P < .0001.
Next, we explored the mechanism by which ATRA regulates ROS levels in BMSCs. Our transcriptional analysis did not show a significant difference in the expression of aerobic glycolysis and oxidative phosphorylation genes in BMSCs after ATRA treatment (supplemental Figure 3I). However, the NRF2-antioxidant response element (ARE) pathway, a key player in the antioxidant defense of stem cells,46,47 was dramatically repressed in ATRA-treated BMSCs (Figure 3O). In support of this, NRF2 target genes were downregulated in ATRA-treated BMSCs (Figure 3P). We further found that ATRA treatment reduced NRF2 protein levels in BMSCs (Figure 3Q), whereas ATRA treatment did not affect NRF2 (Nfe2l2) mRNA levels (Figure 3P). This indicated that ATRA might regulate ROS levels in BMSCs by repressing the NRF2 protein. Indeed, enforced NRF2 expression by adenovirus transfection or an NRF2-specific agonist (NK252) remarkably recovered the ROS level and expression of HSC niche factors in ATRA-treated BMSCs (Figure 3R-T; supplemental Figure 3J-L). Furthermore, our chromatin immunoprecipitation results showed that NRF2 was directly associated with the Scf promoter region in BMSCs (Figure 3U), suggesting that NRF2 can directly regulate stem cell factor in BMSCs.
Excess RIG-I expression stimulates Keap1-mediated proteasome degradation of NRF2
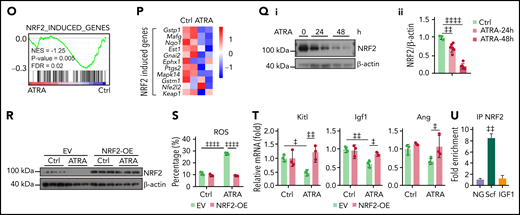
We further explored the mechanism by which ATRA inhibited NRF2. As ATRA treatment regulates NRF2 posttranscriptionally, we hypothesized that ATRA might promote NRF2 protein degradation. Indeed, the half-life of NRF2 was dramatically reduced in ATRA-treated BMSCs (Figure 4A). Furthermore, ATRA-induced NRF2 degradation was proteasome dependent but not lysosome dependent (Figure 4B). We also observed that Keap1, which facilitates NRF2 ubiquitination and proteasome degradation,48,49 was dramatically increased in BMSCs after ATRA treatment (Figure 4C), in addition to which the half-life of Keap1 was extended (Figure 4D). However, Keap1 mRNA levels did not differ in ATRA-treated BMSCs (Figure 4F). These observations suggested that ATRA treatment might accumulate the Keap1 protein to degrade NRF2 in BMSCs. To this end, we used 2 independent short hairpin RNAs to silence Keap1 expression in BMSCs. Notably, Keap1 silencing dramatically rescued NRF2 protein expression in BMSCs after ATRA treatment (Figure 4E). Overall, our data showed that ATRA treatment promoted NRF2 protein degradation in BMSCs in a Keap1-dependent manner.

Retinoic acid upregulates RIG-I to stimulate Keap1-mediated proteasome degradation of NRF2. (A) Western blots for NRF2 in BMSCs, with or without ATRA treatment at the indicated time, after cycloheximide (CHX) treatment. β-Actin was used as a loading control. Quantified in supplemental Figure 4A. (B) Western blots for NRF2 in BMSCs, with or without treatment using ATRA and proteasome inhibitor MG132 or lysosome inhibitor chloroquine (CQ), as indicated. β-actin was used a loading control. Two biologically independent replicates have been presented; n = 6 biologically replicates. Quantified in Supplemental Figure 4B. (C) Western blots for Keap1 in BMSCs after ATRA treatment as indicated. β-actin was used as a loading control. Two replicates have been presented; n = 3–6 biologically replicates. Quantified in Supplemental Figure 4C. (D) Western blots for Keap1 in BMSCs, with or without ATRA treatment at the indicated time, after CHX treatment. β-Actin was used as a loading control; n = 3 biologically independent replicates. Quantified in supplemental Figure 4D. (E) Western blots for NRF2 and Keap1 in BMSCs with Keap1-knockdown and ATRA treatment as indicated. β-Actin was used as a loading control; n = 3 biologically independent replicates. Quantified in supplemental Figure 4E. (F) qPCR analysis of RIG-I, NRF2, and Keap1 in BMSCs after ATRA treatment as indicated. (G) Western blots for RIG-I, NRF2, and Keap1 in BMSCs after ATRA treatment as indicated. β-actin was used as a loading control. Two replicates have been presented; n = 4 biologically independent replicates. Quantified in supplemental Figure 4G. (H) Western blots for Flag-Trim25, HA-Keap1, and RIG-I in the input and immunoprecipitate with anti-Flag antibody from 293T cells. (I) Western blots for Trim25, Keap1, and RIG-I in the input and immunoprecipitate with anti-Trim25 antibody from BMSCs. (J) Western blots for HA-ubiquitin (Ub), HA-Trim25, Flag-Keap1, and RIG-I in the input and immunoprecipitate with anti-Flag antibody from 293T cells. *HA-Trim25. (K) Western blots for Ubiquitin (Ub), Keap1, and RIG-I in the input and immunoprecipitate with anti-Keap1 antibody from MG132-treated BMSCs obtained from Rig-I+/+ or Rig-I−/− mice. (L) Western blots for Ubiquitin (Ub), NRF2, and RIG-I in the input and immunoprecipitate with anti-NRF2 antibody from MG132-treated BMSCs obtained from Rig-I+/+ or Rig-I−/− mice. (M) Western blots for RIG-I, NRF2, and Keap1 in Rig-I+/+ or Rig-I−/− BMSCs after ATRA treatment as indicated. β-Actin was used as a loading control. Two replicates have been presented; n = 2-4 biologically independent replicates. Quantified in supplemental Figure 4H. (N) qPCR analysis of NRF2-induced genes in Rig-I+/+ or Rig-I−/− BMSCs after ATRA treatment as indicated. (O) Western blots for RIG-I, NRF2, Keap1, and Trim25 in Trim25-knockdown Rig-I+/+ or Rig-I−/− BMSCs, as indicated. Quantified in supplemental Figure 4I. (P) Illustration of the RIG-I-Trim25-Keap1 complex regulating NRF2 degradation. Error bars indicate mean ± SD. Repeated-measures 1-way (F) or 2-way (N) ANOVA followed by Dunnett’s test multiple comparisons. ‡P < .05; ‡‡P < .01; ‡‡‡P < .001; ‡‡‡‡P < .0001.
Retinoic acid upregulates RIG-I to stimulate Keap1-mediated proteasome degradation of NRF2. (A) Western blots for NRF2 in BMSCs, with or without ATRA treatment at the indicated time, after cycloheximide (CHX) treatment. β-Actin was used as a loading control. Quantified in supplemental Figure 4A. (B) Western blots for NRF2 in BMSCs, with or without treatment using ATRA and proteasome inhibitor MG132 or lysosome inhibitor chloroquine (CQ), as indicated. β-actin was used a loading control. Two biologically independent replicates have been presented; n = 6 biologically replicates. Quantified in Supplemental Figure 4B. (C) Western blots for Keap1 in BMSCs after ATRA treatment as indicated. β-actin was used as a loading control. Two replicates have been presented; n = 3–6 biologically replicates. Quantified in Supplemental Figure 4C. (D) Western blots for Keap1 in BMSCs, with or without ATRA treatment at the indicated time, after CHX treatment. β-Actin was used as a loading control; n = 3 biologically independent replicates. Quantified in supplemental Figure 4D. (E) Western blots for NRF2 and Keap1 in BMSCs with Keap1-knockdown and ATRA treatment as indicated. β-Actin was used as a loading control; n = 3 biologically independent replicates. Quantified in supplemental Figure 4E. (F) qPCR analysis of RIG-I, NRF2, and Keap1 in BMSCs after ATRA treatment as indicated. (G) Western blots for RIG-I, NRF2, and Keap1 in BMSCs after ATRA treatment as indicated. β-actin was used as a loading control. Two replicates have been presented; n = 4 biologically independent replicates. Quantified in supplemental Figure 4G. (H) Western blots for Flag-Trim25, HA-Keap1, and RIG-I in the input and immunoprecipitate with anti-Flag antibody from 293T cells. (I) Western blots for Trim25, Keap1, and RIG-I in the input and immunoprecipitate with anti-Trim25 antibody from BMSCs. (J) Western blots for HA-ubiquitin (Ub), HA-Trim25, Flag-Keap1, and RIG-I in the input and immunoprecipitate with anti-Flag antibody from 293T cells. *HA-Trim25. (K) Western blots for Ubiquitin (Ub), Keap1, and RIG-I in the input and immunoprecipitate with anti-Keap1 antibody from MG132-treated BMSCs obtained from Rig-I+/+ or Rig-I−/− mice. (L) Western blots for Ubiquitin (Ub), NRF2, and RIG-I in the input and immunoprecipitate with anti-NRF2 antibody from MG132-treated BMSCs obtained from Rig-I+/+ or Rig-I−/− mice. (M) Western blots for RIG-I, NRF2, and Keap1 in Rig-I+/+ or Rig-I−/− BMSCs after ATRA treatment as indicated. β-Actin was used as a loading control. Two replicates have been presented; n = 2-4 biologically independent replicates. Quantified in supplemental Figure 4H. (N) qPCR analysis of NRF2-induced genes in Rig-I+/+ or Rig-I−/− BMSCs after ATRA treatment as indicated. (O) Western blots for RIG-I, NRF2, Keap1, and Trim25 in Trim25-knockdown Rig-I+/+ or Rig-I−/− BMSCs, as indicated. Quantified in supplemental Figure 4I. (P) Illustration of the RIG-I-Trim25-Keap1 complex regulating NRF2 degradation. Error bars indicate mean ± SD. Repeated-measures 1-way (F) or 2-way (N) ANOVA followed by Dunnett’s test multiple comparisons. ‡P < .05; ‡‡P < .01; ‡‡‡P < .001; ‡‡‡‡P < .0001.
Next, we explored the mechanism by which ATRA treatment regulates Keap1 in BMSCs. First, we found that ATRA treatment rapidly upregulated RIG-I in BMSCs (Figure 4F-G), consistent with a previous report,20 in a RARβ- and RARγ-dependent manner (supplemental Figure 4F). As Keap1 and RIG-I are targeted by Trim25 for ubiquitination,50,51 we hypothesized that the increased RIG-I protein might influence the Trim25–Keap1 interaction to outcompete Trim25-mediated Keap1 degradation. To test this, we performed a competitive immunoprecipitation assay in 293T cells and found that RIG-I overexpression reduced the interaction between Trim25 and Keap1 (Figure 4H). Furthermore, we explored how ATRA influences the RIG-I-Trim25-Keap1 complex in BMSCs. Notably, Trim25 complexed with Keap1 and RIG-I in control BMSCs; however, when RIG-I was induced by ATRA treatment, Trim25 predominantly interacted with RIG-I in BMSCs (Figure 4I). These observations suggested that excess RIG-I expression might outcompete Trim25-mediated Keap1 degradation. In support of this, RIG-I overexpression reduced Keap1 ubiquitination induced by Trim25 in 293T cells (Figure 4J).
To further explore the role of RIG-I in regulating the Keap1–Trim25 complex in BMSCs, we used a Rig-I deletion mouse line.35,37,52 We observed that ATRA treatment reduced Keap1 ubiquitination in control Rig-I+/+ BMSCs but not in Rig-I−/− BMSCs (Figure 4K), suggesting that ATRA treatment might upregulate Keap1 in a RIG-I–dependent manner. In line with this, ATRA treatment efficiently increased NRF2 ubiquitination in control Rig-I+/+ BMSCs but not in Rig-I−/− BMSCs (Figure 4L). Consequently, ATRA treatment did not increase Keap1 protein or reduce NRF2 protein levels in Rig-I−/− BMSCs (Figure 4M). Our data showed that ATRA induced NRF2 degradation in a RIG-I–dependent manner. In support of this, Rig-I deletion efficiently rescued NRF2-targeted ARE pathway genes53,54 in BMSCs under ATRA treatment (Figure 4N). We also found that BMSCs have higher basal endoplasmic reticulum (ER) stress levels and Trim25 and NRF2 expression levels than BM cells (supplemental Figure 4J-K). Consistently, silencing Trim25 increased Keap1 and reduced NRF2 in BMSCs before ATRA treatment (Figure 4O).
Overall, our data demonstrated that ATRA upregulated RIG-I to promote NRF2 degradation by altering the RIG-I-Trim25-Keap1 complex (Figure 4P).
Rig-I deletion recovers the clonogenicity and osteogenesis capacities of BMSCs under ATRA treatment
We further investigated the role of the RIG-I–NRF2 axis in BMSCs following ATRA treatment. First, we found that Rig-I deletion efficiently rescued ROS accumulation, cell number reduction, and cell death in BMSCs from ATRA-treated mice, although Rig-I deletion did not affect BMSCs without ATRA treatment (Figure 5A-C). This could be because of the low expression level of RIG-I in the control BMSCs (Figure 4G). Second, Rig-I deletion ultimately rescued the CFU-F activity and differentiation potential toward osteoblasts, adipocytes, and chondrocytes in BMSCs under ATRA treatment in vitro, in an NRF2-dependent manner (Figure 5D-G; supplemental Figure 5A-E). Furthermore, Rig-I deletion suppressed the lipid peroxidation inducer erastin- or H2O2-induced cell death in BMSCs from ATRA-treated mice (supplemental Figure 5F-G).

Rig-I deletion recovers the clonogenicity and osteogenesis capacities of BMSCs under ATRA treatment. (A) Representative FACS plot (i) and quantification (ii) of cellular ROS level in Rig-I+/+ and Rig-I−/− BMSCs, with or without ATRA treatment, as indicated; n = 3 biologically independent replicates. (B-C) The absolute numbers (B) and cell death (C) of BMSCs in Rig-I+/+ and Rig-I−/− mice treated with vehicle or ATRA, as indicated; n = 3–4 mice per group. (D) Western blots for RIG-I and NRF2 in NRF2-knockdown BMSCs from Rig-I+/+ or Rig-I−/− mice, with β-actin used as a loading control. (E) Representative images (i) and quantification (ii) of CFU-F colonies formed by NRF2-knockdown BMSCs from Rig-I+/+ or Rig-I−/− mice treated with vehicle or ATRA, as indicated; n = 3 biologically independent replicates. (F-G) Alizarin Red S staining (i) and quantification (ii) (F) and qPCR analysis of osteoblastic genes (G) in NRF2-knockdown Rig-I+/+ and Rig-I−/− BMSCs after induced osteoblastic differentiation as indicated. The osteogenic medium was administered with vehicle or ATRA as indicated; n = 3 biologically independent replicates. (H) Strategy outline for the role of RIG-I in osteogenesis ability of ATRA-regulated BMSCs. (I-J) Representative images (I) and quantitative measurements for micro-CT analysis (J) of femurs from control or ATRA-treated Rig-I+/+ or Rig-I−/− mice as indicated; n = 4 mice per group. (K-L) Representative image (K) and quantification (L) of OPN-expressing cells in distal femur metaphysis in control or ATRA-treated Rig-I+/+ or Rig-I−/− mice as indicated. Error bars indicated mean ± SD. Repeated-measures 2-way (A-C, E-G, J, and L) ANOVA followed by Dunnett’s test multiple comparisons. ‡P < .05; ‡‡P < .01; ‡‡‡P < .001; ‡‡‡‡P < .0001.
Rig-I deletion recovers the clonogenicity and osteogenesis capacities of BMSCs under ATRA treatment. (A) Representative FACS plot (i) and quantification (ii) of cellular ROS level in Rig-I+/+ and Rig-I−/− BMSCs, with or without ATRA treatment, as indicated; n = 3 biologically independent replicates. (B-C) The absolute numbers (B) and cell death (C) of BMSCs in Rig-I+/+ and Rig-I−/− mice treated with vehicle or ATRA, as indicated; n = 3–4 mice per group. (D) Western blots for RIG-I and NRF2 in NRF2-knockdown BMSCs from Rig-I+/+ or Rig-I−/− mice, with β-actin used as a loading control. (E) Representative images (i) and quantification (ii) of CFU-F colonies formed by NRF2-knockdown BMSCs from Rig-I+/+ or Rig-I−/− mice treated with vehicle or ATRA, as indicated; n = 3 biologically independent replicates. (F-G) Alizarin Red S staining (i) and quantification (ii) (F) and qPCR analysis of osteoblastic genes (G) in NRF2-knockdown Rig-I+/+ and Rig-I−/− BMSCs after induced osteoblastic differentiation as indicated. The osteogenic medium was administered with vehicle or ATRA as indicated; n = 3 biologically independent replicates. (H) Strategy outline for the role of RIG-I in osteogenesis ability of ATRA-regulated BMSCs. (I-J) Representative images (I) and quantitative measurements for micro-CT analysis (J) of femurs from control or ATRA-treated Rig-I+/+ or Rig-I−/− mice as indicated; n = 4 mice per group. (K-L) Representative image (K) and quantification (L) of OPN-expressing cells in distal femur metaphysis in control or ATRA-treated Rig-I+/+ or Rig-I−/− mice as indicated. Error bars indicated mean ± SD. Repeated-measures 2-way (A-C, E-G, J, and L) ANOVA followed by Dunnett’s test multiple comparisons. ‡P < .05; ‡‡P < .01; ‡‡‡P < .001; ‡‡‡‡P < .0001.
We further investigated the in vivo role of RIG-I in regulating osteogenesis on ATRA treatment (Figure 5H). In contrast to the severe bone loss in control Rig-I+/+ mice, Rig-I deletion rescued ATRA-induced osteoporosis (Figure 5I-J). Furthermore, OPN+ bone cells in the distal femur metaphysis were protected in Rig-I−/− mice under ATRA treatment (Figure 5K-L).
Rig-I deletion protects the HSC niche function of BMSCs under ATRA treatment
We further investigated the role of RIG-I in regulating the HSC niche function of BMSCs under ATRA treatment. Notably, we found that Rig-I deletion protected the expression of HSC niche factors in BMSCs on ATRA treatment and that the HSC niche factors were reduced in NRF2-silenced BMSCs (Figure 6A). To further evaluate the in vivo role of RIG-I in regulating the stromal niche function for HSC engraftment under ATRA treatment, we performed a transplantation assay by recovering fresh BMNCs (CD45.1+) in lethally irradiated Rig-I+/+ or Rig-I−/− recipient mice (CD45.2+) pretreated with ATRA or vehicle control (Figure 6B). In contrast to the decreased HSC engraftment in ATRA-pretreated Rig-I+/+ control recipients, ATRA-pretreated Rig-I−/− recipients showed a recovery of donor-derived LT-HSCs and HSCs comparable to that of Rig-I−/− and Rig-I+/+ recipients without ATRA pretreatment (Figure 6C). Furthermore, Rig-I deletion in the stromal niche also protected the quiescence of engrafted HSCs on ATRA treatment (Figure 6D). To evaluate the function of engrafted HSCs in Rig-I−/− recipients on ATRA treatment, we performed a competitive repopulation assay using BMNCs (CD45.1+), which were recovered in Rig-I+/+ or Rig-I−/− recipient mice for 8 weeks, together with fresh competitor BMNCs (CD45.2+), to transplant into wild-type recipients (CD45.2+; Figure 6B). In contrast to the decreased engraftment in ATRA-pretreated Rig-I+/+ control recipients, BMNCs recovered in ATRA-pretreated Rig-I−/− recipients showed engraftment comparable to that of Rig-I−/− and Rig-I+/+ recipients without ATRA pretreatment during the 16-week observation in all 3 lineages (Figure 6E).

Rig-I deletion protects the HSC niche function of BMSCs under ATRA treatment. (A) qPCR analysis of HSC niche factors in NRF2-knockdown Rig-I+/+ or Rig-I−/− BMSCs treated with vehicle or ATRA, as indicated; n = 3 biologically independent replicates. (B) Schematic of experimental design for in vivo HSC niche function after ATRA treatment in Rig-I+/+ or Rig-I−/− mice. Wild-type CD45.2+ mice, pretreated with vehicle or ATRA, consecutively 6 times, were lethally irradiated and transplanted with 1 × 10⁶ CD45.1+ BMNCs for recovery. After an 8-week recovery, 1 × 10⁶ recovered CD45.1+ BMNCs were mixed with 2 × 10⁵ fresh CD45.2+ BMNCs for competitive reconstitution analysis. (C-D) Absolute numbers of donor-derived HSPCs (C) and cell cycle analysis for donor-derived HSCs (D) in Rig-I+/+ or Rig-I−/− recipient mice after the 8-week recovery. (E) Engraftment analysis of total engrafted CD45.1+ donor cells (Total), B cells (B220+), T cells (CD3+), and myeloid cells (Gr1+Mac1+) recovered from Rig-I+/+ recipients or Rig-I−/− recipients at indicated weeks after transplantation; n = 6 donors per group and n = 11–12 recipient mice per group. (F) Schematic of experimental design for co-transplantation of BMNCs with BMSCs derived from Rig-I+/+ and Rig-I−/− mice pretreated with ATRA or control vehicle. (G) Absolute numbers of donor-derived HSPCs in recipients on 8-week recovery after BMNC transplantation and BMSC co-transplantation as indicated. (H) The recovery of hematopoietic mononuclear cells in the peripheral blood of co-transplanted recipients, as indicated. Error bars indicated mean ± SD. Data were analyzed using 2-way (A, C-E, G, and H) ANOVA followed by Dunnett’s test multiple comparisons. ‡P < .05; ‡‡P < .01; ‡‡‡P < .001; ‡‡‡‡P < .0001.
Rig-I deletion protects the HSC niche function of BMSCs under ATRA treatment. (A) qPCR analysis of HSC niche factors in NRF2-knockdown Rig-I+/+ or Rig-I−/− BMSCs treated with vehicle or ATRA, as indicated; n = 3 biologically independent replicates. (B) Schematic of experimental design for in vivo HSC niche function after ATRA treatment in Rig-I+/+ or Rig-I−/− mice. Wild-type CD45.2+ mice, pretreated with vehicle or ATRA, consecutively 6 times, were lethally irradiated and transplanted with 1 × 10⁶ CD45.1+ BMNCs for recovery. After an 8-week recovery, 1 × 10⁶ recovered CD45.1+ BMNCs were mixed with 2 × 10⁵ fresh CD45.2+ BMNCs for competitive reconstitution analysis. (C-D) Absolute numbers of donor-derived HSPCs (C) and cell cycle analysis for donor-derived HSCs (D) in Rig-I+/+ or Rig-I−/− recipient mice after the 8-week recovery. (E) Engraftment analysis of total engrafted CD45.1+ donor cells (Total), B cells (B220+), T cells (CD3+), and myeloid cells (Gr1+Mac1+) recovered from Rig-I+/+ recipients or Rig-I−/− recipients at indicated weeks after transplantation; n = 6 donors per group and n = 11–12 recipient mice per group. (F) Schematic of experimental design for co-transplantation of BMNCs with BMSCs derived from Rig-I+/+ and Rig-I−/− mice pretreated with ATRA or control vehicle. (G) Absolute numbers of donor-derived HSPCs in recipients on 8-week recovery after BMNC transplantation and BMSC co-transplantation as indicated. (H) The recovery of hematopoietic mononuclear cells in the peripheral blood of co-transplanted recipients, as indicated. Error bars indicated mean ± SD. Data were analyzed using 2-way (A, C-E, G, and H) ANOVA followed by Dunnett’s test multiple comparisons. ‡P < .05; ‡‡P < .01; ‡‡‡P < .001; ‡‡‡‡P < .0001.
We further evaluated the role of RIG-I in regulating BMSCs to support HSC engraftment (Figure 6F). Compared with intrafemur injection of control BMSCs, intrafemur injection of BMSCs from ATRA-treated Rig-I+/+ mice presented decreased ability to support HSC engraftment (Figure 6G) and recovery of hematopoietic mononuclear cells in peripheral blood (Figure 6H). However, Rig-I−/− BMSCs from ATRA-treated mice preserved their ability to facilitate HSC engraftment and support the recovery of hematopoietic mononuclear cells in peripheral blood (Figure 6G-H).
Overall, our results showed that ATRA impaired the stromal niche function of BMSCs to support HSC engraftment in a RIG-I–dependent manner.
Retinoic acid impairs the ability of BMSCs to support emergency myelopoiesis against L monocytogenes during BM transplantation in a RIG-I–dependent manner
We further investigated how BMSCs support immune reconstitution against pathogen infection, which is a major threat to patients receiving BM transplantation.55,56 We transplanted wild-type BMNCs (CD45.1+) into lethally irradiated recipients (CD45.2+) and intrafemur injected recipients with BMSCs from the indicated mice (Figure 7A). We found that intrafemur injection of BMSCs from control Rig-I+/+ mice but not from ATRA-treated Rig-I+/+ mice significantly supported myeloid cell recovery in the BM (Figure 7B) and peripheral blood (Figure 7C) after transplantation compared with that in recipients without BMSC injection. However, BMSCs from ATRA-treated Rig-I−/− mice preserved their ability to support myeloid cell recovery after transplantation (Figure 7B-C).
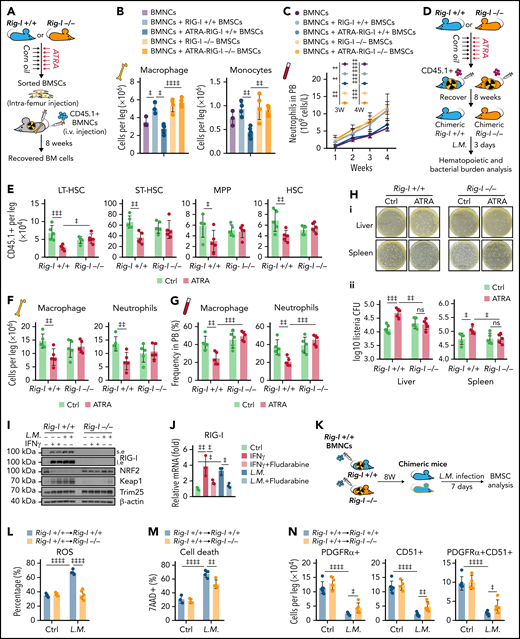
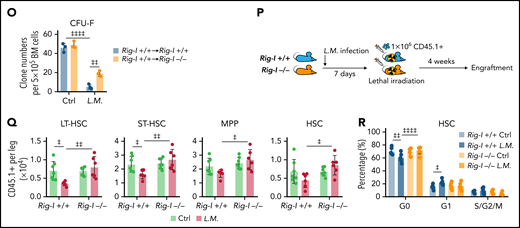
Retinoic acid impairs the ability of BMSCs to support emergency myelopoiesis against L monocytogenes during BM transplantation in a RIG-I–dependent manner. (A) Schematic of experimental design for co-transplantation of BMNCs with BMSCs derived from Rig-I+/+ and Rig-I−/− mice pretreated with ATRA or control vehicle (B-C). (B) The absolute numbers of donor-derived macrophage (CD11b+F4/80+) and donor-derived monocytes (CD11b+Ly6Chi) after the 8-week recovery in recipients received BMNC and BMSC co-transplantation as indicated; n = 3–5 mice per group. (C) The recovery of neutrophils in the peripheral blood of transplanted recipients as indicated; n = 4–7 mice per group. (D) Schematic of experimental design for evaluating stromal niche function in Rig-I+/+ or Rig-I−/− mice after ATRA treatment. Rig-I+/+ and Rig-I−/− mice pretreated with vehicle or ATRA consecutively 6 times were lethally irradiated and transplanted with 1 × 10⁶ CD45.1+ BMNCs for recovery. After 8 weeks of recovery, the chimeric recipients were infected with L monocytogenes (L.M.) at 1 × 10⁴ CFUs (D-H). (E) Absolute numbers of donor-derived HSPCs in the BM in chimeric recipients at 3 days after L.M. infection; n = 5 mice per group. (F-G) Absolute numbers in the BM (F) and frequency in the peripheral blood (G) of donor-derived macrophages (CD11b+F4/80+) and neutrophils (CD11b+Gr-1+) in chimeric recipients at 3 days after L.M. infection; n = 5 mice per group. (H) Representative images (i) and quantification (ii) of CFUs in liver and spleen at 3 days after L.M. infection in chimeric recipients; n = 5 mice per group. (I) Western blots for RIG-I, NRF2, Keap1, and Trim25 in BMSCs from Rig-I+/+ or Rig-I−/− mice treated with IFNγ or L.M. as indicated, with β-actin used as a loading control. (J) qPCR of RIG-I in BMSCs with IFNγ, L.M., and STAT1 inhibitor (fludarabine) as indicated; n = 3 biologically independent replicates. (K) Schematic of experimental design for the role of RIG-I in BMSCs on L.M. infection challenge; 1 × 10⁶Rig-I+/+ BMNCs were transplanted into lethal irradiated Rig-I+/+ or Rig-I−/− mice. Eight weeks after transplantation, chimeric Rig-I+/+ and Rig-I−/− mice were infected with L.M. at 1 × 10⁴ CFUs, and BMSCs were analyzed at 7 days after infection (L-O). (L-O) The ROS levels (L), cell death (M), absolute numbers (N), and CFU-F activity (O) of BMSCs from chimeric Rig-I+/+ and Rig-I−/− recipient mice after indicated treatments; n = 4–5 mice per group. (P) Schematic of experimental design for evaluating the role of RIG-I in stromal niche on L.M. infection challenge; 1 × 10⁶ CD45.1+ BMNCs were transplanted into lethally irradiated Rig-I+/+ and Rig-I−/− mice, which were preinfected with L.M. at 1 × 10⁴ CFU for 7 days. Engraftment was analyzed at 4 weeks after transplantation (Q-R). (Q-R) Absolute numbers of CD45.1+ donor-derived HSPCs (Q) and cell cycle analysis of CD45.1+ donor-derived HSCs (R) in recipient mice as indicated; n = 5-6 mice per group. Error bars indicate mean ± SD. Repeated-measures 1-way (B and J) or 2-way (C, E-H, L-O, Q, and R) ANOVA followed by Dunnett’s test multiple comparisons. ‡P < .05; ‡‡P < .01; ‡‡‡P < .001; ‡‡‡‡P < .0001.
Retinoic acid impairs the ability of BMSCs to support emergency myelopoiesis against L monocytogenes during BM transplantation in a RIG-I–dependent manner. (A) Schematic of experimental design for co-transplantation of BMNCs with BMSCs derived from Rig-I+/+ and Rig-I−/− mice pretreated with ATRA or control vehicle (B-C). (B) The absolute numbers of donor-derived macrophage (CD11b+F4/80+) and donor-derived monocytes (CD11b+Ly6Chi) after the 8-week recovery in recipients received BMNC and BMSC co-transplantation as indicated; n = 3–5 mice per group. (C) The recovery of neutrophils in the peripheral blood of transplanted recipients as indicated; n = 4–7 mice per group. (D) Schematic of experimental design for evaluating stromal niche function in Rig-I+/+ or Rig-I−/− mice after ATRA treatment. Rig-I+/+ and Rig-I−/− mice pretreated with vehicle or ATRA consecutively 6 times were lethally irradiated and transplanted with 1 × 10⁶ CD45.1+ BMNCs for recovery. After 8 weeks of recovery, the chimeric recipients were infected with L monocytogenes (L.M.) at 1 × 10⁴ CFUs (D-H). (E) Absolute numbers of donor-derived HSPCs in the BM in chimeric recipients at 3 days after L.M. infection; n = 5 mice per group. (F-G) Absolute numbers in the BM (F) and frequency in the peripheral blood (G) of donor-derived macrophages (CD11b+F4/80+) and neutrophils (CD11b+Gr-1+) in chimeric recipients at 3 days after L.M. infection; n = 5 mice per group. (H) Representative images (i) and quantification (ii) of CFUs in liver and spleen at 3 days after L.M. infection in chimeric recipients; n = 5 mice per group. (I) Western blots for RIG-I, NRF2, Keap1, and Trim25 in BMSCs from Rig-I+/+ or Rig-I−/− mice treated with IFNγ or L.M. as indicated, with β-actin used as a loading control. (J) qPCR of RIG-I in BMSCs with IFNγ, L.M., and STAT1 inhibitor (fludarabine) as indicated; n = 3 biologically independent replicates. (K) Schematic of experimental design for the role of RIG-I in BMSCs on L.M. infection challenge; 1 × 10⁶Rig-I+/+ BMNCs were transplanted into lethal irradiated Rig-I+/+ or Rig-I−/− mice. Eight weeks after transplantation, chimeric Rig-I+/+ and Rig-I−/− mice were infected with L.M. at 1 × 10⁴ CFUs, and BMSCs were analyzed at 7 days after infection (L-O). (L-O) The ROS levels (L), cell death (M), absolute numbers (N), and CFU-F activity (O) of BMSCs from chimeric Rig-I+/+ and Rig-I−/− recipient mice after indicated treatments; n = 4–5 mice per group. (P) Schematic of experimental design for evaluating the role of RIG-I in stromal niche on L.M. infection challenge; 1 × 10⁶ CD45.1+ BMNCs were transplanted into lethally irradiated Rig-I+/+ and Rig-I−/− mice, which were preinfected with L.M. at 1 × 10⁴ CFU for 7 days. Engraftment was analyzed at 4 weeks after transplantation (Q-R). (Q-R) Absolute numbers of CD45.1+ donor-derived HSPCs (Q) and cell cycle analysis of CD45.1+ donor-derived HSCs (R) in recipient mice as indicated; n = 5-6 mice per group. Error bars indicate mean ± SD. Repeated-measures 1-way (B and J) or 2-way (C, E-H, L-O, Q, and R) ANOVA followed by Dunnett’s test multiple comparisons. ‡P < .05; ‡‡P < .01; ‡‡‡P < .001; ‡‡‡‡P < .0001.
We further investigated how ATRA regulates BMSCs to support immune reconstitution against pathogen infection after transplantation. To this end, we transplanted wild-type BMNCs (CD45.1+) into lethally irradiated Rig-I+/+ or Rig-I−/− recipient mice (CD45.2+) pretreated with ATRA or control vehicle and further challenged the recipients with L monocytogenes at 8 weeks after transplantation (Figure 7D). ATRA-pretreated Rig-I+/+ recipients had fewer engrafted HSCs (Figure 7E) and recovered myeloid cells in the BM (Figure 7F) and peripheral blood (Figure 7G) than did control Rig-I+/+ recipients at 3 days after the L monocytogenes challenge. Conversely, ATRA-treated Rig-I−/− recipients showed HSC engraftment and myeloid cell recovery comparable to those of control Rig-I−/− recipients after the L monocytogenes challenge (Figure 7E-G). As HSC-induced emerging myelopoiesis is critical for innate immunity against pathogens,57 we hypothesized that stromal niche damage by ATRA treatment might contribute to host defense immunity against bacterial pathogens in recipients after transplantation. Indeed, we found that the bacterial burdens were increased in the liver and spleen of ATRA-treated Rig-I+/+ recipients than in those of control Rig-I+/+ recipients at 3 days after L monocytogenes infection. However, at 3 days after L monocytogenes infection, ATRA-pretreated Rig-I−/− recipients had bacterial burdens in the liver and spleen comparable to those in control Rig-I−/− recipients without ATRA treatment (Figure 7H).
Furthermore, we found that inflammation stresses, including IFNγ and L monocytogenes infection, upregulated RIG-I by activating STAT1 signaling to repress NRF2 in BMSCs (Figure 7I-J). Rig-I deletion in stromal cells reduced the ROS levels in BMSCs and partially protected BMSCs from L monocytogenes–induced cell death and reduction of BMSC numbers and CFU-F activities (Figure 7K-O). To investigate whether L monocytogenes infection also regulates RIG-I, to suppress the stromal niche function of BMSCs in supporting HSC engraftment, we transplanted wild-type BMNCs (CD45.1+) into lethally irradiated Rig-I+/+ or Rig-I−/− recipients (CD45.2+) that were prechallenged with L monocytogenes (Figure 7P). Notably, L monocytogenes infection in recipients before transplantation reduced HSC engraftment, but this effect was abrogated by Rig-I deletion in the stromal niche (Figure 7Q-R). Furthermore, we also found that LPS upregulated RIG-I partially by activating STAT1 and reducing NRF2 in BMSCs, which subsequently increased ROS levels and cell death to result in reduced cell number and CFU-F activity of BMSCs in mice (supplemental Figure 6A-G). More importantly, LPS pretreatment in the recipients before transplantation reduced HSC engraftment, which was also rescued by Rig-I deletion in the stromal niche (supplemental Figure 6H-J).
Overall, our data showed that the stressed stromal niche regulates emergency myelopoiesis against inflammation challenges during transplantation in a RIG-I–dependent manner.
Discussion
BMSCs are quiescent during homeostasis but can rapidly proliferate and differentiate into osteoblasts or adipocytes in response to injury.58,59 Aging or various stresses decrease BMSC numbers and impair their clonogenicity and osteogenesis/adipogenesis balance, leading to diminished osteoblast specification and bone loss.60-62 Our work found that ATRA treatment suppressed NRF2, the critical antioxidant player in MSCs,47,63 thus increasing the ROS levels, to damage BMSCs in a RIG-I–dependent manner. High ROS levels also repress RARα expression,64 which provides feedback to the ATRA signal in the BMSCs. Consistent with our findings, long-term vitamin A intake and high serum retinol levels are associated with osteoporotic fractures in humans, partially because of disrupted BMSC function.65-67
BMSCs had high basal ER stress to retain Trim25 expression that engages with Keap1 to protect NRF2 protein for MSC maintenance during homeostasis.47,68,69 RIG-I is weakly expressed in BMSCs during homeostasis. However, ATRA treatment upregulates Rig-I by activating RARs,35 whereas inflammation stress, such as L monocytogenes infection, IFNγ, and LPS, upregulates RIG-I by activating STAT170-72 in BMSCs. High RIG-I expression outcompetes Trim25 and subsequently releases Keap1, which interacts with Cullin 3 (Cul3) to promote ubiquitination and degradation of NRF2,48,49 resulting in high ROS levels in BMSCs, causing cell cycle arrest, apoptosis, and cell senescence.44,73,74 Furthermore, our data showed that genetic inhibition of Rig-I preserved Trim25-Keap1 engagement under ATRA treatment and inflammation stress to sustain NRF2 protein and reduce ROS levels in BMSCs.
IFN and inflammation stress damage the stromal niche, reduce hematopoietic reconstitution, and cause poor graft function (PGF) after HSCT.75,76 BMSCs from patients with PGF have high ROS levels and impaired self-renewal and HSC-supporting function.77 Our data showed that ATRA treatment and inflammation stress upregulated RIG-I expression and increased ROS levels in BMSCs, which damaged their stromal niche function in supporting hematopoietic reconstitution and inflammation-induced stress myelopoiesis.78 As patients with relapsed acute promyelocytic leukemia and patients with NPM1-mutant acute myeloid leukemia might be subjected to both ATRA treatment and transplantation,79,80 it needs to be investigated whether they are susceptible to PGF. Furthermore, our data also suggested that antioxidative treatment increases the engraftment of HSCT partially by recovering BMSCs.81,82
Because the ATRA–RAR–RIG-I axis also regulates multiple transcription activities and various mRNA modifications,83,84 there is a requirement for future studies to explore other potential mechanisms involved in the long-term modulation of BMSCs other than oxidative stress and to ascertain how ATRA–RIG-I influences osteoblasts for bone formation and HSC regulation. Overall, our work identified a noncanonical role of RIG-I in regulating BMSC niche function to support HSC engraftment during transplantation under ATRA treatment and inflammation.
Acknowledgments
This study was supported by the National Key Research and Development Program of China (grants 2018YFA0107200 and 2017YFA0103403), Key Research and Development Program of Guangdong Province (grant 2019B020234002), National Natural Science Foundation of China (grants 82170112 and 82000838), Shenzhen Foundation of Science and Technology (grants JCYJ20170818103626421 and JCYJ2019 0806164009212), Guangdong Innovative and Entrepreneurial Research Team Program (grant 2019ZT08Y485), Sanming Project of Medicine in Shenzhen (grant SZSM201911004), Guangdong Natural Science Funds for Distinguished Young Scholar (grant 2021B1515020012), Guangdong Science and Technology Department (grant 2020B1212030004), and Advanced Medical Technology Center, The First Affiliated Hospital, Zhongshan School of Medicine, Sun Yat-sen University.
Authorship
Contribution: Q.L., K.J., and Q.X. designed and performed most experiments and analyzed the data; S.X., L.Y., Y.P., and J.C. contributed to animal experiments and transcriptional assay; J.W., J.Z., and L.J. contributed to the discussion; Q.L., L.J., and M.Z. wrote the paper; and M.Z. supervised the project.
Conflict-of-interest disclosure: The authors declare no competing financial interests.
Correspondence: Linjia Jiang, RNA Biomedical Institute, Sun Yat-sen Memorial Hospital, 107 Yanjiangxi Rd, Guangzhou, Guangdong Province, China, 510123; e-mail: jianglj7@mail.sysu.edu.cn; and Meng Zhao, Key Laboratory of Stem Cells and Tissue Engineering (Ministry of Education), Zhongshan School of Medicine, Sun Yat-sen University, 74, Zhongshan Second Road, Guangzhou, Guangdong, China, 510080; e-mail: zhaom38@mail.sysu.edu.cn.
Requests for original data may be submitted to Meng Zhao (zhaom38@mail.sysu.edu.cn).
The online version of this article contains a data supplement.
There is a Blood Commentary on this article in this issue.
The publication costs of this article were defrayed in part by page charge payment. Therefore, and solely to indicate this fact, this article is hereby marked “advertisement” in accordance with 18 USC section 1734.

This feature is available to Subscribers Only
Sign In or Create an Account Close Modal