

Key Points
HMGB1 alters erythropoiesis by inhibiting the EPO signaling pathway.
HMGB1 affects the EPO signaling pathway independently of RAGE.

Abstract
Anemia of inflammation, also known as anemia of chronic disease, is refractory to erythropoietin (EPO) treatment, but the mechanisms underlying the EPO refractory state are unclear. Here, we demonstrate that high mobility group box-1 protein (HMGB1), a damage-associated molecular pattern molecule recently implicated in anemia development during sepsis, leads to reduced expansion and increased death of EPO-sensitive erythroid precursors in human models of erythropoiesis. HMGB1 significantly attenuates EPO-mediated phosphorylation of the Janus kinase 2/STAT5 and mTOR signaling pathways. Genetic ablation of receptor for advanced glycation end products, the only known HMGB1 receptor expressed by erythroid precursors, does not rescue the deleterious effects of HMGB1 on EPO signaling, either in human or murine precursors. Furthermore, surface plasmon resonance studies highlight the ability of HMGB1 to interfere with the binding between EPO and the EPOR. Administration of a monoclonal anti-HMGB1 antibody after sepsis onset in mice partially restores EPO signaling in vivo. Thus, HMGB1-mediated restriction of EPO signaling contributes to the chronic phase of anemia of inflammation.
Introduction
Anemia of inflammation, most known as anemia of chronic disease, afflicts more than 1 billion individuals worldwide.1 It is a disabling complication in 60% of patients following sepsis or critical illness, and a complication in many patients with cancer, obesity, aging, and other syndromes of chronic inflammation including kidney disease, congestive heart failure, and chronic obstructive pulmonary diseases.1,2 Anemia of inflammation is refractory to treatment with erythropoietin (EPO), the most widely used agent to induce erythropoiesis and reverse anemia.3-5 EPO mechanism of action is mediated by binding to erythropoietin receptor (EPO-R), which homodimerizes, auto/trans-phosphorylates EPO-R–associated Janus kinase 2 (JAK2) and phosphorylates intracellular tyrosine residues of the EPO-R cytoplasmic domain.6,7 EPO-R phosphorylated residues in turn recruit STAT-1/3/5 to promote erythroid cell survival, growth, and differentiation.8,9 Despite the advanced knowledge of EPO mechanisms, and its widespread use during chronic illness, it is unknown why EPO fails to induce erythropoiesis and reverse the anemia of inflammation.
We recently implicated high mobility group box-1 protein (HMGB1) in sepsis-associated anemia in mice.10 HMGB1 is a nuclear protein that becomes a late inflammatory mediator once released in the extracellular space by dying cells or by activated innate immune cells.11 HMGB1 modulates the inflammatory response by binding to surface receptors including Toll-like receptors and the receptor for advanced glycation end products (RAGE).12,13
In the cecal ligation and puncture (CLP) model of sepsis survival, we observed that anemia developed as early as 3 days after surgery and persisted for at least a month.10 Although the levels of tumor necrosis factor (TNF) and interleukin 6 (IL-6) were acutely elevated, these cytokines returned to baseline within a week after CLP. Conversely, HMGB1 levels were elevated at later time points that corresponded to the chronic phase of inflammation. Of note, hepcidin was not involved in the pathogenesis of this anemia of sepsis. Recombinant HMGB1 injection phenocopied the deleterious effects of CLP-induced sepsis on erythropoiesis and administration of a neutralizing monoclonal antibody against HMGB1 protected mice from sepsis-associated anemia. These data suggested that HMGB1 is a mediator of anemia during the chronic phase of inflammation, but the molecular mechanisms by which HMGB1 exerted its effects remain unknown.
In this study, we find that HMGB1 suppresses erythropoiesis by inhibiting the EPO signaling pathway in an in vitro model of human erythropoiesis and in an in vivo mouse model of chronic inflammation. We demonstrate that HMGB1 targets erythroid precursor cells for cell death, at least in part by inhibiting the JAK2-STAT5 and the mTOR signaling pathways. Genetic ablation of RAGE, a known receptor of HMGB1 does not rescue this phenotype. Surface plasmon resonance studies show that HMGB1 can interfere with the interaction between EPO and the EPO-R. Using a monoclonal antibody against HMGB1, we can partially rescue the levels of phosphorylation of STAT5 in vivo. Taken together, our findings elucidate the mechanism of action of HMGB1 leading to anemia during the chronic phase of inflammation in sepsis survivors and suggest that HMGB1 plays a direct role in EPO-refractory anemia.
Methods
Hematopoietic stem and progenitor cell isolation and erythroid differentiation
Human CD34+ hematopoietic stem and progenitor cells (HSPCs) were isolated from de-identified cord blood and femoral head bone marrow in accordance with Institutional Review Board approval (Northwell Health). Mononuclear cells were separated from blood using Lymphoprep (Stem Cell Technologies) and incubated with anti-CD34 magnetic microbeads (Miltenyi Biotec). CD34+ HSPCs were subsequently column purified with magnetic cell separation columns as per manufacturer’s protocol (Miltenyi Biotec).
CD34+ HSPCs were differentiated to enucleated reticulocytes using a 3-phase erythroid differentiation system.14
Recombinant HMGB1
Recombinant HMGB1 (rHMGB1) was produced in the K.J.T. laboratory, as described previously.11,15 rHMGB1 contains all-thiol, disulfide, and sulfonyl isoforms. The ratio between these fractions is unknown.
Recombinant EPO
Epoietin α (Procrit) was clinical grade and obtained from the Hospital Pharmacy at Northwell Health.
Mice
All experiments were performed in accordance with the National Institutes of Health guidelines, under protocols approved by the Institutional Animal Care and Use Committee of the Feinstein Institute for Medical Research (Northwell Health).
Flow cytometry
Human erythroid progenitor populations
At indicated days of erythroid differentiation, 105 cells were stained with the following antibodies: anti–IL-3R phycoerythrin (PE)-Cy7, anti–glycophorin A (GPA) PE, anti-CD36 allophycocyanin (APC), and anti-CD34 fluorescein isothiocyanate. Burst-forming unit-erythroid (BFU-E) progenitors were immunophenotypically defined as IL-3Rneg, GPAneg, CD36lo, and CD34hi, and Colony-forming unit-erythroid (CFU-E) were defined as IL-3Rneg, GPAneg, CD36hi, and CD34lo as described in.16 7-Aminoactinomycin D (7AAD) stain was used to exclude nonviable cells from analysis.
Human terminal erythroid differentiation
Erythroid precursor differentiation was assessed at days 7, 11, and 14 of culture. A total of 105 cells were stained with anti-GPA PE, anti-α4-integrin APC, and anti-band 3 fluorescein isothiocyanate (produced by M.N.). Erythroblasts were defined as GPApos cells, and the extent of terminal differentiation was measured by the surface expression of α4-integrin and band 3. Individual erythroblast populations were resolved as previously described.17 7AAD stain was used to exclude nonviable cells from analysis.
Annexin V staining
Human CD34+ HSPCs or human umbilical cord blood-derived erythroid progenitor (HUDEP-2) cells at indicated days of differentiation were stained with Pacific Blue Annexin V (BioLegend) and 7AAD as per manufacturers protocol.
Statistical analyses
Results represent the average ± standard error of the mean (SEM). All statistical analyses comparing the different experimental groups were performed using GraphPad Prism 8 software for unpaired Student t test or analysis of variance (ANOVA) with Tukey’s post hoc test with corrections for multiple comparisons. A value of P < .05 was considered statistically significant.
Other methods
Additional methods are described in the supplemental Methods, available on the Blood Web site.
Results
HMGB1 impairs human erythropoiesis
We previously demonstrated that HMGB1 underlies the development of anemia in a murine model of sepsis survival.10 To study the role of HMGB1 in human erythropoiesis, we induced CD34+ HSPCs toward an erythroid fate in the presence of HMGB114,18 (Figure 1Aii). We observed a 1000-fold increase over 14 days in cell growth and hemoglobinization under control conditions (Figure 1Ai-Bi), but notably, HMGB1 inhibited this differentiation in a dose-dependent manner (Figure 1A; supplemental Figure 1A-B). The defect in cell growth began after day 4 (D4) and became significant at D6 of culture (supplemental Figure 1C), suggesting a defect at the CFU-E stage.16 Although HMGB1 did not change the number of immunophenotypically defined BFU-E (supplemental Figure 1D), we observed a 62% decrease in the number of immunophenotypically defined CFU-E by D7 in HMGB1-treated cultures (supplemental Figure 1E). To assess the effects of HMGB1 on cell proliferation, we subjected the erythroid cell line UT7-EPO to a 3-(4,5-dimethylthiazol-2-yl)-2,5-dimethyltetrazolium bromide assay in the presence of HMGB1 and observed a 50% decrease in their proliferation after 72 hours (Figure 1C). Although EPO-stimulated progenitors progressively increased expression of the erythroid marker GPA (Figure 1D; supplemental Figure 1F, upper left panel), HMGB1 significantly delayed GPA upregulation (Figure 1D-E; supplemental Figure 1F, upper right panels). We also observed a progressive block in differentiation at the basophilic erythroblast stage as increasing HMGB1 concentrations resulted in a decreased level of polychromatophilic erythroblasts, evaluated by their α4-integrin/Band 3 staining profile17 (supplemental Figure 1F, bottom panel), leading to very few polychromatophilic erythroblasts (Figure 1B,D,F). We conclude that HMGB1 impairs human erythropoiesis because of defects originating at the CFU-E stage that later affect precursors.
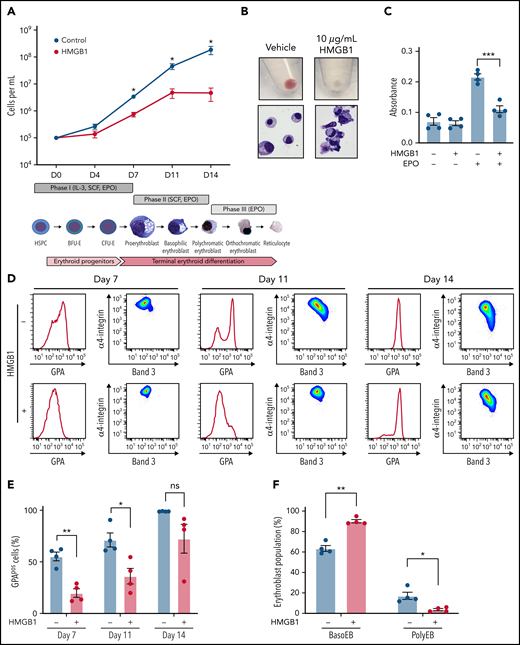
HMGB1 alters the growth and differentiation of erythroid precursors. (A) CB-derived CD34+ HSPCs were differentiated to enucleated reticulocytes using a 3-phase liquid culture system (ii) in the presence or absence of 10 μg/mL HMGB1. Erythroid cell growth measured at indicated days of differentiation (i). (B) Cell pellets demonstrating the extent of hemoglobinization (i) and cytospins showing cell morphology and level of differentiation (ii) at D14 of culture. (C) A 3-(4,5-dimethylthiazol-2-yl)-2,5-dimethyltetrazolium bromide assay on UT7-Epo cells after 72 hours in the presence of absence of HMGB1. (D) Representative flow cytogram of erythroid precursor maturation using GPA, α4-integrin, and band 3 surface expression at indicated days of culture. (E) Quantification of GPApos cells. (F) Quantification of erythroid precursor populations as a percentage of GPApos cells. Data represented as mean ± SEM. Unpaired, 2-tailed Student t test: *P < .05; **P < .01; ***P < .001; ns, not significant.
HMGB1 alters the growth and differentiation of erythroid precursors. (A) CB-derived CD34+ HSPCs were differentiated to enucleated reticulocytes using a 3-phase liquid culture system (ii) in the presence or absence of 10 μg/mL HMGB1. Erythroid cell growth measured at indicated days of differentiation (i). (B) Cell pellets demonstrating the extent of hemoglobinization (i) and cytospins showing cell morphology and level of differentiation (ii) at D14 of culture. (C) A 3-(4,5-dimethylthiazol-2-yl)-2,5-dimethyltetrazolium bromide assay on UT7-Epo cells after 72 hours in the presence of absence of HMGB1. (D) Representative flow cytogram of erythroid precursor maturation using GPA, α4-integrin, and band 3 surface expression at indicated days of culture. (E) Quantification of GPApos cells. (F) Quantification of erythroid precursor populations as a percentage of GPApos cells. Data represented as mean ± SEM. Unpaired, 2-tailed Student t test: *P < .05; **P < .01; ***P < .001; ns, not significant.
HMGB1 promotes death of erythroid precursors by inhibiting the EPO signaling pathway
These findings prompted us to investigate the mechanism by which HMGB1 led to a decrease in red cell output. HMGB1 modulates cell death once released in the extracellular space by regulating the cross talk between apoptosis and autophagy.19 Annexin-V staining revealed a significant increase in phosphatidylserine exposure, indicative of apoptosis, on polychromatophilic erythroblasts treated with HMGB1 (Figure 2A). Using an apoptosis array in cells at D11 of differentiation, we observed an increase in the expression level of cleaved caspase-3 and other regulators of apoptosis (Figure 2B; supplemental Figure 2A), and immunoblotting confirmed increased levels of cleaved capase-3 (Figure 2C-D). We then compared the expression of apoptosis-related proteins following treatment with TNF, IL-1, or IL-6, proinflammatory cytokines known to inhibit erythropoiesis, using an apoptosis array (supplemental Figure 2B-C). These experiments revealed similar patterns of apoptosis effectors suggesting that HMGB1 and other proinflammatory cytokines use common downstream effectors to trigger erythroid precursor death.
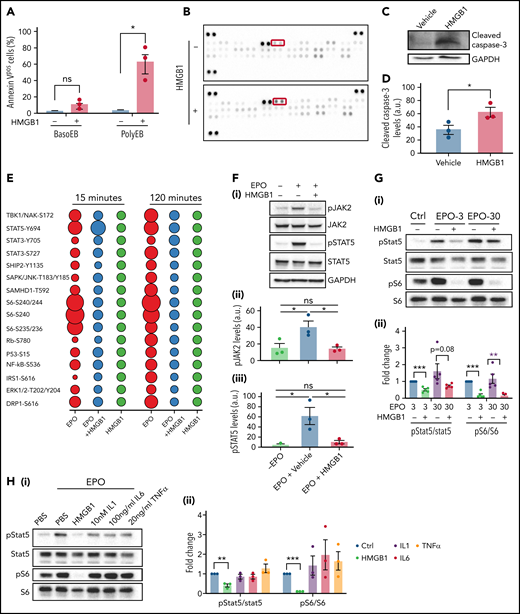
HMGB1 leads to death of erythroid precursors by inhibiting the EPO and mTOR signaling pathways. (A) Quantification of Annexin V staining in specific erythroid precursor populations by flow cytometry at D11 of differentiation. Data represented as mean ± SEM. Unpaired, 2-tailed Student t test: *P < .05; ns, not significant. (B) Apoptosis array performed on erythroid cells at D11. Cleaved casapse-3 is boxed. (C-D) Representative western blot of cleaved caspase-3 levels at D11 with accompanying quantification. Data represented as mean ± SEM. Unpaired, 2-tailed Student t test: *P < .05. (E) Bubble plot representation of EPO downstream effectors activation by phosphoflow cytometry. Human erythroid cells at D7 of differentiation were preincubated with HMGB1 and then pulsed with EPO for indicated times. (F) pJAK and pSTAT5 levels in HUDEP-2 cells preincubated with HMGB1 for 1 hour followed by a 4-hour pulse with EPO (i). Quantification of pJAK2 and pSTAT5 levels normalized to GAPDH (panels ii and iii). Data represented as mean ± SEM. One-way ANOVA with Tukey’s post hoc test: *P < .05; ns, not significant. (G) pSTAT5 and pS6 levels in CD34+ cells at D7 preincubated with HMGB1 for 1 hour followed by 30-minute pulse with 3 or 30 U/mL of EPO (i). Quantification of pSTAT5 and pS6 levels normalized to STAT5 and S6 (ii). (H) pSTAT5 and pS6 levels in CD34+ cells at D7 preincubated with 10 μg/mL HMGB1, 10 nM IL-1, 100 ng/mL IL-6, or 20 ng/mL TNF for 1 hour followed by 30-minute pulse with EPO (i). Quantification of pSTAT5 and pS6 levels normalized to STAT5 or S6 (ii). Data represented as mean ± SEM. One-way ANOVA with Tukey’s post hoc test: *P < .05; **P < .01; ***P < .001.
HMGB1 leads to death of erythroid precursors by inhibiting the EPO and mTOR signaling pathways. (A) Quantification of Annexin V staining in specific erythroid precursor populations by flow cytometry at D11 of differentiation. Data represented as mean ± SEM. Unpaired, 2-tailed Student t test: *P < .05; ns, not significant. (B) Apoptosis array performed on erythroid cells at D11. Cleaved casapse-3 is boxed. (C-D) Representative western blot of cleaved caspase-3 levels at D11 with accompanying quantification. Data represented as mean ± SEM. Unpaired, 2-tailed Student t test: *P < .05. (E) Bubble plot representation of EPO downstream effectors activation by phosphoflow cytometry. Human erythroid cells at D7 of differentiation were preincubated with HMGB1 and then pulsed with EPO for indicated times. (F) pJAK and pSTAT5 levels in HUDEP-2 cells preincubated with HMGB1 for 1 hour followed by a 4-hour pulse with EPO (i). Quantification of pJAK2 and pSTAT5 levels normalized to GAPDH (panels ii and iii). Data represented as mean ± SEM. One-way ANOVA with Tukey’s post hoc test: *P < .05; ns, not significant. (G) pSTAT5 and pS6 levels in CD34+ cells at D7 preincubated with HMGB1 for 1 hour followed by 30-minute pulse with 3 or 30 U/mL of EPO (i). Quantification of pSTAT5 and pS6 levels normalized to STAT5 and S6 (ii). (H) pSTAT5 and pS6 levels in CD34+ cells at D7 preincubated with 10 μg/mL HMGB1, 10 nM IL-1, 100 ng/mL IL-6, or 20 ng/mL TNF for 1 hour followed by 30-minute pulse with EPO (i). Quantification of pSTAT5 and pS6 levels normalized to STAT5 or S6 (ii). Data represented as mean ± SEM. One-way ANOVA with Tukey’s post hoc test: *P < .05; **P < .01; ***P < .001.
EPO protects erythroid precursors from death by activating the JAK2/STAT5 signaling pathway.20,21 We first evaluated changes in phosphorylated proteins by phospho-profiling at D7 of culture. As expected, EPO increased phosphorylation of STAT5, S6, Eukaryotic translation initiation factor 4E-binding protein 1 (4EBP1), nuclear factor-κB, extracellular signal-regulated kinase, and AKT at 15 and 120 minutes. However, preincubation with HMGB1 for 30 minutes reduced EPO-mediated phosphorylation of these effectors at 15 minutes (Figure 2E) and completely abolished their activation by 120 minutes. HMGB1 itself failed to induce significant changes in protein phosphorylation. HMGB1 significantly reduced EPO-induced JAK2 and STAT5 phosphorylation in serum-starved HUDEP-2 cells22 in a dose-dependent manner (Figure 2F; supplemental Figure 2D-F) and in primary cells despite the asynchronous nature of the culture system (Figure 2G). As expected from the phospho-profiling results, phospho-S6 levels were significantly reduced by HMGB1 even in the presence of EPO, suggesting inhibition of the mTOR pathway (Figure 2G). These changes in the EPO-mediated phosphorylation of STAT5 and S6 were specific to HMGB1 because they were not induced by TNF, IL-1, or IL-6, even at high concentrations (Figure 2H; supplemental Figure 2G). Consistent with these findings and the attenuated erythroid differentiation,23 nuclear GATA1 levels were significantly reduced in erythroid cells treated with EPO and HMGB1 (supplemental Figure 3A-B), and a quantitative polymerase chain reaction array showed downregulation of STAT5 targets (supplemental Figure 3C). Not even the use of 30 U/mL of EPO rescued the defects in pSTAT5 or pS6 induced by HMGB1 treatment in primary cells (Figure 2G). These data indicate that HMGB1 induces cell death by inhibiting the JAK2/STAT5 and the mTOR signaling pathways.
RAGE plays an active role during human erythropoiesis
HMGB1 binds to multiple membrane receptor families including RAGE and Toll-like receptors. RAGE, encoded by the AGER gene, is significantly expressed on human CB-derived CFU-E and erythroid precursors, whereas TLR4 is not (supplemental Figure 4A-B). We assessed the contribution of RAGE-HMGB1 interactions to the erythroid phenotype by using lentiviral encoded short hairpin RNAs (shRNAs) to knockdown RAGE in culture. Two different shRNAs corresponding to different regions of RAGE were used, with different knockdown efficiencies (Figure 3A). RAGE knockdown led to a decrease in cell growth consistent with the knockdown efficiency (Figure 3B). In the presence of EPO, knockdown cells presented a decrease in the levels of GPA (Figure 3Ci-D), along with delays in terminal erythropoiesis (Figure 3Ei). These data suggest that RAGE actively participates in human erythropoiesis. Because RAGE is a receptor for HMGB1, we tested its potential involvement during human erythropoiesis by knocking it down. Luciferase control or RAGE knockdown cells were cultured in the presence of HMGB1. Surprisingly, we observed an exacerbation of the phenotype. Indeed, cells that had been knocked down for RAGE and treated with HMGB1 presented a retarded cell growth (Figure 3F) and a failure to acquire GPA (Figure 3Cii-D) along with a block in terminal differentiation. Pulse experiments in the presence of EPO and HMGB1 revealed a failure to rescue pSTAT5 (Figure 3G). Because shRNA approaches can lead to nonspecific inhibition of erythropoiesis,24 we performed clustered regularly interspaced short palindromic repeats (CRISPR) knockout of RAGE in HUDEP-2 and CD34+ cells25 (supplemental Figure 5). We used 3 different single guide RNAs (sgRNAs), but at best, we could obtain only a 50% loss of RAGE protein in primary cells. Genome editing using the same 3 sgRNAs in HUDEP2 cells achieved a 70% decrease in RAGE protein levels; however, the cells did not tolerate RAGE loss and died rapidly after transduction. This suggests that total loss of RAGE is detrimental to human erythropoiesis and is consistent with our shRNA studies demonstrating that 80% to 90% knockdown leads to severe defects in proliferation and differentiation. Nevertheless, decreasing RAGE levels by 50% in primary cells did not attenuate the impact of HMGB1 on human erythropoiesis.
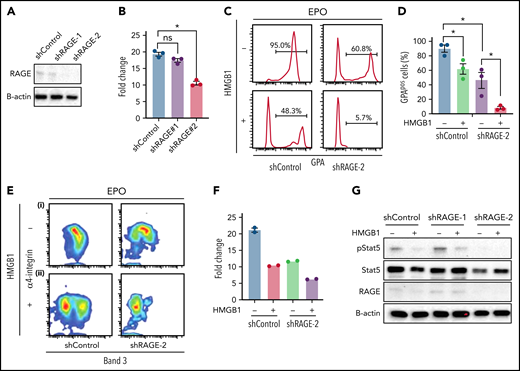
Knocking down RAGE does not rescue the effects of HMGB1. (A) RAGE knockdown efficiency measured at D4. (B) Cell expansion of infected cells over 7 days of culture. (C-E) (C) Representative flow cytogram of erythroid precursor differentiation using GPA surface expression at D11 of culture. (D) Quantification of GPApos cells at D11 of culture. (E) Representative flow cytogram of terminal erythroid differentiation using α4-integrin, and band 3 surface expression at D11 of culture. (F) Cell expansion of shControl and shRage-2–infected cells treated with HMGB1 for 7 days. (G) RAGE and pSTAT5 levels in shControl and shRage-2–infected cells at D7 preincubated with HMGB1 for 1 hour followed by 30-minute pulse with EPO. *P < .05; ns, not significant.
Knocking down RAGE does not rescue the effects of HMGB1. (A) RAGE knockdown efficiency measured at D4. (B) Cell expansion of infected cells over 7 days of culture. (C-E) (C) Representative flow cytogram of erythroid precursor differentiation using GPA surface expression at D11 of culture. (D) Quantification of GPApos cells at D11 of culture. (E) Representative flow cytogram of terminal erythroid differentiation using α4-integrin, and band 3 surface expression at D11 of culture. (F) Cell expansion of shControl and shRage-2–infected cells treated with HMGB1 for 7 days. (G) RAGE and pSTAT5 levels in shControl and shRage-2–infected cells at D7 preincubated with HMGB1 for 1 hour followed by 30-minute pulse with EPO. *P < .05; ns, not significant.
Altogether, these data indicate that HMGB1 impacts human erythropoiesis in a RAGE-independent manner.
HMGB1 can bind to both EPO and EPO-R, interfering with their interactions
Having ruled out RAGE as a receptor for the harmful response mediated by HMGB1 during human erythropoiesis, we turned to investigating a tentative influence mediated by protein phosphatases that can regulate the activity of downstream EPO effectors. Indeed, HMGB1 inhibits signal transduction pathways through the activation of phosphatases such as SHP-1.26 Cells were treated with increasing concentrations of the SHP1/SHP2 inhibitor NSC87877 in the presence of EPO and HMGB1.27 Notably, however, concentrations in excess of the half maximal inhibitory concentration of NSC87877 failed to prevent the decrease in STAT5 phosphorylation (Figure 4A). The involvement of other phospho-tyrosine phosphatases was also tested using the phosphatase inhibitor orthovanadate.28 Although STAT5 phosphorylation was increased in progenitors treated with EPO together with orthovanadate, this increase in phosphorylation was modest in the presence of HMGB1 (Figure 4B). These results demonstrate that inhibition of EPO signaling by HMGB1 is independent of the activation of intracellular phosphatases.
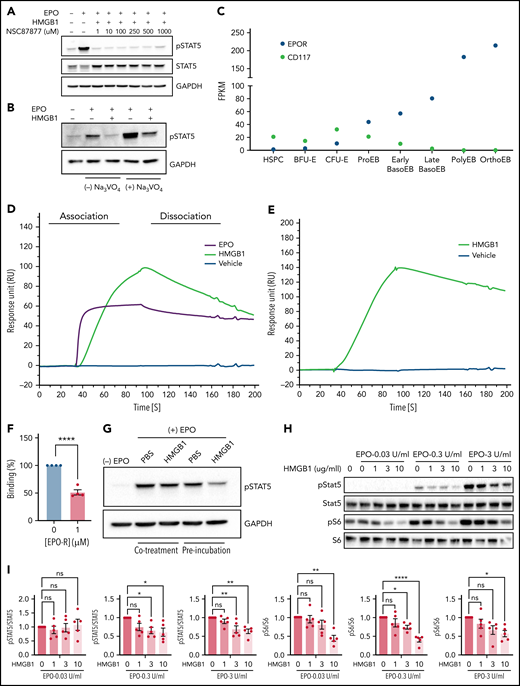
HMGB1 can interact with the extracellular domain of the erythropoietin receptor and EPO. (A) HUDEP-2 cells preincubated with HMGB1 ± increasing concentrations of NSC87877 followed by a 4-hour pulse of EPO. pSTAT5 levels measured by western blot. (B) HUDEP-2 cells were preincubated with HMGB1 ± sodium orthovanadate followed by a 4-hour pulse of EPO. pSTAT5 levels measured by western blot. (C) Transcriptome analysis of EPO-R and CD117 expression on sorted stages during human erythropoiesis adapted from Yan et al.18 (D) SPR analysis of EPO (purple line), vehicle (blue line), and HMGB1 (green line) binding to the extracellular domain of EPO-R. (E) SPR analysis of vehicle (blue line) and HMGB1 (green line) binding to EPO. (F) Quantification of HMGB1 binding to EPO in the presence or absence of EPO-R in the analyte as assessed by SPR. Data represented as mean ± SEM. Unpaired, 2-tailed Student t test: **P < .01. (G) HUDEP-2 cells were either preincubated with HMGB1 followed by a pulse of EPO or cotreated with HMGB1 and EPO. pSTAT5 levels following 1-hour pulse of EPO. (H) UT7-Epo cells were preincubated with increasing concentrations of HMGB1 followed by a 30-minute pulse of 0.03, 0.3, or 3 IU/mL EPO. pSTAT5 and pS6 levels measured by western blot. Quantification of pSTAT5 and pS6 levels normalized to STAT5 or S6. Data represented as mean ± SEM. One-way ANOVA with Tukey’s post hoc test: *P < .05; **P < .01; ****P < .0001.
HMGB1 can interact with the extracellular domain of the erythropoietin receptor and EPO. (A) HUDEP-2 cells preincubated with HMGB1 ± increasing concentrations of NSC87877 followed by a 4-hour pulse of EPO. pSTAT5 levels measured by western blot. (B) HUDEP-2 cells were preincubated with HMGB1 ± sodium orthovanadate followed by a 4-hour pulse of EPO. pSTAT5 levels measured by western blot. (C) Transcriptome analysis of EPO-R and CD117 expression on sorted stages during human erythropoiesis adapted from Yan et al.18 (D) SPR analysis of EPO (purple line), vehicle (blue line), and HMGB1 (green line) binding to the extracellular domain of EPO-R. (E) SPR analysis of vehicle (blue line) and HMGB1 (green line) binding to EPO. (F) Quantification of HMGB1 binding to EPO in the presence or absence of EPO-R in the analyte as assessed by SPR. Data represented as mean ± SEM. Unpaired, 2-tailed Student t test: **P < .01. (G) HUDEP-2 cells were either preincubated with HMGB1 followed by a pulse of EPO or cotreated with HMGB1 and EPO. pSTAT5 levels following 1-hour pulse of EPO. (H) UT7-Epo cells were preincubated with increasing concentrations of HMGB1 followed by a 30-minute pulse of 0.03, 0.3, or 3 IU/mL EPO. pSTAT5 and pS6 levels measured by western blot. Quantification of pSTAT5 and pS6 levels normalized to STAT5 or S6. Data represented as mean ± SEM. One-way ANOVA with Tukey’s post hoc test: *P < .05; **P < .01; ****P < .0001.
Because intracellular phosphatases are not affected by HMGB1 during erythropoiesis, we next evaluated the contribution of HMGB1 to the interactions between EPO and its receptor. Indeed, the observed erythroid defect correlated with the expression profile of the EPO-R (Figure 4C), leading us to hypothesize that HMGB1 may alter EPO signaling upstream at the level of EPO-R activation. We used surface plasmon resonance (SPR) to evaluate a potential interaction of HMGB1 and the extracellular domain of the EPO-R. HMGB1 bound to EPO-R with an affinity in the nanomolar range but less than that of EPO (KD = 136 nM for HMGB1 and 4 nM for EPO; Figure 4D). The on-rate of binding of EPO was 10-fold higher than that of HMGB1 (supplemental Table 1). HMGB1 was also found to bind to EPO by SPR with a KD = 110 nM (Figure 4E; supplemental Table 2), and HMGB1/EPO-R complex formation inhibited EPO binding to its receptor (Figure 4F). At the cellular level, preincubation of cells with HMGB1 resulted in a higher-level inhibition of STAT5 phosphorylation compared with cells coincubated with HMGB1 and EPO at the same time (Figure 4G). Experiments performed on the EPO-dependent UT7-EPO cell line29 demonstrated that the levels of EPO and HMGB1 are critical. We observed a dose-dependent decrease in EPO signaling as the concentration of HMGB1 was increased. Furthermore, we found that higher concentrations of HMGB1 were required to decrease S6 phophorylation when cells were stimulated with higher EPO doses; at 0.3 IU/mL EPO, S6 phosphorylation was already decreased at 3 μg/mL HMGB1, whereas at 3.0 IU/mL EPO, decreased S6 phosphorylation was only detected at 10 μg/mL of HMGB1 (Figure 4H-I). Thus, higher levels of HMGB1 are necessary to inhibit high-dose EPO signaling.
The 3 cysteines in HMGB1 are essential for its function during human erythropoiesis
HMGB1 contains 3 cysteines (C23, C45, C106) within the A- and B-box domains that mediate its interactions with distinct receptors and biologic responses.30 To address this directly, we used a mutant HMGB1 in which these cysteine residues are replaced by a serine (3S-HMGB1)31 and observed that the 3S-HMGB1 lacked inhibitory activity in erythroid cells. In contrast to HMGB1, neither total cell numbers nor hemoglobinization were decreased in HUDEP-2 cells after 2 or 5 days of culture in the presence of 3S-HMGB1 (Figure 5A-B). The apoptosis levels in cells treated with 3S-HMGB1 were comparable to untreated cells (Figure 5C), and there was no significant increase in cleaved caspase-3 levels (Figure 5D). SPR analyses revealed that 3S-HMGB1 did not bind to the extracellular domain of the EPO-R and bound very weakly to EPO (Figure 5E-F; supplemental Tables 1 and 2), and as a consequence, the levels of pSTAT5 were mostly unaffected by 3S-HMGB1 treatment (Figure 5G). Together, these data indicate that the 3 cysteines in HMGB1 are essential for its deleterious effects on human erythropoiesis.
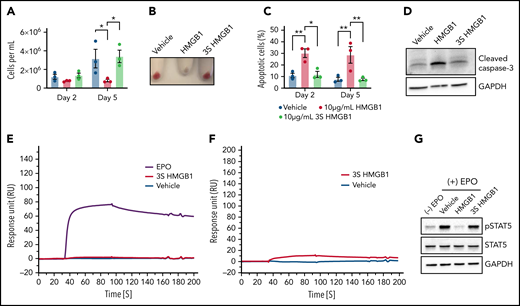
The 3 cysteine residues are important for HMGB1 function in erythropoiesis. (A-D) HUDEP-2 cells were treated with WT or mutated (3S) HMGB1. (A) Cell growth measured at indicated days of differentiation. (B) Cell pellets demonstrating the extent of hemoglobinization at D5. (C) Annexin V staining of HUDEP-2 cells at indicated days of culture. (D) Representative Western blot of cleaved caspase-3 levels at D5. (E) Surface plasmon resonance analysis of EPO (purple line), vehicle (blue line), and 3S HMGB1 (red line) binding to the extracellular domain of EPO-R. (F) Surface plasmon resonance analysis of vehicle (blue line) and 3S HMGB1 (red line) binding to EPO. (G) HUDEP-2 cells were preincubated with WT or 3S HMGB1 for 1 hour followed by a 4-hour pulse of EPO. pSTAT5 levels measured by western blot. Data presented as mean ± SEM. One-way ANOVA with Tukey’s post hoc test: *P < .05, **P < .01.
The 3 cysteine residues are important for HMGB1 function in erythropoiesis. (A-D) HUDEP-2 cells were treated with WT or mutated (3S) HMGB1. (A) Cell growth measured at indicated days of differentiation. (B) Cell pellets demonstrating the extent of hemoglobinization at D5. (C) Annexin V staining of HUDEP-2 cells at indicated days of culture. (D) Representative Western blot of cleaved caspase-3 levels at D5. (E) Surface plasmon resonance analysis of EPO (purple line), vehicle (blue line), and 3S HMGB1 (red line) binding to the extracellular domain of EPO-R. (F) Surface plasmon resonance analysis of vehicle (blue line) and 3S HMGB1 (red line) binding to EPO. (G) HUDEP-2 cells were preincubated with WT or 3S HMGB1 for 1 hour followed by a 4-hour pulse of EPO. pSTAT5 levels measured by western blot. Data presented as mean ± SEM. One-way ANOVA with Tukey’s post hoc test: *P < .05, **P < .01.
HMGB1-mediated restriction of EPO signaling occurs in vivo independently of Rage
We next studied these mechanisms in vivo by assessing the impact of HMGB1 in the bone marrow of wild-type (WT) vs Rage−/− mice (Figure 6A). At steady state, Rage−/− mice expressed normal blood counts (supplemental Table 3). We performed ex vivo EPO stimulation assays on the nucleated population of the total bone marrow from WT or Rage−/− mice.32,33 Pretreatment with HMGB1 led to a slight inhibition of pSTAT5 despite EPO stimulation in cells derived from WT mice (Figure 6B-C). As we had observed in our human in vitro system, the effect of HMGB1 was increased in cells from Rage−/− mice, leading to a significant decrease in pSTAT5 levels (Figure 6B-C). Although these data further suggested that HMGB1 exerts its effects on erythropoiesis independently of RAGE, we also used an additional model of anemia to evaluate the cross talk between HMGB1 and RAGE. Specifically, we induced acute inflammation in WT and Rage−/− mice by injecting them intraperitoneally with lipopolysaccharide (LPS) (50 U/20 g body weight).11 LPS induced reticulocytosis and decreased hemoglobin, mean corpuscular hemoglobin (MCH), and mean corpuscular hemoglobin concentration (MCHC) in WT mice. Notably, however, although a similar decrease in MCH and MCHC was observed in Rage−/− animals, these mice did not present with reticulocytosis (Figure 6D). All LPS-treated animals were then injected with a single dose of recombinant HMGB1 (10 μg/20 g body weight) and bone marrow was harvested 1 week later. Ex vivo EPO stimulation of nucleated cells in the presence or absence of HMGB1 revealed a similar decrease in EPO-induced STAT5 and S6 phosphorylation in both WT and Rage−/− cells after HMGB1 treatment (Figures 6E). Together, these data strongly suggest that HMGB1-mediated restriction of EPO signaling occurs independently of RAGE.
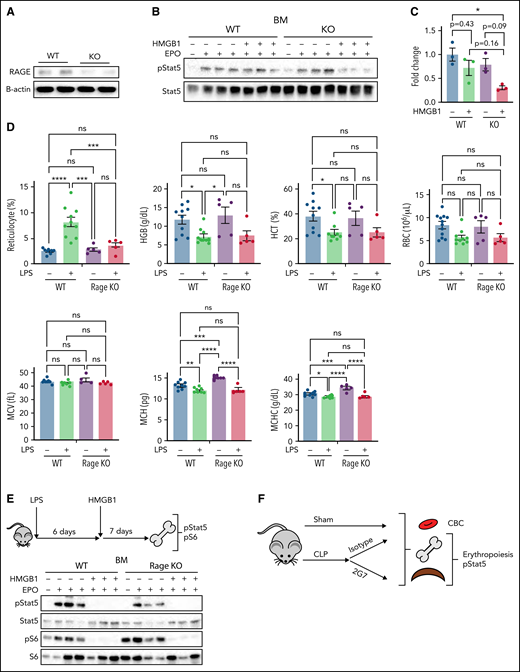
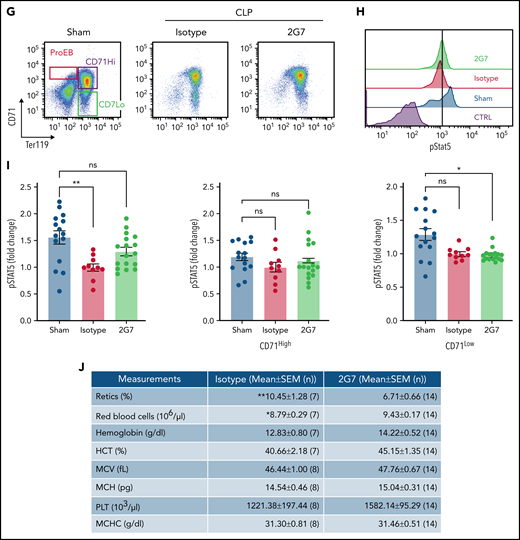
Anti-HMGB1 monoclonal antibody rescues EPO signaling in murine model of sepsis. (A) RAGE expression levels measured by western blot in the bone marrow of WT vs Rage−/− mice. (B) pSTAT5 levels measured by western blot in ex vivo EPO stimulation assays in the total nucleated bone marrow population from WT and Rage−/− in the presence or absence of HMGB1. (C) Quantification of the levels of pSTAT5 in the indicated conditions expressed as fold change compared with pSTAT5 levels in WT in the absence of HMGB1. (D) Complete blood counts in WT and Rage−/− mice 6 days after LPS treatment. (E) Seven days after HMGB1 treatment in vivo, pSTAT5 and pS6 levels measured by western blot in ex vivo EPO stimulation assays in the total nucleated bone marrow population from WT and Rage−/− in the presence or absence of an additional dose of HMGB1. Sepsis was induced by cecal ligation and puncture (CLP) or not (eg, sham) in groups of mice. At 9 days after sepsis induction, mice were treated with isotype IgG or neutralizing anti-HMGB1 mAb (2G7) for 3 consecutive days. All data were collected at D21 after the CLP procedure. (F) Schematic of experimental design. (G) Representative flow cytograms with gating strategy of bone marrow terminal erythroid differentiation using Ter119 and CD71 surface markers. (H) Representative histograms of bone marrow ProEB pSTAT5 levels by phosphoflow. (I) Quantification of pSTAT5 levels in the ProEB, CD71High and CD71Low populations from bone marrow by phosphoflow expressed as fold change compared with pSTAT5 levels in mice treated with the isotype control. (J) Red cell and platelet indices of isotype and 2G7-treated CLP mice. Data presented as mean ± SEM. (C-D,I) One-way ANOVA with Tukey’s post hoc test: *P < .05; ns, not significant. (J) Unpaired, 2-tailed Student t test: **P < .01; ns, not significant.
Anti-HMGB1 monoclonal antibody rescues EPO signaling in murine model of sepsis. (A) RAGE expression levels measured by western blot in the bone marrow of WT vs Rage−/− mice. (B) pSTAT5 levels measured by western blot in ex vivo EPO stimulation assays in the total nucleated bone marrow population from WT and Rage−/− in the presence or absence of HMGB1. (C) Quantification of the levels of pSTAT5 in the indicated conditions expressed as fold change compared with pSTAT5 levels in WT in the absence of HMGB1. (D) Complete blood counts in WT and Rage−/− mice 6 days after LPS treatment. (E) Seven days after HMGB1 treatment in vivo, pSTAT5 and pS6 levels measured by western blot in ex vivo EPO stimulation assays in the total nucleated bone marrow population from WT and Rage−/− in the presence or absence of an additional dose of HMGB1. Sepsis was induced by cecal ligation and puncture (CLP) or not (eg, sham) in groups of mice. At 9 days after sepsis induction, mice were treated with isotype IgG or neutralizing anti-HMGB1 mAb (2G7) for 3 consecutive days. All data were collected at D21 after the CLP procedure. (F) Schematic of experimental design. (G) Representative flow cytograms with gating strategy of bone marrow terminal erythroid differentiation using Ter119 and CD71 surface markers. (H) Representative histograms of bone marrow ProEB pSTAT5 levels by phosphoflow. (I) Quantification of pSTAT5 levels in the ProEB, CD71High and CD71Low populations from bone marrow by phosphoflow expressed as fold change compared with pSTAT5 levels in mice treated with the isotype control. (J) Red cell and platelet indices of isotype and 2G7-treated CLP mice. Data presented as mean ± SEM. (C-D,I) One-way ANOVA with Tukey’s post hoc test: *P < .05; ns, not significant. (J) Unpaired, 2-tailed Student t test: **P < .01; ns, not significant.
Finally, we used a CLP model of polymicrobial sepsis in mice as previously described10 (Figure 6F-G). Only WT mice were used becuase Rage−/− mice are protected against septic shock induced by CLP.34 Phosphoflow analyses on the different populations of proerythroblasts (ProEB), CD71High, and CD71Low (Figure 6H) demonstrated that bone marrow ProEB contained decreased endogenous pSTAT5 levels in the CLP group and that these levels were partially rescued using 2G7, a neutralizing HMGB1-specific monoclonal antibody (Figure 6H-I). 2G7 targets the A-box domain of HMGB1,35 which in contrast to the B-box domain, is necessary for binding to EPO-R and EPO (supplemental Figure 6A-B).
An increase in pSTAT5 was also noticed in the ProEB and CD71High populations of the spleen of animals treated with 2G7, indicative of stress erythropoiesis (supplemental Figure 7A-B). For unknown reasons, we observed the effect of 2G7 on pSTAT5 levels occurred in some animals (termed responders) but not in others (termed nonresponders). These changes were associated with a significant increase in the red cell number and a concomitant decrease in the reticulocyte count in 2G7-treated CLP animals compared with control CLP mice (Figure 6J). Other hematologic parameters were also improved, demonstrating a pathogenic role for HMGB1 in sepsis-associated anemia.
Discussion
Our findings provide evidence that HMGB1 inhibits EPO signaling both in mouse and human erythropoiesis. HMGB1 leads to the death of erythroid precursors through a mechanism targeting the JAK2/STAT5 and the mTOR signal transduction pathways. Importantly, however, the presence of RAGE attenuates the effect triggered by HMGB1 on erythroid precursors. HMGB1 negatively interferes with the interaction between EPO and its receptor, and we propose that agents that target HMGB1 levels can potentially be used to treat anemia of inflammation that is refractory to endogenous and exogenous sources of EPO.
HMGB1 is a late mediator of systemic inflammation. To date, direct inhibition of erythropoiesis has mostly focused on dysfunctional iron homeostasis or the upregulation of antisurvival pathways downstream of cytokines and their cognate receptors during the acute phase of inflammation.2 Thus, our findings highlight a direct role of HMGB1 in inhibiting erythropoiesis during the chronic phase of inflammation. In support of our findings, we did not observe increased hepcidin levels after the acute phase of inflammation.10 In addition, in our experiments, IL-1, IL-6, TNF did not inhibit STAT5 and mTOR signaling, even at high concentrations.
Despite our focus on erythroid precursors in this study, we also observed an earlier proliferation and differentiation defect at the CFU-E stage that was independent of apoptosis. EPO signal transduction was attenuated in both erythroid populations, but loss of signaling manifested with different phenotypes in CFU-E and erythroblasts. The finding that HMGB1 inhibits activation of the mTOR signaling pathway could help to reconcile these phenotypic differences. A role for the mTOR pathway in erythropoiesis has been shown in different studies, in the context of iron-restricted erythropoiesis36 and Diamond Blackfan anemia, a rare bone marrow failure syndrome.37 In iron-restricted anemia, inhibition of the mTOR pathway led to a decrease in cell growth, whereas in Diamond Blackfan anemia, activation of the mTOR pathway by leucine led to an increase in cell growth. In the context of HMGB1, similarly to iron-restricted erythropoiesis, we postulate that inhibition of the mTOR pathway leads to decreased cell growth.36,38,39 Furthermore, mTOR is a downstream target of EPO-FOXO3 signaling axis and has been shown to regulate the CFU-E to ProEB transition through mitochondrial biogenesis.40,41 It is conceivable that decreased mTOR activity resulting from decreased EPO-R activation causes a cumulative defect, potentially from altered metabolism secondary to mitochondrial development or absence of anti-apoptotic signals, which ultimately induces erythroid precursor death. Notably, however, despite this reduction in the number of precursors, those that escape cell death can appropriately differentiate to the red cell lineage.
An alternative and more provocative hypothesis is that activation of downstream effectors by EPO possesses a bias that is cell context specific whereby EPO drives CFU-E and erythroid precursor specific regulatory programs, which can be modulated by the expression levels of EPO-R and signaling molecules and membrane receptor-coreceptor milieu. The possibility of stage-specific regulation of cytokine signaling has been recently explored using synthetic EPO-R binding peptides.42
A regulatory role for RAGE in erythropoiesis is a novel finding of this study, suggesting that RAGE does not rescue EPO signaling from the detrimental effects of HMGB1. The fact that the phenotype was maintained in the absence of RAGE suggests that HMGB1 binds to an additional target during the differentiation process. Because of the lack of reliable antibodies against the EPO-R, it is difficult to fully evaluate the role of EPO-R in the HMGB1-triggered response. Nevertheless, our data on EPO signaling suggest its potential involvement. Indeed, our data demonstrating that high levels of HMGB1 are necessary to observe stronger inhibition of EPO signaling indicate that either the affinity or the ratio of soluble EPO and HMGB1 are critical for determining the downstream signaling cascade leading to the death or survival of erythroid precursors. Accordingly, in vivo, HMGB1 levels peak when the levels of EPO return to baseline and remain elevated for at least 6 weeks.10 Similar findings were recently reported for IL-22 and its receptor,43 further supporting the importance of cytokine ratios in determining outcomes of anemia of inflammation. It will be of interest to determine how serum HMGB1 levels vary in Rage−/− animals after induction of inflammation. It is indeed possible that RAGE serves to dampen HMGB1 expression or to sequester it from EPO-R.
Our observations carry broad implications for the mechanistic understanding of anemia of inflammation, and for development of experimental therapeutic strategies. First, it was previously unknown how EPO is rendered ineffective as a treatment in the anemia of chronic disease. Second, because the administration of neutralizing anti-HMGB1 antibodies partially rescues pSTAT5 signaling and increases red blood cell counts while decreasing the number of circulating reticulocytes, it is reasonable to consider pursuing this pathway for experimental therapy. Because 2G7 binds the A-box domain of HMGB1, future studies will address the potential relevance a monoclonal antibody against B-box. An appealing alternative therapeutic approach would be to develop a small molecule that activates the receptor through a mechanism independent of HMGB1 binding. A putative extracellular segment on the receptor more proximal to the transmembrane domain of EPO-R could be used thereby avoiding the hypothesized HMGB1 binding sites located at the N terminus of EPO-R In support of this concept, eltrombopag, which binds to the transmembrane segment of the thrombopoietin receptor, activates receptor signaling in the absence of ligand.44 Third, the long-term effect of HMGB1 could have potential significant implications in studies of anemia of inflammation, a syndrome of significant unmet therapeutic need. In the CLP model, mice remain anemic for at least 6 weeks after surgery. Although we have not here investigated the consequences of long-term exposure to HMGB1 in vivo, a recent study using zymosan to induce inflammation resulted in periodic anemia over time.45 Nonetheless, these mechanistic findings favor additional work delineating the pathophysiologic and therapeutic implications of targeting HMGB1 in the anemia of inflammation.
Acknowledgments
The authors thank Mark J. Koury and Lily Huang for helpful discussions and critical reading of the manuscript, Patrick Mayeux for contributing the UT7-Epo cells, Marco Bianchi for contributing 3S HMGB1 and critical reading of the manuscript, Merav Socolovsky and Daniel Hidalgo for help with the phospho-flow experiments, and Frank Jenkins with help with the phospho-profiling analysis. The graphical abstract was created with Biorender.
This research was supported, in part, by National Institutes of Health grants DK32094 (National Institute of Diabetes and Digestive and Kidney Diseases [N.T. and N.M.]), HL134812 (National Heart, Lung, and Blood Institute [J.M.L. and L.B.]) and HL144436 and HL152099 (L.B.), AI102852 (National Institute of Allergy and Infectious Diseases [B.D. and K.J.T.]), and GM118182 (National Institute of General Medical Sciences [K.J.T.]).
Authorship
Contribution: B.M.D., Y.T., N.M., U.A., Y.A.A., K.J.T., and L.B. designed the research; B.M.D., Y.T., and J.P. performed most of the experiments; J.H. analyzed RNAseq experiments; M.H. and Y.A.A. designed, performed, and analyzed the surface plasmon resonance experiments; J.L. prepared HMGB1 and the monoclonal antibody (2G7) used in the study; M.E.A., E.B., and R.J.A. contributed to the in vivo experiments; C.A.-B. contributed to the analyses of the qPCR arrays, L.K. contributed to the western blots; R. K. and Y. N. contributed the HUDEP-2 cells and analyzed data related to the HUDEP-2 cells, L.A.S. provided guidance on the CRISPR experiments, B.M.D., Y.T., J.P., M.H., H.Y., E.B., R.J.A., C.A.-B., J.H., R.K., Y.N., B.D., B.J.B., O.H., P.G.G., L.A.S., J.M.L., N.T., N.M., U.A., Y.A.A., K.J.T., and L.B. analyzed and interpreted the data; B.M.D. and L.B. cowrote the manuscript; Y.T., H.Y., B.D., B.J.B., O.H., P.G.G., L.A.S., J.M.L., N.T., N.M., U.A., Y.A.A., and K.J.T. edited the manuscript; and all authors read and commented on the final manuscript.
Conflict-of-interest disclosure: The authors declare no competing financial interests.
Correspondence: Lionel Blanc, Nelkin Laboratory of Pediatric Oncology and Laboratory of Developmental Erythropoiesis, Institute of Molecular Medicine, The Feinstein Institutes for Medical Research, 350 Community Dr, Manhasset, NY 11030; e-mail: lblanc@northwell.edu.
The online version of this article contains a data supplement.
There is a Blood Commentary on this article in this issue.
Data related to the phosphoprofiling are provided as supplemental Table 4. All data and reagents described in this study are available to the scientific community upon request to K.J.T. or L.B.
The publication costs of this article were defrayed in part by page charge payment. Therefore, and solely to indicate this fact, this article is hereby marked “advertisement” in accordance with 18 USC section 1734.

This feature is available to Subscribers Only
Sign In or Create an Account Close Modal