

Key Points
Neutrophils stabilize HIF-1α through the release of mitochondrial ROS.
The glycerol 3-phosphate shuttle links glycolysis to HIF-1 stabilization, maintaining mitochondrial membrane potential and cell survival.

Abstract
Neutrophils are predominantly glycolytic cells that derive little ATP from oxidative phosphorylation; however, they possess an extensive mitochondrial network and maintain a mitochondrial membrane potential. Although studies have shown neutrophils need their mitochondria to undergo apoptosis and regulate NETosis, the metabolic role of the respiratory chain in these highly glycolytic cells is still unclear. Recent studies have expanded on the role of reactive oxygen species (ROS) released from the mitochondria as intracellular signaling molecules. Our study shows that neutrophils can use their mitochondria to generate ROS and that mitochondrial ROS release is increased in hypoxic conditions. This is needed for the stabilization of a high level of the critical hypoxic response factor and pro-survival protein HIF-1α in hypoxia. Further, we demonstrate that neutrophils use the glycerol 3-phosphate pathway as a way of directly regulating mitochondrial function through glycolysis, specifically to maintain polarized mitochondria and produce ROS. This illustrates an additional pathway by which neutrophils can regulate HIF-1α stability and will therefore be an important consideration when looking for treatments of inflammatory conditions in which HIF-1α activation and neutrophil persistence at the site of inflammation are linked to disease severity.
Introduction
HIF-1α stabilization is critical for myeloid cell-mediated inflammation and neutrophil survival in hypoxic tissue.1,2 The stabilization of HIF-1α has been shown to mediate the pro-inflammatory effects of hypoxia; however, prolonged or exaggerated expression of HIF-1α is linked to pathological inflammatory conditions such as rheumatoid arthritis and chronic obstructive pulmonary disease.3 Similarly, suppression of HIF-1α is capable of encouraging inflammation resolution and limiting tissue injury4; upstream pathways that regulate HIF-1α and strategies to modulate these pathways that are specific to neutrophils are therefore of great interest.
In other cell types, the release of mitochondrial reactive oxygen species (mROS) in hypoxic conditions has been shown to stabilize HIF-1α through a mechanism dependent on complex III of the respiratory chain.5-7 Neutrophils possess a network of mitochondria that maintain the mitochondrial membrane potential and releases mROS; however, mitochondria contribute little to the cellular ATP pool, with limited neutrophil expression of mitochondrial electron transport complexes.8,9 These data indicate an alternative pathway may regulate neutrophil mitochondrial ROS release. A study by van Raam et al showed isolated neutrophil mitochondria can maintain mitochondrial membrane potential using exogenous glycerol 3-phosphate, suggesting neutrophils possess a functional glycerol 3-phosphate shuttle.10 The glycerol 3-phosphate shuttle is a direct link between glycolysis and mitochondrial ROS release and has been implicated in regulating mROS release during T-cell activation.11 This shuttle is also critical in macrophages for moderating the inflammatory response during prolonged lipopolysaccharide exposure12; however, there have been no studies describing a functional role for the glycerol 3-phosphate shuttle in neutrophils thus far.
We questioned whether neutrophils can stabilize HIF-1α through releasing mitochondrial ROS by the glycerol 3-phosphate shuttle, and whether the glycerol 3-phosphate shuttle acts as a direct link between glycolysis and HIF-1α stabilization in these highly glycolytic cells.
Study design
Ethics
Phlebotomy of healthy volunteers was approved by the Lothian Local Research Ethics Committee (AMREC 20-HV-069). Volunteers gave full informed consent to participate.
Neutrophil culture
Neutrophils were isolated via Percoll density centrifugation and cultured at 5 × 10⁶ cells per mL in 1 × RPMI 1640 supplemented with 10% fetal calf serum and 1% penicillin/streptomycin in either normoxia (21% O2), physiological normoxia (10%), or pathophysiological hypoxia (1% O2) for up to 20 hours.
Analysis of mitochondrial membrane potential and mROS using tetramethylrhodamine, methyl ester, or MitoSOX dye
Neutrophils were cultured for 1 hour before resuspension in tetramethylrhodamine (TMRM) staining solution or MitoSOX (M36008; Thermo Fisher Scientific) staining solution, with or without 10 μM carbonyl cyanide m-chlorophenyl hydrazone, 2-deoxyglucose (2-DG), or iGP-1 (1μM-1 mM). Cell fluorescence was analyzed using an Attune NxT Cytometer (see supplemental Methods, available on the Blood Web site).
Analysis of intracellular ROS using DCF
Neutrophils were cultured for 1 hour before addition of 3 μL dichlorofluorescein (DCF) working solution and incubation for 30 minutes. A total of 100 nM of N-formylmethionine leucyl-phenylalanine (fMLF) was added and cells incubated for a further 30 minutes before analysis using an Attune NxT Flow Cytometer (supplemental Methods).
Western blotting
Neutrophils were cultured for 4 hours with and without iGP-1 (1 μM-1 mM), rotenone (2 μM), oxaloacetate (2 μM), antimycin A (10 ng/mL), diphenyleneiodonium (DPI, 10 μM), myeloperoxidase inhibitor-I (100 μM), or MitoTEMPO (100 μM) before lysates were prepared for western blotting (supplemental Methods).
Neutrophil phagocytosis of heat-killed Staphylococcus aureus
Neutrophils were cultured for 1 hour in normoxic or pre-equilibrated hypoxic media ±100 μM iGP-1, 1 mM iGP-1, or a dimethyl sulfoxide vehicle control before infection with carboxyfluorescein succinimidyl ester-labeled heat-killed S aureus serotype SH1000 (multiplicity of infection 1:1) for 5 minutes and analysis using an Attune NxT cytometer.
Statistics
Results expressed as mean ± standard error of the mean (SEM) from (n) independent experiments. Data were analyzed using 1-way analysis of variance (ANOVA) with Holm-Sidak correction for multiple comparisons, 2-way ANOVA with Tukey’s correction for multiple comparisons, or paired Student t test. Statistical analysis performed using GraphPad Prism. *P < .05, **P < .01, ****P < .0001.
Results and discussion
To determine whether hypoxia induces neutrophil mROS production as previously reported in fibroblasts,7 we cultured peripheral blood neutrophils from healthy volunteers in either in vitro normoxia (21% O2), a physiological oxygen level (10% O2), or in pathophysiological hypoxia (1% O2) and measured mROS production using MitoSOX fluorimetric dye. Hypoxia significantly enhanced the production of mROS after 1 hour in culture over normoxic levels, with no difference in mROS levels between 21% and 10% O2 after 1 hour in culture (Figure 1A). Treatment with 100 μM of the ROS scavenger MitoTEMPO was sufficient to significantly reduce mROS levels in live neutrophils (Figure 1A). The hypoxic increase in ROS was specific to the mitochondria, as total intracellular ROS levels were reduced in hypoxia as measured by DCF staining (Figure 1B). Importantly, suppression of mitochondrial ROS production by the addition of MitoTEMPO accelerated neutrophil apoptosis (Figure 1C-D) indicating mitochondrial ROS are required for neutrophil survival. Enhanced mROS at 1% O2 but not 10% O2 follows the pattern of HIF-1α stabilization at these oxygen tensions (Figure 1E). To directly address whether mROS and electron transport activity regulate stabilization of the oxygen-sensitive transcript factor HIF-1α,1,2 neutrophils were cultured with MitoTEMPO and inhibitors of mitochondrial complex I (rotenone), complex II (oxaloacetate), and complex III (antimycin A) activity. Scavenging of mROS by MitoTEMPO and inhibition of mitochondrial complex III activity reduced hypoxic expression of HIF-1α (Figure 1F). Interestingly, DPI also reduced HIF-1α stabilization, suggesting an additional role for alternative sources of ROS, although an important caveat is that DPI also affects complex I activity13 and cross-talk between NADPH oxidase and mROS has previously been reported.14 We limited this survey to the study of HIF-1α because previous work from our group describes the effects of HIF-2α deficiency to be independent of oxygen tension.15
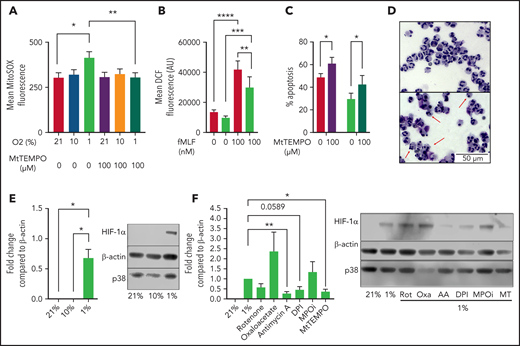
Hypoxia induces the production of mROS in neutrophils, which augments HIF-1α stabilization. (A-B) Neutrophils cultured in normoxia (21% O2, red bars), 10% O2 (light green bars), or hypoxia (1% O2, blue bars) were stained with redox-sensitive dyes and fluorescence intensity analyzed using flow cytometry. (A) Neutrophil mROS levels were determined using MitoSOX Red after 1 hour in culture, n = 7. (B) Overall cellular ROS levels were quantified with DCF staining following treatment with fMLF, n = 8. (C,D) Untreated neutrophils (filled bars) and neutrophils treated with MitoTEMPO (open bars) were aged for 20 hours in normoxia or hypoxia and apoptosis determined through morphology, n = 7. Representative images at ×40 original magnification show hypoxia (top), hypoxia with MitoTEMPO (bottom). Red arrows indicate apoptotic cells. (E) Neutrophils were cultured for 4 hours in normoxia, 10% O2, or hypoxia, sonication lysed, and proteins separated by sodium dodecyl sulphate-polyacrylamide gel electrophoresis (SDS-PAGE). Membranes probed for HIF-1α relative to β-actin loading control, n = 4. (F) Neutrophils were cultured with or without rotenone (Rot, 2 μM), oxaloacetate (Oxa, 2 μM), antimycin A (AA, 10 ng/mL), DPI (10 μM), myeloperoxidase inhibitor-I (MPOi, 100 μM), or MitoTEMPO (MT, 100 μM) before lysis, SDS-PAGE, and membranes probed for HIF-1α relative to β-actin loading control, n = 6. Data represented as mean ± SEM. P values determined by (A-C) 2-way ANOVA or (E-F) 1-way ANOVA, *P < .05, **P < .01, *P < .001, ****P < .0001.
Hypoxia induces the production of mROS in neutrophils, which augments HIF-1α stabilization. (A-B) Neutrophils cultured in normoxia (21% O2, red bars), 10% O2 (light green bars), or hypoxia (1% O2, blue bars) were stained with redox-sensitive dyes and fluorescence intensity analyzed using flow cytometry. (A) Neutrophil mROS levels were determined using MitoSOX Red after 1 hour in culture, n = 7. (B) Overall cellular ROS levels were quantified with DCF staining following treatment with fMLF, n = 8. (C,D) Untreated neutrophils (filled bars) and neutrophils treated with MitoTEMPO (open bars) were aged for 20 hours in normoxia or hypoxia and apoptosis determined through morphology, n = 7. Representative images at ×40 original magnification show hypoxia (top), hypoxia with MitoTEMPO (bottom). Red arrows indicate apoptotic cells. (E) Neutrophils were cultured for 4 hours in normoxia, 10% O2, or hypoxia, sonication lysed, and proteins separated by sodium dodecyl sulphate-polyacrylamide gel electrophoresis (SDS-PAGE). Membranes probed for HIF-1α relative to β-actin loading control, n = 4. (F) Neutrophils were cultured with or without rotenone (Rot, 2 μM), oxaloacetate (Oxa, 2 μM), antimycin A (AA, 10 ng/mL), DPI (10 μM), myeloperoxidase inhibitor-I (MPOi, 100 μM), or MitoTEMPO (MT, 100 μM) before lysis, SDS-PAGE, and membranes probed for HIF-1α relative to β-actin loading control, n = 6. Data represented as mean ± SEM. P values determined by (A-C) 2-way ANOVA or (E-F) 1-way ANOVA, *P < .05, **P < .01, *P < .001, ****P < .0001.
We then investigated the source of hypoxic mROS release. Using the mitochondrial probe TMRM, we measured mitochondrial membrane potential of neutrophils ex vivo in both normoxia (21% O2) and hypoxia (1% O2). Hypoxia significantly enhanced mitochondrial membrane potential (Figure 2A), indicating enhanced mitochondrial electron chain activity, despite previous studies showing no change in Krebs cycle flux or supply of reducing intermediates to the mitochondrial electron transport chain in hypoxia.16 Because isolated neutrophil mitochondria are able to recover mitochondrial membrane potential following the addition of exogenous glycerol phosphate,10 we investigated the involvement of the glycerol 3-phosphate shuttle in mediating these effects. Neutrophils express GPD2, the mitochondrial component of the glycerol 3-phosphate shuttle, although GPD2 levels are not enhanced in hypoxia (Figure 2B). Inhibition of GPD2 using the inhibitor iGP-1 was enough to significantly reduce mitochondrial membrane potential (Figure 2C). Inhibition of glycolysis with the hexokinase inhibitor 2-DG similarly reduced membrane potential in hypoxia where glycolysis is maximal (Figure 2D). This did not reduce the signal to the same extent as iGP-1, possibly because glycerol-3-phosphate shuttle substrates may also be derived from other pathways such as gluconeogenesis, fatty acid oxidation, and intracellular glycogen stores.17
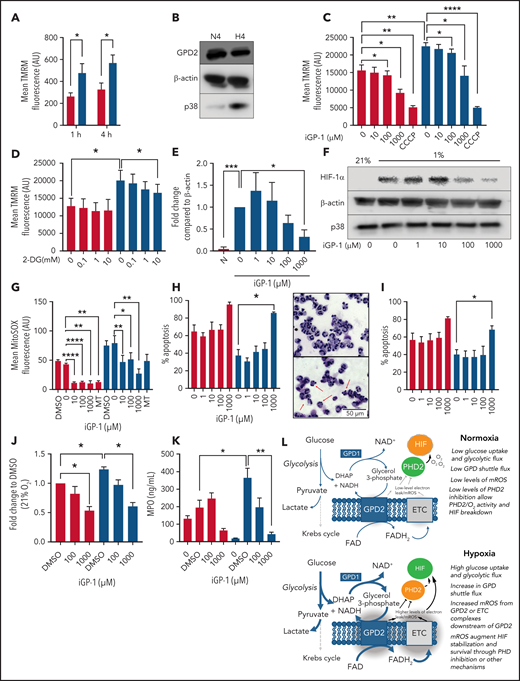
Neutrophil hypoxic mROS release is driven by flux through the glycerol 3-phosphate shuttle. (A-K) Neutrophils were cultured in normoxia (21% O2, red bars) and hypoxia (1% O2, blue bars). (A) Mitochondrial membrane potential was determined by TMRM staining in neutrophils aged for 1 or 4 hours, n = 6. (B) Neutrophils cultured for 4 hours were lysed, proteins separated by SDS-PAGE, and membranes probed for GPD2, n = 3. (C) Neutrophils were treated with the GPD2 inhibitor iGP-1 or the protonophore CCCP membrane potential measured using TMRM dye, n = 6 (normoxia/hypoxia 1000 μm iGP-1 n = 4). (D) Neutrophils were treated with the glycolytic inhibitor 2-DG and membrane potential measured using TMRM dye, n = 3. (E-F) Neutrophils were lysed after 4 hours in culture, proteins separated by SDS-PAGE and membranes probed for HIF-1α expression, n = 4. (G) Neutrophils aged for 1 hour were treated with iGP-1 or the ROS scavenger MitoTEMPO (MT) stained with MitoSOX dye to assess mROS production, n = 6. (H-I) Apoptosis rates were determined in neutrophils aged for 20 hours by morphology (H), n = 3, and Annexin-TO-PRO3 positivity (I), n = 3. Representative images at ×40 original magnification show hypoxia (top) and hypoxia with 1 mM iGP-1 treatment. Red arrows indicate apoptotic cells. (J) Neutrophils were treated for 1 hour with iGP-1 in normoxia or hypoxia before infection with heat-killed CTFR-labeled S. aureus (SH1000 - MOI 1:1) and phagocytic uptake quantified after 5 minutes by flow cytometry, n = 5. (K) Neutrophil release of MPO was quantified following 4 hours of incubation in normoxia or hypoxia with iGP-1 and priming stimulation with granulocyte macrophage colony-stimulating factor (10 ng/mL) and fMLF (100 nM), n = 6; untreated, n = 3. (L) Schematic representation of the role of the glycerol-3-phosphate shuttle in the stabilization of HIF-1α. Data represent mean ± SEM. P values determined by (A,J,K) 2-way ANOVA, (C-E,H-I) paired t tests, or (F-G) 1-way ANOVA with Tukey’s multiple comparisons, **P < .01. ETC, electron transport chain.
Neutrophil hypoxic mROS release is driven by flux through the glycerol 3-phosphate shuttle. (A-K) Neutrophils were cultured in normoxia (21% O2, red bars) and hypoxia (1% O2, blue bars). (A) Mitochondrial membrane potential was determined by TMRM staining in neutrophils aged for 1 or 4 hours, n = 6. (B) Neutrophils cultured for 4 hours were lysed, proteins separated by SDS-PAGE, and membranes probed for GPD2, n = 3. (C) Neutrophils were treated with the GPD2 inhibitor iGP-1 or the protonophore CCCP membrane potential measured using TMRM dye, n = 6 (normoxia/hypoxia 1000 μm iGP-1 n = 4). (D) Neutrophils were treated with the glycolytic inhibitor 2-DG and membrane potential measured using TMRM dye, n = 3. (E-F) Neutrophils were lysed after 4 hours in culture, proteins separated by SDS-PAGE and membranes probed for HIF-1α expression, n = 4. (G) Neutrophils aged for 1 hour were treated with iGP-1 or the ROS scavenger MitoTEMPO (MT) stained with MitoSOX dye to assess mROS production, n = 6. (H-I) Apoptosis rates were determined in neutrophils aged for 20 hours by morphology (H), n = 3, and Annexin-TO-PRO3 positivity (I), n = 3. Representative images at ×40 original magnification show hypoxia (top) and hypoxia with 1 mM iGP-1 treatment. Red arrows indicate apoptotic cells. (J) Neutrophils were treated for 1 hour with iGP-1 in normoxia or hypoxia before infection with heat-killed CTFR-labeled S. aureus (SH1000 - MOI 1:1) and phagocytic uptake quantified after 5 minutes by flow cytometry, n = 5. (K) Neutrophil release of MPO was quantified following 4 hours of incubation in normoxia or hypoxia with iGP-1 and priming stimulation with granulocyte macrophage colony-stimulating factor (10 ng/mL) and fMLF (100 nM), n = 6; untreated, n = 3. (L) Schematic representation of the role of the glycerol-3-phosphate shuttle in the stabilization of HIF-1α. Data represent mean ± SEM. P values determined by (A,J,K) 2-way ANOVA, (C-E,H-I) paired t tests, or (F-G) 1-way ANOVA with Tukey’s multiple comparisons, **P < .01. ETC, electron transport chain.
GPD2 is a “leaky” protein and produces a high degree of mROS.18 To test whether GPD2 is the source of hypoxia-induced mROS in neutrophils, we inhibited GPD2 with iGP-1 and measured both HIF-1α expression and mROS levels. iGP-1 inhibited HIF-1α expression in hypoxia (Figure 2E,F) and reduced mROS levels (Figure 2G). These data suggest neutrophils use GPD2 to produce mROS and stabilize HIF-1α. Importantly, inhibition of GPD2 activity with iGP-1 is proapoptotic (Figure 2H,I) and abrogates neutrophil phagocytosis of heat killed S aureus (Figure 2J) and degranulation (Figure 2K), indicating GPD2 activity is essential for neutrophil survival and key effector functions. The inhibition of mROS in normoxia at higher concentrations of iGP-1 together with effects on neutrophil phagocytosis and survival at higher oxygen concentrations would suggest that even when oxygen is freely available there is some flow into GPD2, in keeping with the reliance of neutrophils on glycolysis and gluconeogenesis for ATP production.17
Our study suggests neutrophils use the glycerol 3-phosphate pathway as a link between glycolysis and the electron transport chain. Neutrophils possess the mitochondrial membrane protein GPD2, which contributes to the mitochondrial membrane potential. Because GPD2 levels are unchanged between normoxic and hypoxic conditions, we hypothesize that increased mitochondrial membrane potential and mROS release in hypoxia is caused by increased glycolysis and subsequent increased flux through the glycerol 3-phosphate shuttle (Figure 2L). Indeed, mitochondrial membrane potential is enhanced in hypoxic conditions in which glycolytic flux and gluconeogenesis is increased17; blocking glycolytic flux similarly reduces mitochondrial membrane potential. We find blocking GPD2 with the inhibitor iGP-1 is enough to reduce the mitochondrial membrane potential and induce apoptosis. Blocking GPD2 also reduces mROS release. We therefore implicate flux through the glycerol 3-phosphate shuttle as a mitochondrial pathway in neutrophils capable of increasing mitochondrial membrane potential and producing mROS in hypoxia.
An important limitation of this program of work, however, remains the inability to extend pharmacological manipulation of GPD2 to genetic silencing or study of immortalized cell lines because metabolic pathways are highly dynamic and sensitive to both neutrophil maturation states and the physiological environment. That said, in addition to implicating neutrophil mROS in stabilizing HIF-1α, these findings will be of particular interest as the role of neutrophil mROS is implicated in regulating neutrophil function. For example, neutrophil mROS production supports the production of pro-inflammatory NETs, implicated in the pathogenesis of lupus-like diseases.19 Moreover, neutrophils isolated from patients with type 1 and type 2 diabetes show defects in NETosis, suggesting energy metabolism and metabolic flux could indeed play a part in regulating NETosis.20 It will be key to investigate the role of the neutrophil glycerol 3-phosphate shuttle in mediating mROS release and HIF-1α regulation with respect to these functional outcomes and related disease states.
Acknowledgments
This work was principally supported by Wellcome Trust Senior Clinical Fellowship Award 209220 (S.R.W.). A Wellcome Clinical Training Fellowship Award (214383) (T.M.), and a Cancer Research UK (CRUK) Cancer Immunology Project Award (C62207/A24495) to (S.R.W.) J.A.W. was supported by an Engineering and Physical Sciences Research Council and MRC Centre for Doctoral Training in Optical Medical Imaging studentship. S.A. was supported by a Medical Research Foundation National program in Antimicrobial Resistance studentship. S.R.W. and S.A. are also supported by the MRC SHIELD consortium (MRNO2995X/1).
Authorship
Contribution: J.A.W., S.A., L.R., P.C., T.M., and G.R. performed the research studies, analyzed the data, and wrote the manuscript; and J.A.W., S.A., P.S., D.H.D., M.K.B.W., and S.R.W. designed the experiments and interpreted the data.
Conflict-of-interest disclosure: The authors declare no competing financial interests.
For original data, please contact sarah.walmsley@ed.ac.uk.
Correspondence: Sarah R. Walmsley, MRC/University of Edinburgh Centre for Inflammation Research, Queen’s Medical Research Institute, University of Edinburgh, Edinburgh EH16 4TJ, United Kingdom; e-mail: sarah.walmsley@ed.ac.uk.
The online version of this article contains a data supplement.
There is a Blood Commentary on this article in this issue.
The publication costs of this article were defrayed in part by page charge payment. Therefore, and solely to indicate this fact, this article is hereby marked “advertisement” in accordance with 18 USC section 1734.

This feature is available to Subscribers Only
Sign In or Create an Account Close Modal