

Key Points
Blocking B7-H3 altered its immunomodulatory functions and induced NK cell-mediated antileukemic effects in vitro and in vivo.
Targeting B7-H3 using a monoclonal antibody (T-1A5) could be a potential therapeutic approach in high-risk B7-H3+ AML patients.

Abstract
We observed that the immune checkpoint protein B7-H3 is overexpressed in acute myeloid leukemia (AML) patients with poor treatment outcomes. Inhibition of B7-H3 expression or blocking of its activity using a novel monoclonal antibody (T-1A5) in AML cells significantly enhanced natural killer (NK) cell-mediated cytotoxicity in AML cells in vitro and in vivo. Moreover, a human-mouse chimera of this antibody (ChT-1A5) induced antibody-dependent cell-mediated cytotoxicity (ADCC) in B7-H3+ primary AML cells, but not in normal hematopoietic cells, suggesting the specify of this antibody for AML cells. Epitope mapping studies identified that both T-1A5 and ChT-1A5 antibodies bind to the FG-loop region of B7-H3, which is known to regulate the immunosuppressive function of B7-H3. Furthermore, treatment with ChT-1A5 in combination with human NK cells significantly prolonged survival in AML patient-derived xenograft (PDX) models. Our results suggest that the ChT-1A5 antibody can inhibit the immunosuppressive function of B7-H3 protein as well as induce ADCC in B7-H3+ AML.
Introduction
Acute myeloid leukemia (AML) is an aggressive malignancy characterized by a block in myeloid differentiation that leads to the uncontrolled proliferation of myeloblasts.1 AML is the most common leukemia in adults, with an age-adjusted incidence rate of 4.3 cases per 100 000 people annually.2 Despite recent advances in targeted therapeutic approaches, AML remains an aggressive malignancy with a poor prognosis.3 Hence, clinically-relevant novel therapeutic targets are desperately needed, and one promising approach is cancer immunotherapy. Indeed, targeting an immune checkpoint regulator in combination with targeted chemotherapeutics has been shown to be more effective than the chemotherapeutic regimen alone.4,5
The B7 homolog 3 (B7-H3), an immune checkpoint molecule of the B7 family, is a coreceptor of a type-I transmembrane protein.6 In humans, B7-H3 exists in 2 isoforms, 2Ig-B7-H3 and 4Ig-B7-H3, whereas a single isoform, 2Ig-B7-H3, has been reported in mice.6,7 Although the receptor of B7-H3 is still unknown, the FG-loop region on B7-H3 is known to be responsible for maintaining its immunomodulatory function.8 The exact role of the B7-H3 molecule in regulating the immune-cell response is also not entirely clear. Several studies demonstrated that B7-H3 inhibits immune-cell response by reducing T–cell-mediated type I interferon release and by attenuating the cytotoxic activities of natural killer (NK) cells.9,10 However, other reports showed a stimulatory effect of B7-H3 on CD8+ cytolytic T-cell activity in AML.11-14
B7-H3 protein is upregulated in various malignancies, compared with the respective normal tissues, and its overexpression has been shown to be associated with poor clinical outcome.15-24 Therefore, B7-H3 has been therapeutically targeted using monoclonal antibodies (mAbs).25,26 Enoblituzumab, the first fully humanized B7-H3 mAb in combination with activated NK cells, has been shown to be effective in solid tumors by enhancing antibody-dependent cell-mediated cytotoxicity (ADCC).27,28 Moreover, most of the anti-B7–H3 mAbs that have been tested in phase 1 clinical trials to date have delivered promising results and favorable safety profiles in solid tumors.18,28 Additionally, an ongoing clinical trial is evaluating the efficacy of the anti-B7–H3 antibody DS-7300a (Daiichi Sankyo) in advanced refractory solid tumors.29
Nevertheless, targeting B7-H3 through a mAb-based immunotherapeutic strategy and the impact of this strategy on AML immune microenvironment have been unexplored. Therefore, we hypothesized that targeting B7-H3 using mAbs to activate immune cells would be effective in inducing ADCC against AML. We measured B7-H3 expression in AML patients and found it to be associated with a poor prognosis. Further, we investigated the effect of novel B7–H3-blocking mAbs on the immune cell-mediated killing of AML cells in vitro and in vivo using AML cell lines and xenograft and patient-derived xenograft (PDX) models, respectively. Moreover, we identified the specific binding site on the human B7-H3 protein that is responsible for its immunomodulatory effect. Our results suggest that a B7–H3-targeting antibody can alter the immunomodulatory function of B7-H3 to enhance immune cell-mediated ADCC against AML.
Methods
An extended Methods section is available in the supplemental Methods.
Cell culture
HL-60, Kasumi-1, THP-1, MV4-11, U937, MOLM-13, MOLM-14, OCI-AML3, and OCI-AML2 cells were cultured in RPMI1640 media (Sigma) supplemented with 10% fetal bovine serum and 1% penicillin/streptomycin (Sigma). NK cells were generated from peripheral blood mononuclear cells (PBMCs) of healthy donors.
Patient samples
All patient samples were collected between February 2018 and March 2021 according to a protocol approved by the MD Anderson Cancer Center (MDACC) Institutional Review Board (Protocol # PA18-0129). All study participants provided written informed consent per the Declaration of Helsinki.
Knockdown (KD) of B7-H3 expression in AML cells
Lentiviral-mediated short hairpin RNA (shRNA; TRC-Hs 1.0, Clone ID: TRCN0000128062) was used for stable B7-H3 KD in MV4-11, U937, and OCI-AML3 cells.
Evaluation of B7-H3 protein and mRNA expression in primary AML cells and cell lines
We performed flow cytometry and real-time polymerase chain reaction to measure B7-H3 expression.
Measurement of apoptosis in AML cell lines and primary cells
We performed time-lapse fluorescence imaging using an Incucyte live-cell imaging system (Essen BioScience) to assess apoptosis induction.
Generation of anti-B7–H3 murine mAbs
The anti-B7–H3 murine mAbs T-1A5, HEK5-1B3, and 58B1 were generated as described previously.30,31 Briefly, mAbs T-1A5, HEK5-1B3, and 58B1 were produced by immunization of 6- to 8-week-old female Balb/c mice (Charles River WIGA, Sulzfeld, Germany) with human embryonic kidney cell line HEK-293, megakaryocytic UT, and seminoma TCAM-2 cell lines, respectively.
Chimeric antibody generation from murine mAb T-1A5 and analysis of the anti-B7–H3 antibodies
We performed epitope mapping studies to identify the antibody binding sites on the B7-H3 protein. The detailed information of chimeric antibody generation from murine mAb T-1A5 are included in the supplemental Methods.
In vivo mouse studies
We generated a xenograft model to evaluate the effect of anti-B7–H3 antibodies alone and developed AML PDX models in NSG mice to determine the effect of a chimeric antibody with NK cells.
Results
B7-H3 expression in AML and its association with clinical outcomes
We analyzed B7-H3 expression in peripheral blood (PB) and bone marrow mononuclear cells by flow cytometry from AML patients and healthy donors recruited at MDACC. The baseline characteristics of patients are tabulated in Table 1. B7-H3 expression was observed in ∼60% of AML cases, and its expression was two- to threefold higher in AML compared with healthy-donor (P < .0001) (Figure 1A). Furthermore, in AML patients, B7-H3 expression was significantly higher in CD34+ cells than in CD34- cells (P < .001) (Figure 1B; supplemental Figure 1A) and was not associated with markers of stemness (CD34+, CD38-, CD123+) (supplemental Figure 1B), while there was no difference in B7-H3 expression between CD34+ cells and CD34- cells from healthy donors, indicating that B7-H3 is strongly expressed in AML blast cells.
Patient characteristics
| Characteristics | n | B7-H3 (MFI) | P value |
|---|---|---|---|
| Mean ± SD | |||
| Sex | |||
| Female | 40 | 3985 ± 2346 | .21 |
| Male | 60 | 3488 ± 1594 | |
| AML subtype | |||
| M0 | 10 | 3665 ± 3506 | .09 |
| M1 | 45 | 3842 ± 1379 | |
| M2 | 28 | 3549 ± 1867 | |
| Others | 17 | 3512 ± 2235 | |
| Treatment | |||
| No | 34 | 3322 ± 1528 | .17 |
| Yes | 66 | 3874 ± 2100 | |
| ELN score | |||
| Good | 15 | 2927 ± 962 | .02 |
| Intermediate | 18 | 2798 ± 1059 | |
| Poor | 68 | 4095 ± 2148 | |
| Death | |||
| No | 24 | 3351 ± 1640 | .04 |
| Yes | 35 | 4494 ± 2432 | |
| Relapse | |||
| No | 43 | 4087 ± 2323 | .88 |
| Yes | 16 | 3873 ± 1903 |
ELN, European LeukemiaNet; MFI, mean fluorescence intensity.
![B7-H3 is overexpressed in AML patients and is associated with poor clinical outcomes. (A) B7-H3 expression in AML patients and control samples. PBMCs from AML patients and healthy donors were stained with CD34-PE and B7-H3-APC (BioLegend, clone MIH42) antibodies and measured B7-H3 expression by flow cytometry (Wilcoxon rank-sum test). (B) B7-H3 expression on CD34+ and CD34- subpopulations in AML patients and controls (Wilcoxon rank-sum test). (C) B7-H3 expression in AML patients stratified based on European LeukemiaNet prognostic risk groups (ie, good, intermediate, and poor risk; Kruskal-Wallis test). (D) Overall survival (OS) of AML patients divided into low and high B7-H3 expression using receiver operating curve (ROC) as a cutoff (log-rank test). (E) Disease-free survival by B7-H3 expression level in patients with AML (RNA expression of B7-H3 obtained from the Oregon Health & Science University [OHSU] AML data set). The cutoff for B7-H3 expression was the median (log-rank test). (F) OS by B7-H3 expression level in patients with AML. (G) B7-H3 and PD-L1 expression in the indicated AML cell lines; leukemic cells (1 × 10⁶) were stained with anti-B7–H3 and anti-PD–L1, and their expression was measured by flow cytometry. Data are plotted as mean values with error bars representing standard error. (H,I) Correlation of B7-H3 (CD276) and PD-L1 (CD274) mRNA expression obtained from the OHSU (H) and The Cancer Genome Atlas (TCGA) (I) AML data sets. The graph was generated using cBioPortal for Cancer Genomics data analysis software. Spearman and Pearson correlation test was used for statistical analysis. ***P < .0001.](https://ash.silverchair-cdn.com/ash/content_public/journal/blood/139/18/10.1182_blood.2021014671/4/m_bloodbld2021014671f1.png?Expires=1771328611&Signature=Jh~HiVnMASQg2lHa0hyPA6j~OQKWzm-coA-5gQ3xBPbAzseSvY0FdeK9ok2AViVcXWagGjnEdVJyOO7RcXe~ou-NkpljhKFJgYwRaC2k6TjdDRdyB~lfC3xUW5eT~P0-OpuG1~QGLGKP65yHLdYlTQ-xkG0HZbFRtSdtR8D14Sq2gcqTVetAc93X4kVOEgtAOH1RUdt3g2wv3aMfYmhqjT9TkE90eX7zKR6rhx93oVqJZkO-214nEfmYjHc6-TPCLFrHmQ1Dxpv4k3lwPhwqhR-n3D5vBEeedOB8uYOxNQUJ9bSr4X1LHl64r02IiVGG59TdcmE0orth0sNs31Yc0A__&Key-Pair-Id=APKAIE5G5CRDK6RD3PGA)
B7-H3 is overexpressed in AML patients and is associated with poor clinical outcomes. (A) B7-H3 expression in AML patients and control samples. PBMCs from AML patients and healthy donors were stained with CD34-PE and B7-H3-APC (BioLegend, clone MIH42) antibodies and measured B7-H3 expression by flow cytometry (Wilcoxon rank-sum test). (B) B7-H3 expression on CD34+ and CD34- subpopulations in AML patients and controls (Wilcoxon rank-sum test). (C) B7-H3 expression in AML patients stratified based on European LeukemiaNet prognostic risk groups (ie, good, intermediate, and poor risk; Kruskal-Wallis test). (D) Overall survival (OS) of AML patients divided into low and high B7-H3 expression using receiver operating curve (ROC) as a cutoff (log-rank test). (E) Disease-free survival by B7-H3 expression level in patients with AML (RNA expression of B7-H3 obtained from the Oregon Health & Science University [OHSU] AML data set). The cutoff for B7-H3 expression was the median (log-rank test). (F) OS by B7-H3 expression level in patients with AML. (G) B7-H3 and PD-L1 expression in the indicated AML cell lines; leukemic cells (1 × 10⁶) were stained with anti-B7–H3 and anti-PD–L1, and their expression was measured by flow cytometry. Data are plotted as mean values with error bars representing standard error. (H,I) Correlation of B7-H3 (CD276) and PD-L1 (CD274) mRNA expression obtained from the OHSU (H) and The Cancer Genome Atlas (TCGA) (I) AML data sets. The graph was generated using cBioPortal for Cancer Genomics data analysis software. Spearman and Pearson correlation test was used for statistical analysis. ***P < .0001.
B7-H3 is overexpressed in AML patients and is associated with poor clinical outcomes. (A) B7-H3 expression in AML patients and control samples. PBMCs from AML patients and healthy donors were stained with CD34-PE and B7-H3-APC (BioLegend, clone MIH42) antibodies and measured B7-H3 expression by flow cytometry (Wilcoxon rank-sum test). (B) B7-H3 expression on CD34+ and CD34- subpopulations in AML patients and controls (Wilcoxon rank-sum test). (C) B7-H3 expression in AML patients stratified based on European LeukemiaNet prognostic risk groups (ie, good, intermediate, and poor risk; Kruskal-Wallis test). (D) Overall survival (OS) of AML patients divided into low and high B7-H3 expression using receiver operating curve (ROC) as a cutoff (log-rank test). (E) Disease-free survival by B7-H3 expression level in patients with AML (RNA expression of B7-H3 obtained from the Oregon Health & Science University [OHSU] AML data set). The cutoff for B7-H3 expression was the median (log-rank test). (F) OS by B7-H3 expression level in patients with AML. (G) B7-H3 and PD-L1 expression in the indicated AML cell lines; leukemic cells (1 × 10⁶) were stained with anti-B7–H3 and anti-PD–L1, and their expression was measured by flow cytometry. Data are plotted as mean values with error bars representing standard error. (H,I) Correlation of B7-H3 (CD276) and PD-L1 (CD274) mRNA expression obtained from the OHSU (H) and The Cancer Genome Atlas (TCGA) (I) AML data sets. The graph was generated using cBioPortal for Cancer Genomics data analysis software. Spearman and Pearson correlation test was used for statistical analysis. ***P < .0001.
To examine the prognostic significance of B7-H3 expression in AML, we stratified patients into good, intermediate, and poor risk groups based on their European LeukemiaNet prognostic risk scores.32 B7-H3 expression was higher in patients with poor prognostic scores (P = .02) (Figure 1C). Furthermore, AML patients with high B7-H3 expression had significantly poorer overall survival (OS) than those with low B7-H3 expression (P = .04) (Figure 1D). Our findings regarding B7-H3 overexpression in AML patients were supported by mRNA expression analysis performed on the Oregon Health & Science University (OHSU) AML data set.33 Moreover, patients with FLT3-internal tandem duplication mutations had higher B7-H3 mRNA expression than patients with wild-type FLT3 (P < .001) (supplemental Figure 1C). Additionally, B7-H3 mRNA overexpression correlated with significantly worse disease-free (P = .03) and overall survival (P = .013) (Figure 1E-F). These results indicate that B7-H3 is upregulated in a subset of AML patients and that its expression is strongly associated with poorer OS. In addition to B7-H3, we also analyzed protein expression of another B7 family member (PD-L1) in AML samples and cell lines and found no correlation between B7-H3 and PD-L1 (Figure 1G; supplemental Figure 1E-F). Similarly, no significant correlation was observed at the mRNA level using The Cancer Genome Atlas (TCGA) (n = 672) and Oregon Health Science University (OHSU) (n = 200) AML data sets (Figure 1H-I). These results suggest that the expression of PD-L1 and B7-H3 are mutually exclusive, and there is no association between them.
Inhibition of B7–H3-induced NK cell-mediated killing of AML cells
To investigate the role of B7-H3 in altering the AML immune microenvironment, we generated a stable lentiviral KD of B7-H3 in MV4-11, U937, and OCI-AML3 cells. We found up to 70% inhibition of B7-H3 expression in KD cells compared with scrambled shRNA-treated control cells (supplemental Figure 2A-B). It was observed that B7-H3 KD had no effect on cell growth (supplemental Figure 2C). Further, we analyzed the activity of NK cells and observed the expression of the activation markers CD16 and NKG2D in >80% of CD56+ cells (supplemental Figure 2D). Next, we cultured all 3 B7-H3 KD AML cell lines with or without NK cells at a 2:1 NK:target cell ratio and measured the induction of apoptosis through annexin V binding for 18 hours in AML cell lines. We found a time-dependent increase in NK cell-mediated apoptosis in all 3 B7-H3 KD AML cell lines compared with shRNA-treated cells (Figure 2A-C). In the rescue experiment, the addition of recombinant human (rh) B7-H3 protein resulted in a significant decrease in NK cell-induced apoptosis in B7-H3 KD in all 3 cell lines (Figure 2A-C). Quantitative analysis revealed a threefold decrease in NK cell-mediated killing of B7-H3 KD AML cell lines treated with rhB7-H3 protein (P < .01) (Figure 2D-F). These findings indicate that B7-H3 is a strong regulator of NK cell activity, and depletion of B7-H3 leads to increased NK cell-mediated apoptosis in AML cells.

KD of B7-H3 expression induced NK cell-mediated apoptosis. (A-C) Time kinetics graph of B7-H3 KD cells and scrambled shRNA MV4-11 (A), U937 (B), and OCI-AML3 (C) AML cells cultured with rhB7-H3 protein in the presence or absence of NK cells at a 4:1 NK:target cell ratio. Leukemic cells were labeled with CytoLight red and annexin V green reagents. Apoptosis of leukemic cells was assessed via annexin V green staining every hour for up to 18 hours. (D-F) Bar graphs showing the percentage of annexin V positive cells (green staining) in B7-H3 KD MV4-11 at 18 hours (D), U937 at 18 hours (E), and OCI-AML3 at 14 hours (F) AML cells and scrambled shRNA control cells treated with rB7-H3 protein and NK cells at a 2:1 ratio. Data are plotted as mean values with error bars representing standard error (Student unpaired t test). (G-I) B7-H3 expression in AML patient samples and controls using our 3 anti-B7–H3 mAbs. PBMCs from AML patients and controls were stained with primary anti-B7–H3 mAbs T-1A5, HEK5-1B3, and 58B1 and secondary conjugated goat anti-mouse IgG (Alexa Fluor 647). DAPI was used to exclude dead cells, and B7-H3 expression was measured by flow cytometry (Wilcoxon rank-sum test). (J) Overlay plots showing cell-surface staining of B7-H3 in AML cell lines OCI-AML3, U937, MV4-11, and THP-1 using our anti-B7–H3 mAbs T-1A5, HEK5-1B3, and 58B1 measured by flow cytometry. MFI: mean fluorescence intensity. ***P < .0001.
KD of B7-H3 expression induced NK cell-mediated apoptosis. (A-C) Time kinetics graph of B7-H3 KD cells and scrambled shRNA MV4-11 (A), U937 (B), and OCI-AML3 (C) AML cells cultured with rhB7-H3 protein in the presence or absence of NK cells at a 4:1 NK:target cell ratio. Leukemic cells were labeled with CytoLight red and annexin V green reagents. Apoptosis of leukemic cells was assessed via annexin V green staining every hour for up to 18 hours. (D-F) Bar graphs showing the percentage of annexin V positive cells (green staining) in B7-H3 KD MV4-11 at 18 hours (D), U937 at 18 hours (E), and OCI-AML3 at 14 hours (F) AML cells and scrambled shRNA control cells treated with rB7-H3 protein and NK cells at a 2:1 ratio. Data are plotted as mean values with error bars representing standard error (Student unpaired t test). (G-I) B7-H3 expression in AML patient samples and controls using our 3 anti-B7–H3 mAbs. PBMCs from AML patients and controls were stained with primary anti-B7–H3 mAbs T-1A5, HEK5-1B3, and 58B1 and secondary conjugated goat anti-mouse IgG (Alexa Fluor 647). DAPI was used to exclude dead cells, and B7-H3 expression was measured by flow cytometry (Wilcoxon rank-sum test). (J) Overlay plots showing cell-surface staining of B7-H3 in AML cell lines OCI-AML3, U937, MV4-11, and THP-1 using our anti-B7–H3 mAbs T-1A5, HEK5-1B3, and 58B1 measured by flow cytometry. MFI: mean fluorescence intensity. ***P < .0001.
Anti-B7–H3 antibodies enhanced NK cell-mediated apoptosis in AML cell lines and primary cells
To block the immunomodulatory function of B7-H3, we tested 3 novel anti-B7–H3 murine mAbs, T-1A5, HEK5-1B3, and 58B1,34 and measured their binding affinities using flow cytometry in AML patient samples and cell lines. As expected, B7-H3 expression was significantly higher in AML patient samples than the control samples for all 3 antibodies tested (P ≤ .02) (Figure 2G-I). We also noted that our anti-B7–H3 antibodies are more strongly bound to the OCI-AML3, U937, MV4-11, and THP-1 cell lines (Figure 2J) than OCI-AML2, MOLM-13, MOLM-14, HL-60, and Kasumi-1 (supplemental Figure 2E-F). Further, we observed a strong overlap between B7-H3 mRNA and protein expression (supplemental Figure 2G), suggesting that these antibodies are highly specific to B7-H3. Additionally, we found that the growth of B7-H3 KD cells or control cells was not affected when treated with anti-B7–H3 antibodies (supplemental Figure 3A).
To determine the effect of anti-B7–H3 antibodies in blocking the immunomodulatory functions of B7-H3, we cultured AML cell lines OCI-AML3, U937, and THP-1 with or without NK cells at a 2:1 NK:target cell ratio in the presence or absence of anti-B7–H3 antibodies (T-1A5, HEK5-1B3, and 58B1-1 μg/mL). We measured apoptosis as described previously. Representative images of AML cells undergoing apoptosis at various time points after treatment with anti-B7–H3 antibodies and NK cells are shown in Figure 3A. In contrast to IgG1 control antibody treatment, anti-B7–H3 antibodies and activated NK cells significantly increased annexin V binding in AML cell lines within a few hours (P < .001). However, IgG1 control or anti-B7–H3 antibodies treatment alone did not induce cell death in these cells (Figure 3B-D; supplemental Figure 3B-E). A similar finding was observed in PBMCs derived from AML patients (P < .01) (Figure 3E-F; supplemental Figure 3F). Moreover, we found no significant role of T cells in the immunomodulatory function of B7-H3 (supplemental Figure 3G). Overall, these results indicate that anti-B7–H3 antibodies block the immunomodulatory functions of B7-H3 and enhance NK cell-mediated apoptosis in AML cells.
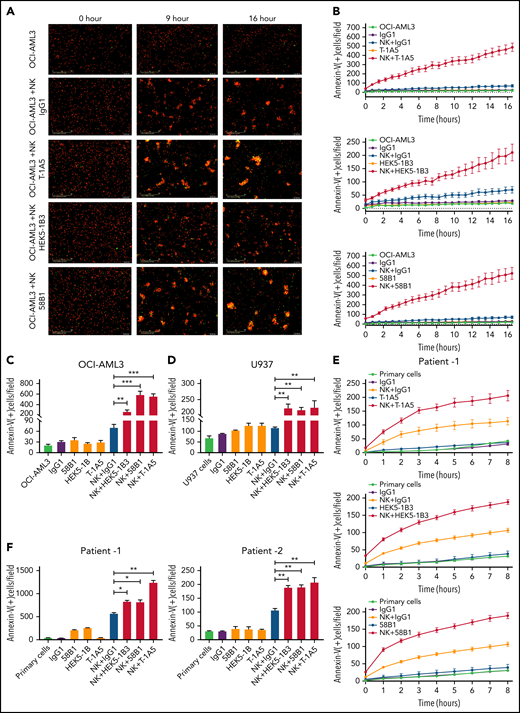
Anti-B7–H3 mAbs T-1A5, HEK5-1B3, and 58B1 enhance NK cell-mediated apoptosis in AML. (A) Representative images obtained at 0, 9, and 16 hours show apoptosis in OCI-AML3 cells treated with anti-B7–H3 antibodies and/or NK cells. OCI-AML3 cells were labeled with CytoLight red and annexin V-green. The overlap (yellow) represents apoptotic AML cells. The images were acquired by an Incucyte live-cell imager. (B) Time kinetics showing apoptosis in OCI-AML3 cells treated with anti-B7–H3 mAbs T-1A5, HEK5-1B3, and 58B1 or control IgG1 and NK cells measured each hour for 16 hours. (C-D) Bar graph shows the percentage of annexin V binding (green staining) at 16 hours in OCI-AML3 (C) and U937 (D) cells treated with anti-B7–H3 mAbs (1 μg/mL) and NK cells at a 2:1 NK:target ratio. Data are plotted as mean values with error bars representing standard error (Student unpaired t test). (E) Similar experiments were performed in primary AML cells (patient1) expressing B7-H3. (F) The bar graph shows the percentage of annexin V binding (green staining) at 8 and 24 hours in AML patients 1 and 2, respectively. *P < .05, **P < .0001, ***P < .0001.
Anti-B7–H3 mAbs T-1A5, HEK5-1B3, and 58B1 enhance NK cell-mediated apoptosis in AML. (A) Representative images obtained at 0, 9, and 16 hours show apoptosis in OCI-AML3 cells treated with anti-B7–H3 antibodies and/or NK cells. OCI-AML3 cells were labeled with CytoLight red and annexin V-green. The overlap (yellow) represents apoptotic AML cells. The images were acquired by an Incucyte live-cell imager. (B) Time kinetics showing apoptosis in OCI-AML3 cells treated with anti-B7–H3 mAbs T-1A5, HEK5-1B3, and 58B1 or control IgG1 and NK cells measured each hour for 16 hours. (C-D) Bar graph shows the percentage of annexin V binding (green staining) at 16 hours in OCI-AML3 (C) and U937 (D) cells treated with anti-B7–H3 mAbs (1 μg/mL) and NK cells at a 2:1 NK:target ratio. Data are plotted as mean values with error bars representing standard error (Student unpaired t test). (E) Similar experiments were performed in primary AML cells (patient1) expressing B7-H3. (F) The bar graph shows the percentage of annexin V binding (green staining) at 8 and 24 hours in AML patients 1 and 2, respectively. *P < .05, **P < .0001, ***P < .0001.
Anti-B7–H3 antibodies inhibit leukemia growth and extend survival in PDX and xenograft AML models
To study the effect of B7-H3 expression on leukemia growth, 4 different AML PDX models were developed. The clinical parameters are listed in supplemental Table 1. We observed variable expression of B7-H3 across the PDX models, and the models with high B7-H3 expression were found to be more aggressive (Figure 4A). To determine which clone of the anti-B7–H3 antibodies was most effective against primary human AML blasts, we treated the AML-PDX model with all 3 anti-B7–H3 mAbs. Nine weeks after injection, when AML blasts in PB were >1%, mice were intraperitoneally (IP) injected with an IgG1 isotype antibody or anti-B7–H3 antibodies at 1 mg/kg twice a week for 15 weeks (Figure 4B). AML growth was determined weekly by measuring human CD45+ cells. Mice treated with anti-B7–H3 antibodies showed slower AML growth and improved OS compared with mice treated with IgG1 antibody (P < .0006) (Figure 4C-D). Moreover, T-1A5 antibody provided an improved survival advantage over the other 2 antibodies.
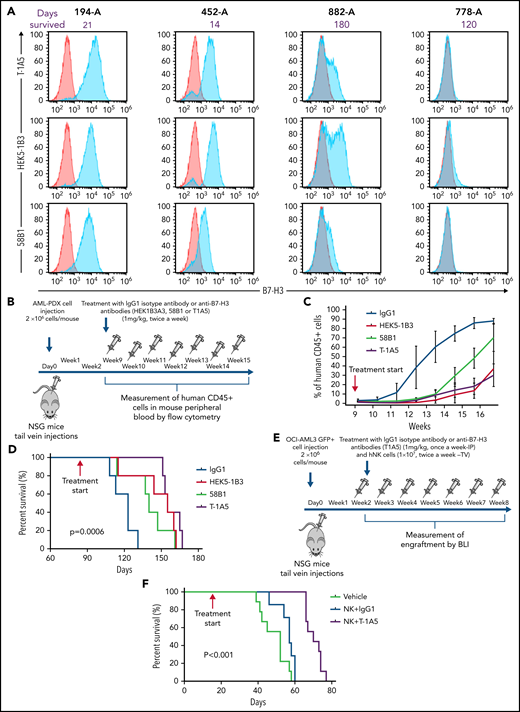
Targeting B7-H3 inhibits AML growth in vivo via NK cells. (A) Overlay plot showing B7-H3 expression in 4 AML PDX models. Cells were stained with primary anti-B7–H3 mAbs (blue) and secondary conjugated antibody as control (red), and B7-H3 expression was measured by flow cytometry. (B) Experimental schema. Two million AML-PDX cells were injected in NSG mice via the tail vein (TV), and upon >1% engraftment of hCD45+ cells in PB (wk 8), mice were treated with mouse IgG1 or anti-B7-H3 mAbs T-1A5, HEK5-1B3, or 58B1 at 1 mg/kg twice weekly via IP injection. (C) Percentage of human CD45+ cells in mouse PB. Mice blood samples were analyzed weekly by flow cytometry. When human CD45+ cells reached >95% or when mice became moribund (whichever happened first), mice were killed. (D) Kaplan-Meier survival plot representing the OS rates in the mice treated with different anti-B7–H3 mAbs (log-rank test). (E) Experimental design for xenograft model. Two million firefly luciferase GFP+ OCI-AML3 cells were injected in NSG mice via TV, and leukemia engraftment was measured weekly by bioluminescence imaging (BLI). The mice were treated with anti-B7–H3 mAb T-1A5 or mouse IgG1 at 1 mg/kg once a week via IP injections and NK cells (10 × 106) twice weekly via TV. (F) Kaplan-Meier survival plot demonstrating the OS rates in mice treated with mAb T-1A5 or mouse IgG1 and NK cells.
Targeting B7-H3 inhibits AML growth in vivo via NK cells. (A) Overlay plot showing B7-H3 expression in 4 AML PDX models. Cells were stained with primary anti-B7–H3 mAbs (blue) and secondary conjugated antibody as control (red), and B7-H3 expression was measured by flow cytometry. (B) Experimental schema. Two million AML-PDX cells were injected in NSG mice via the tail vein (TV), and upon >1% engraftment of hCD45+ cells in PB (wk 8), mice were treated with mouse IgG1 or anti-B7-H3 mAbs T-1A5, HEK5-1B3, or 58B1 at 1 mg/kg twice weekly via IP injection. (C) Percentage of human CD45+ cells in mouse PB. Mice blood samples were analyzed weekly by flow cytometry. When human CD45+ cells reached >95% or when mice became moribund (whichever happened first), mice were killed. (D) Kaplan-Meier survival plot representing the OS rates in the mice treated with different anti-B7–H3 mAbs (log-rank test). (E) Experimental design for xenograft model. Two million firefly luciferase GFP+ OCI-AML3 cells were injected in NSG mice via TV, and leukemia engraftment was measured weekly by bioluminescence imaging (BLI). The mice were treated with anti-B7–H3 mAb T-1A5 or mouse IgG1 at 1 mg/kg once a week via IP injections and NK cells (10 × 106) twice weekly via TV. (F) Kaplan-Meier survival plot demonstrating the OS rates in mice treated with mAb T-1A5 or mouse IgG1 and NK cells.
Next, to study the cumulative effect of anti-B7–H3 mAbs and NK cells in xenograft models, we implanted OCI-AML3 cells expressing firefly luciferase (2 × 10⁶ cells per mouse) in NSG mice via tail vein injections. Seven days later, leukemia growth was measured using bioluminescence imaging. When the leukemia growth reached 1.5 × 10⁹ photons per second, mice were treated with human NK cells via tail vein (1 × 10⁷ cells per mouse) twice a week with a single weekly treatment (IP) with IgG1 or an anti-B7–H3 mAb (T-1A5) at 1 mg/kg (Figure 4E). Kaplan-Meier survival analysis revealed that mice treated with T-1A5 and NK cells had a significant survival advantage compared with mice treated with vehicle or with NK cells plus IgG1 (P < .001) (Figure 4F). These results indicate that B7-H3 blockade with T-1A5 mAb enhances NK cell-mediated cytotoxicity in AML cells and extends the survival of leukemia-bearing mice.
Characterization of the chimeric anti-B7–H3 antibody (ChT-1A5)
To develop an antibody for the treatment of B7-H3+ AML, we generated a human-mouse chimeric antibody (supplemental Figure 4A) based on the variable heavy (VH) and variable light (VL) antibody sequences derived from the clone T-1A5 (ChT-1A5) and measured its purity using ultra-high–performance liquid chromatography. The results suggested that the ChT-1A5 antibody had a purity of >90% (supplemental Figure 4B). Further, we measured its binding efficiency using an enzyme-linked immunosorbent assay and found strong binding to the B7-H3 protein (supplemental Figure 4C). Additionally, we validated the sensitivity of ChT-1A5 and mouse T-1A5 mAb using flow cytometry in B7-H3 KD OCI-AML3 cells. The mean fluorescence intensity (MFI) of ChT-1A5 was 20 000, which was fivefold higher than that of the anti-B7–H3-T–1A5 antibody (MFI = 4000) (supplemental Figure 4D-E). To assess the binding affinity of the antibodies, pharmacodynamic studies were performed using the Octet RED384 system. We found strong binding of both ChT-1A5 and T-1A5 antibodies to rh B7-H3 protein, with dissociation constants (Kd) of 6.23 × 10⁻¹⁰ M and 9.66 × 10⁻¹⁰ M for ChT-1A5 and mouse T-1A5 antibodies, respectively (Figure 5A).
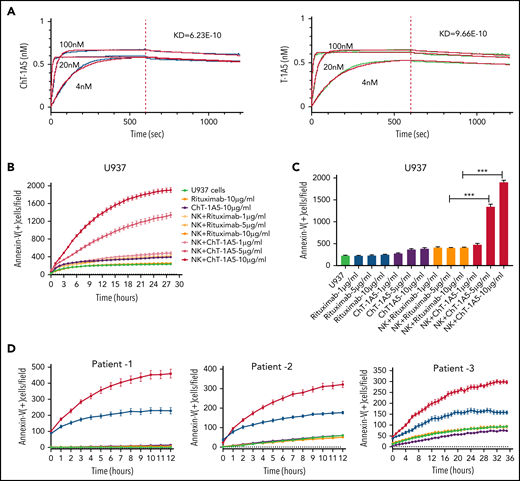
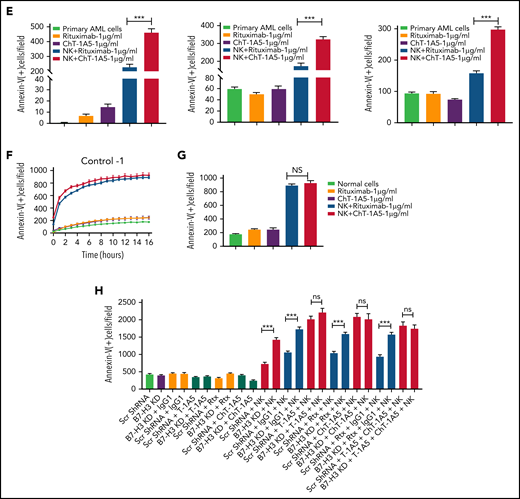
Characterization of ChT-1A5 and its induction of antibody-dependent cellular cytotoxicity in AML cell lines and primary cells. (A) Binding kinetics of anti-B7–H3 mAbs T-1A5 and ChT-1A5 to full B7-H3 protein measured by surface plasmon resonance (Octet). (B) Timelapse fluorescence data show apoptosis induced by NK-cell ADCC. U937 cells were treated with ChT-1A5 or rituximab at 1, 5, and 10 μg/mL in the presence of NK cells at an 8:1 NK:target ratio. Apoptosis was measured every hour for 30 hours. Leukemic cells were labeled with CytoLight red and apoptotic cells with annexin V (green). (C) Bar graph showing the percentage of annexin V binding at 28 hours in U937 cells treated with ChT-1A5 or rituximab at 1, 5, and 10 μg/mL in the presence of NK cells in an 8:1 NK:target ratio. Data are plotted as mean values with error bars representing standard error (Student unpaired t test). (D) Cell death kinetics represents induction of apoptosis in primary AML cells (3 patients) treated with ChT-1A5 or rituximab at 1 μg/mL in the presence of NK cells measured every hour for 12 hours for 2 patients and 36 hours in the third patient, at a 4:1 NK:target ratio. (E) Bar graphs (mean values with standard error bars) represent the percentage of cell death in primary AML cells treated with ChT-1A5 or rituximab at 1 μg/mL in the presence or absence of NK cells at a 4:1 NK:target ratio at 12, 12, and 36 hours, from left to right. (Student unpaired t test). (F) Cell death kinetics and bar diagram (G) represent induction of apoptosis in PBMCs derived from healthy donors (Control-1). PBMCs were treated with ChT1-A5 mAb or rituximab at 1 μg/mL in the presence or absence of NK cells (8:1 effector:target ratio); PBMCs were labeled with CytoLight red, and annexin V. (H) Bar graph (mean values with standard error bars) represent the percentage of cell death in primary AML cells treated with ChT-1A5/T-1A5 or combination of ChT1-A5 and T-1A5 at 1 μg/mL in the presence or absence of NK cells at a 2:1 NK:target ratio at 76 hours (Student unpaired t test). NS not significant; Rx, rituximab; Scr, scrambled. ***P < .0001.
Characterization of ChT-1A5 and its induction of antibody-dependent cellular cytotoxicity in AML cell lines and primary cells. (A) Binding kinetics of anti-B7–H3 mAbs T-1A5 and ChT-1A5 to full B7-H3 protein measured by surface plasmon resonance (Octet). (B) Timelapse fluorescence data show apoptosis induced by NK-cell ADCC. U937 cells were treated with ChT-1A5 or rituximab at 1, 5, and 10 μg/mL in the presence of NK cells at an 8:1 NK:target ratio. Apoptosis was measured every hour for 30 hours. Leukemic cells were labeled with CytoLight red and apoptotic cells with annexin V (green). (C) Bar graph showing the percentage of annexin V binding at 28 hours in U937 cells treated with ChT-1A5 or rituximab at 1, 5, and 10 μg/mL in the presence of NK cells in an 8:1 NK:target ratio. Data are plotted as mean values with error bars representing standard error (Student unpaired t test). (D) Cell death kinetics represents induction of apoptosis in primary AML cells (3 patients) treated with ChT-1A5 or rituximab at 1 μg/mL in the presence of NK cells measured every hour for 12 hours for 2 patients and 36 hours in the third patient, at a 4:1 NK:target ratio. (E) Bar graphs (mean values with standard error bars) represent the percentage of cell death in primary AML cells treated with ChT-1A5 or rituximab at 1 μg/mL in the presence or absence of NK cells at a 4:1 NK:target ratio at 12, 12, and 36 hours, from left to right. (Student unpaired t test). (F) Cell death kinetics and bar diagram (G) represent induction of apoptosis in PBMCs derived from healthy donors (Control-1). PBMCs were treated with ChT1-A5 mAb or rituximab at 1 μg/mL in the presence or absence of NK cells (8:1 effector:target ratio); PBMCs were labeled with CytoLight red, and annexin V. (H) Bar graph (mean values with standard error bars) represent the percentage of cell death in primary AML cells treated with ChT-1A5/T-1A5 or combination of ChT1-A5 and T-1A5 at 1 μg/mL in the presence or absence of NK cells at a 2:1 NK:target ratio at 76 hours (Student unpaired t test). NS not significant; Rx, rituximab; Scr, scrambled. ***P < .0001.
Examining ChT–1A5-induced NK cell-mediated ADCC in AML cell lines and primary cells
Since ChT-1A5 has a human Fc (fragment crystallizable) region, we hypothesized that ChT-1A5 induces ADCC in B7-H3+ AML cells. We treated AML cell lines (OCI-AML3, MV4-11, and U937) with ChT-1A5 or rituximab in the presence or absence of NK cells at an 8:1 NK:target cell ratio. Rituximab is a chimeric anti-CD20 antibody that we used as a nonspecific control antibody. NK cell-induced apoptosis was measured by an annexin V binding assay. We found a dose-dependent increase in apoptosis in leukemic cells treated with the ChT-1A5 antibody and NK cells, while cells treated with rituximab plus NK cells showed no significant increase in apoptosis (Figure 5B-C; supplemental Figures 4F and 5A). At the 28-hour (U937 and MV4-11) (Figure 5C; supplemental Figure 5B) and 22-hour (OCI-AML3; supplemental Figure 4G) time points, treatment with ChT-1A5 alone and rituximab alone or with NK cells had no effect on leukemic cell death, whereas ChT-1A5 with activated NK cells induced significant apoptosis in all 3 AML cell lines (P < .001). Representative images of OCI-AML3 cells undergoing apoptosis at different time points under different treatment conditions are shown in supplemental Figure 5C. Similarly, the effect of ChT-1A5 on primary AML cells was observed that the combination of ChT-1A5 with NK cells induced significantly higher rates of apoptosis in AML cells than did the combination of rituximab with NK cells (P < .001) (Figure 5D-E; supplemental Figure 4H). In contrast, we did not find any such difference in control PBMCs treated with ChT-1A5 or rituximab plus NK cells (Figure 5F-G; supplemental Figure 5D-E). Further, we compared the cytotoxic effects of pembrolizumab with ChT-1A5 and found that B7-H3+ AML cells treated with pembrolizumab did not induce NK cell-mediated cytotoxicity in AML cells compared with cells treated with ChT-1A5 (supplemental Figure 5F-G). These findings suggest that the ChT-1A5 antibody induces ADCC in both B7-H3+ primary AML cells and cell lines but not in cells derived from healthy donors.
To determine whether blocking or cytotoxic mAbs are equally important in NK cell-mediated killing, we cultured scrambled control and B7-H3 KD U937 cells with either T-1A5 alone or ChT-1A5 (1 μg/mL) in the presence or absence of NK cells at a 2:1 NK:target cell ratio. As expected, NK cell-mediated killing was significantly higher in B7-H3 KD cells than in control cells. However, we did not observe a difference in cell killing when treated with T-1A5 or ChT-1A5 antibodies combined with NK cells (Figure 5H), suggesting that blocking B7-H3 activity is as effective as using the cytotoxic antibody.
T-1A5 and ChT-1A5 bind to the FG-loop region of B7-H3
A recent study found that the FG-loop region on the mouse B7-H3 protein is responsible for the immunomodulatory function of B7-H3.8 Since T-1A5 is able to block B7-H3, we hypothesized that T-1A5 binds to the FG-loop region of the human B7-H3 protein. To identify the antibody binding sites for the T-1A5 antibody on the B7-H3 protein, we marked the already reported structural elements of human B7-H3 (Figure 6A-B). The extracellular domain of human B7-H3 comprises 2 isoforms, 2Ig and 4Ig. For ease of study, we used a homology modeling approach and generated a 3-dimensional model of 2Ig using the crystal structure of murine B7-H3, which shares 88.61% of its sequence with human B7-H3, as a template. Next, the predicted models of the VH and VL domains of the T-1A5 antibody were docked (Figure 6C). The 2 best poses of VH and VL docked on either IgV or IgC domains of B7-H3 were further analyzed. Interestingly, pose 1 of VH or VL was docked at the intersection of IgV and the FG-loop, while pose 2 represented binding toward the FG-loop’s intersection with IgC. These predicted interactions indicated the potential binding of the T-1A5 antibody to specific domains of B7-H3.
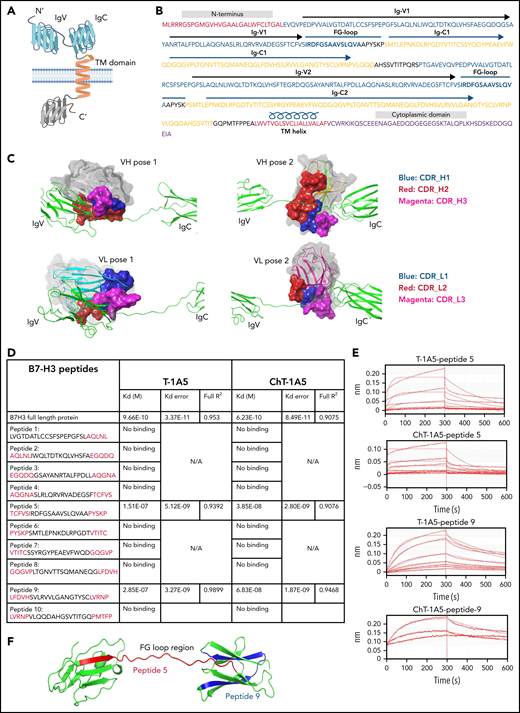
mAbs T-1A5 and ChT-1A5 bind to the FG-loop region of B7-H3 (homology modeling and peptide docking). (A) Schematic representation of B7-H3 structural domains generated using BioRender software. (B) Representation of different structural elements in the B7-H3 amino acid sequence shown in different colors. (C) 3D modeling and docked complexes of 2 predicted poses of the variable heavy (VH, upper panels) and variable light (VL, lower panels) chains of T-1A5 (surface representation) with the FG-loop in B7-H3 (green). Three complementary determining regions (CDRs) in VH and VL are shown in blue, red, and magenta. (D) Epitope mapping of B7-H3 peptides (5-amino-acid overlap, red) with T-1A5 or chimeric ChT-1A5 mAbs. B7-H3 full protein was used as a control. Peptide-5 and peptide-9 showed the strongest Kd values. (E) Raw traces of peptide-5 and peptide-9 of B7-H3 interacting with T-1A5 and ChT-1A5. (F) Model of peptide-5 (red) and peptide-9 (blue) in the extracellular domain of B7-H3.
mAbs T-1A5 and ChT-1A5 bind to the FG-loop region of B7-H3 (homology modeling and peptide docking). (A) Schematic representation of B7-H3 structural domains generated using BioRender software. (B) Representation of different structural elements in the B7-H3 amino acid sequence shown in different colors. (C) 3D modeling and docked complexes of 2 predicted poses of the variable heavy (VH, upper panels) and variable light (VL, lower panels) chains of T-1A5 (surface representation) with the FG-loop in B7-H3 (green). Three complementary determining regions (CDRs) in VH and VL are shown in blue, red, and magenta. (D) Epitope mapping of B7-H3 peptides (5-amino-acid overlap, red) with T-1A5 or chimeric ChT-1A5 mAbs. B7-H3 full protein was used as a control. Peptide-5 and peptide-9 showed the strongest Kd values. (E) Raw traces of peptide-5 and peptide-9 of B7-H3 interacting with T-1A5 and ChT-1A5. (F) Model of peptide-5 (red) and peptide-9 (blue) in the extracellular domain of B7-H3.
To validate these findings, epitope mapping was performed using peptide fragments derived from human B7-H3 protein. We generated 10 peptides from the extracellular domain of B7-H3; each peptide spanned 25 amino acids and overlapped by 5 amino acids with each subsequent peptide. Interestingly, a biolayer interferometry assay using the Octet system showed that peptide-5 and peptide-9 had a strong binding affinity with mouse T-1A5 and ChT-1A5 (Figure 6D-E), while the other peptides did not bind to either antibody (supplemental Figure 6). Peptide-5 showed Kd values of 1.51 × 10⁻⁷ and 3.85 × 10⁻⁸, and peptide-9 showed Kd values of 2.85 × 10⁻⁷ and 6.83 × 10⁻⁸ with T-1A5 and ChT-1A5, respectively. Both peptides showed higher affinity toward ChT-1A5 than T-1A5 compared with full B7-H3 protein, which had Kd values of 9.66 × 10⁻¹⁰ and 6.23 × 10⁻¹⁰ with T-1A5 and ChT-1A5, respectively. Strikingly, our further analysis of the B7-H3 model showed that peptide-5 (red) was present in the IgV domain spanning through the FG-loop and that peptide-9 (blue) was present in the IgC domain (Figure 6F). These findings suggest that the structural conformation of both Ig domains is linked with the FG-loop of B7-H3 and that this is the binding site for the T-1A5 and ChT-1A5 antibodies.
ChT-1A5 with activated NK cells inhibits leukemia growth in a B7–H3-positive AML PDX model
To evaluate the effect of the ChT-1A5 antibody with activated NK cells on leukemic growth, we injected NSG mice with AML PDX cells (1 × 10⁶ cells per mouse). One week after injection, when the percentage of AML blasts in PB was >1%, the mice were randomly distributed into 4 groups: phosphate-buffered saline (PBS), NK cells, NK cells plus ChT-1A5, and NK cells plus rituximab. The mice were IP-treated with ChT-1A5 or rituximab or PBS at 1 mg/kg per day in combination with NK cells (1 × 10⁷ cells per mouse; tail vein) twice a week for 4 weeks (Figure 7A). In all the experimental groups, AML growth was determined weekly by measuring human CD45+ cells. Mice treated with ChT-1A5 plus NK cells showed significantly slower leukemia growth compared with other groups (P < .05) (Figure 7B). The overall weight of the vehicle-treated control mice was significantly (P = .02) lower than that of the treated groups (Figure 7C). Kaplan-Meier survival analysis revealed a survival advantage in ChT-1A5 plus NK cell-treated mice compared with the other groups (P < .0001) (Figure 7D). These findings demonstrated that the ChT-1A5 antibody limits leukemia growth and extends the survival of mice by directing NK cells to target B7-H3+ AML cells through induction of ADCC. Thus anti-B7–H3 antibody could be an immunotherapeutic approach for the treatment of AML.
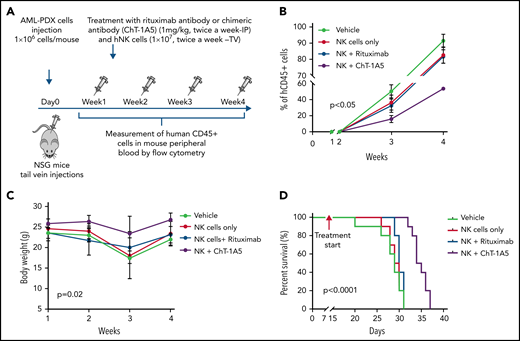
ChT-1A5 in combination with NK cells inhibits tumor growth via antibody-dependent cellular cytotoxicity in AML PDX model. (A) Experimental design. Two million AML PDX cells were injected into NSG mice via the TV. After 1 week, mice were treated with ChT1A5 or rituximab at 1 mg/kg twice weekly via IP injections and with NK cells (10 × 106) via TV twice weekly. (B) AML PDX growth in mouse PB. Mouse blood samples were analyzed weekly for human CD45+ cells by flow cytometry. When human CD45+ cells reached >95% or when mice became moribund (whichever occurred first), mice were killed. (C) Bodyweight of leukemia-bearing mice treated with ChT-1A5 or rituximab and NK cells; weight was measured once a week. (D) Kaplan-Meier survival plot representing OS rates in mice treated with ChT-1A5 or rituximab and NK cells.
ChT-1A5 in combination with NK cells inhibits tumor growth via antibody-dependent cellular cytotoxicity in AML PDX model. (A) Experimental design. Two million AML PDX cells were injected into NSG mice via the TV. After 1 week, mice were treated with ChT1A5 or rituximab at 1 mg/kg twice weekly via IP injections and with NK cells (10 × 106) via TV twice weekly. (B) AML PDX growth in mouse PB. Mouse blood samples were analyzed weekly for human CD45+ cells by flow cytometry. When human CD45+ cells reached >95% or when mice became moribund (whichever occurred first), mice were killed. (C) Bodyweight of leukemia-bearing mice treated with ChT-1A5 or rituximab and NK cells; weight was measured once a week. (D) Kaplan-Meier survival plot representing OS rates in mice treated with ChT-1A5 or rituximab and NK cells.
Discussion
Immunotherapy drugs that target immune checkpoint inhibitors such as CTLA-4 and PD-L1 have shown promising survival outcomes in solid tumors.35,36 However, the role of such immune checkpoint inhibitors has been less explored in hematological malignancies. Therefore, we studied the immunomodulatory role of the checkpoint molecule B7-H3 in AML.
We found that B7-H3 was overexpressed in ∼60% of cases of AML and associated with a poor prognosis. These findings are consistent with those of Hu et al14 and Zhang et al37 but are in contrast to previously reported results from Guery et al38 and Antohe et al.39 A possible explanation for this behavior of B7-H3 is that 1 of the 2 isoforms of B7-H3 acts as a costimulatory signal, while the other isoform has an inhibitory role in immune responses.6,7,11 Therefore, understanding the role of B7-H3 isoforms is crucial in deciphering the role of B7-H3 in immunomodulation and cancer progression.
The B7-H3 molecule has a dual role in which it can act as a costimulatory as well as a coinhibitory molecule.9,12 Although some studies suggest its association with immune activation,11,12 recent studies in multiple cancer types, including AML, suggest that B7-H3 has an immune inhibitory role.9,10 Likewise, our results demonstrated that downregulation of B7-H3 levels enhances NK cell-mediated apoptosis in AML. B7-H3 has been shown to suppress the proliferation of T-cells.40,41 Moreover, some reports suggest that silencing of B7-H3 can induce apoptosis in cancer cells.42,43 However, our results showed that inhibition of B7-H3 had no significant effect on cell proliferation and T–cell-mediated cytotoxicity. The anomalous behavior of B7-H3 can be attributed to the possible bindings of 2 functionally distinct classes of B7-H3 receptors for immune inhibition and immune activation function.7 Thus, identifying the B7-H3 receptors is critical for understanding the role of B7-H3 in immunomodulation.
In solid tumors, it has been reported that blocking of B7-H3 using mAbs increases tumor infiltration by NK cells, reducing cancer progression.9,44,45 We also observed that blockade of B7-H3 using mAbs (T-1A5) alone inhibited leukemia growth in the PDX model (Figure 4D). Considering that NSG mice lack most functional NK and T cells, we suspect that residual monocytes or macrophages could have induced ADCC or antibody-dependent cellular phagocytosis (ADCP) with the help of the T-1A5 antibody. Moreover, in the xenograft mouse model, the combination of B7-H3 blockade with NK cells reduced leukemia growth and prolonged survival. These findings show for the first time that our anti-B7–H3 antibodies block the immunomodulatory function of B7-H3 and inhibit leukemia growth in vivo.
The FG-loop region of B7-H3 is crucial for maintaining the immunomodulatory function of B7-H3.46 Our data suggest that both T-1A5 and ChT-1A5 binds to peptide-5 and peptide-9 of the B7-H3 protein, spanning the FG-loop and IgC domain. These binding data explain the mechanism by which the T-1A5 antibody blocks the immunomodulatory functions of B7-H3. Considering that peptide-5 and peptide-9 are well separated with no overlapping sequences suggests that the epitope of the antibodies is a conformational epitope rather than a sequential one. These unique binding characteristics make this antibody a novel immune checkpoint inhibitor for cancer therapy. However, identification of the B7-H3 receptor might provide more clues to the effects of these antibodies on immune cell activation, which is a subject of further investigation.
NK cells are key components in the ADCC function of the antibody Fc region.47 Several studies have shown that anti-B7–H3 antibodies with NK cells reduced tumor progression through ADCC in cancer.9,46 Similarly, our results revealed that treatment of AML PDXs with ChT-1A5 and activated NK cells synergistically decreased leukemia growth and increased mouse survival. Nagase-Zembutsu et al have shown that anti-B7–H3 mAb induced ADCP in solid tumors.48 Since our mAb has blocking activity, it may induce ADCP through Fc binding to the Fc receptor on the macrophage. The effect of mAb ChT-1A5 on inducing macrophage-mediated ADCP needs further investigation.
In conclusion, this study provides proof of concept for the efficacy of targeting B7-H3 in AML and suggests that NK cells could improve the therapeutic efficacy of anti-B7–H3 mAbs by enhancing ADCC. The significance of our inbuild antibody is that it has blocking and cytotoxic activity. The studies using xenograft and PDX models suggest that B7-H3 is a novel immune checkpoint molecule in AML. Thus, targeting B7-H3 using an anti-B7–H3 mAb could benefit AML patients, especially those with higher B7-H3 expression.
Acknowledgments
The authors thank the Anderson Monoclonal Antibody Facility, supported in part by CCSG grant number P30 CA016672 from the National Institutes of Health/National Cancer Institute. The authors also thank Numsen Hail as well as Amy L. Ninetto, Sarah Bronson, and Bryan Tutt of the Research Medical Library at Anderson for editing the manuscript.
This work was supported by funding from the Leukemia and Lymphoma Society, the Emerson Collective, and bridge funding from MD Anderson Cancer Center.
Authorship
Contribution: A.T. conducted experiments, analyzed the data, and wrote the manuscript; S.L., B.Y., and A.J. performed data analysis and interpreted the data; F.E.-D. performed all statistical tests and analyses; S.G. and H.-J.B. generated the hybridoma cells expressing all the anti-B7–H3 antibodies used in this study; M.K. provided one of the PDX models used in the study; V.L.B. conceptualized the study, planned all the experiments, interpreted the results, edited the manuscript, and performed critical review of the intellectual content of the manuscript; and all authors discussed the results and contributed to the final manuscript.
Conflict-of-interest disclosure: V.L.B. and H.-J.B. are inventors on a patent application that was filed using the findings from this study. The remaining authors declare no competing financial interests.
Correspondence: V. Lokesh Battula, Department of Leukemia, The University of Texas MD Anderson Cancer Center, 1515 Holcombe Blvd, Houston, TX 77030; e-mail: vbattula@mdanderson.org.
The online version of this article contains a data supplement.
The publication costs of this article were defrayed in part by page charge payment. Therefore, and solely to indicate this fact, this article is hereby marked “advertisement” in accordance with 18 USC section 1734.

This feature is available to Subscribers Only
Sign In or Create an Account Close Modal