

Key Points
Pf4-Grin1−/− mice have prolonged bleeding time and impaired PPF.
NMDAR regulates cytoskeletal reorganization in platelets and MKs upon cell contact with matrix.

Abstract
The process of proplatelet formation (PPF) requires coordinated interaction between megakaryocytes (MKs) and the extracellular matrix (ECM), followed by a dynamic reorganization of the actin and microtubule cytoskeleton. Localized fluxes of intracellular calcium ions (Ca2+) facilitate MK-ECM interaction and PPF. Glutamate-gated N-methyl-D-aspartate receptor (NMDAR) is highly permeable to Ca2+. NMDAR antagonists inhibit MK maturation ex vivo; however, there are no in vivo data. Using the Cre-loxP system, we generated a platelet lineage–specific knockout mouse model of reduced NMDAR function in MKs and platelets (Pf4-Grin1−/− mice). Effects of NMDAR deletion were examined using well-established assays of platelet function and production in vivo and ex vivo. We found that Pf4-Grin1−/− mice had defects in megakaryopoiesis, thrombopoiesis, and platelet function, which manifested as reduced platelet counts, lower rates of platelet production in the immune model of thrombocytopenia, and prolonged tail bleeding time. Platelet activation was impaired to a range of agonists associated with reduced Ca2+ responses, including metabotropic like, and defective platelet spreading. MKs showed reduced colony and proplatelet formation. Impaired reorganization of intracellular F-actin and α-tubulin was identified as the main cause of reduced platelet function and production. Pf4-Grin1−/− MKs also had lower levels of transcripts encoding crucial ECM elements and enzymes, suggesting NMDAR signaling is involved in ECM remodeling. In summary, we provide the first genetic evidence that NMDAR plays an active role in platelet function and production. NMDAR regulates PPF through a mechanism that involves MK-ECM interaction and cytoskeletal reorganization. Our results suggest that NMDAR helps guide PPF in vivo.
Introduction
Mature megakaryocytes (MKs) adhere to bone marrow (BM) sinusoids and initiate the process of platelet formation by extending small cytoplasmic protrusions (MK podosomes).1 Podosomes penetrate through the vessel wall, combine into broader pseudopods, and elongate into proplatelets that release platelets under the shear of flowing blood.2,3 Proplatelet formation (PPF) and platelet release are regulated by dynamic reorganization of the MK cytoskeleton composed primarily of the α/β-tubulin polymers and F-actin.4 The structural aspects of PPF have been well characterized, but the molecular drivers remain poorly understood.5,6 Thrombopoietin (TPO) is the primary regulator of MK expansion and differentiation; however, TPO does not control PPF.7,8 In 2012, sphingosine-1-phosphate produced by the endothelial cells of BM sinusoids was reported to guide proplatelets into the vessel lumen,9 but these findings were later contradicted.10 No other spatiotemporal signals regulating PPF are currently known; their identification is essential to help design novel therapies for patients with abnormal platelet counts.
Intracellular calcium ion (Ca2+) signaling is pivotal for platelet activation and thrombus formation; in comparison, the role of intracellular Ca2+ in PPF is less well characterized.11-13 Similar to other cells, MKs store Ca2+ in the endoplasmic reticulum (ER), release it through the interaction between inositol 1,4,5-trisphosphate (IP3) and its receptors (IP3Rs), and, when ER Ca2+ becomes depleted, initiate store-operated Ca2+ entry (SOCE) from the extracellular space.14 Orai1 is the platelet SOC channel, but Orai1 knockout mice have normal platelet counts.15 Other calcium channels likely compensate for the lack of Orai1 in MKs, because there is increasing evidence that intracellular Ca2+ influx regulates thrombopoiesis. The prominent example is adenosine 5′-diphosphate (ADP), which induces Ca2+ influx into MKs, leading to cytoskeletal rearrangements required for MK adhesion, migration, and PPF.16 Collagen receptors and mechanosensitive ion channels also induce Ca2+ influx into MKs followed by cytoskeletal reorganization, which provides a mechanism through which extracellular matrix (ECM) components and their stiffness levels regulate PPF.17-19
The N-methyl-D-aspartate (NMDA) receptor (NMDAR) is an ionotropic glutamate-gated cation channel with high Ca2+ permeability, best known for its roles in the brain20 but also found in nonneuronal cells.21 NMDARs are heterotetrameric transmembrane receptors that combine 2 GluN1 subunits with another 2 GluN2 (A-D) or GluN3 (A-B) subunits. The GluN1 subunit, encoded by the GRIN1 gene, is an obligate NMDAR component; the GluN2 and GluN3 subunits are regulatory.20 Emerging evidence has shown that NMDARs are functional and able to induce intracellular Ca2+ signals or mediate inward currents at negative potentials in brain-derived microvascular endothelial cells22 and lung-derived vascular smooth muscle cells,23 which may regulate vascular permeability and warrants testing in the BM. Using pharmacologic modulators, we and others have demonstrated that NMDAR supports platelet activation24-26 and MK maturation ex vivo.27-29 In primary cultures of human and mouse MKs, NMDAR channel blockers (MK-801 and memantine) inhibit PPF.27,28 However, all previous data on NMDAR effects in platelets and MKs have been obtained using chemical modulators, and the genetic evidence is missing. Therefore, we generated a Pf4 promoter–driven Cre-conditional Grin1 knockout mouse model to determine NMDAR contribution in platelets and MKs in vivo.
Methods
MK-specific deletion of Grin1 in mice
Animal studies were approved by the institutional animal ethics committee (approval #001912 and #2516). Mice with MK-specific NMDAR deletion (Pf4-Grin1−/− mice) were generated by crossing the Pf4-Cre (C57BL/6-Tg[Pf4-icre]Q3Rsko/J; JAX #008535)30 with the Grin1-loxP (B6.129S4/Grin1tm2Stl/J; JAX #005246)31 mouse strains purchased from The Jackson Laboratory (JAX, Sacramento, CA). Breeding was guided by genotyping using end point polymerase chain reaction (PCR) targeting Cre and the first loxP site of the Grin1-loxP cassette (Figure 1A; supplemental Figure 1; primers are provided in supplemental Table 1). Pf4-Cre−/− littermates from the F3 progeny (backcrossed onto the Grin1-loxP parent strain) were used as controls (ie, control mice were homozygous for the Grin1-loxP allele but did not carry the Pf4-Cre transgene). Male and female mice were tested between 8 and 12 weeks of age. Loss of NMDAR channel function was demonstrated in Pf4-Grin1−/− platelets using the Fura-2-AM Calcium Assay Kit (Abcam, Cambridge, United Kingdom).32 All methods are described in the data supplement.
![Validation of Grin1 knockout (KO) in mouse MKs. (A) Schematic demonstrating the Grin1 KO strategy. (A) The Grin1 gene locus (i) and the GluN1 protein (ii) are drawn showing the targeted portion for deletion in blue. Exons 11 to 22 surrounded by the loxP sites are shown in panel Ai; black arrows indicate location of the genotyping primers. The protein was truncated approximately at amino acid (aa) 400 (ii, blue arrow). The deletion encompassed the transmembrane (TM) region containing 4 TM domains (TM I-IV) and the C-terminus of GluN1. (B-C) Bar graphs showing the relative level of Grin1 deletion by Cre recombinase (B) and Grin1 messenger RNA expression (C) examined by quantitative PCR in Pf4-Grin1−/− MKs, calculated relative to WT MKs. Genomic DNA was amplified using primer sets targeting a nondeleted region of Grin1 (exons 7-8) and the loxP-flanked deleted region of Grin1 (exons 13-14); levels of deleted Grin1 were normalized to nondeleted Grin1 and made relative to WT (B); transcript levels of Grin1 were normalized to GusB and made relative to WT (C). Four independent experiments were performed, in triplicate. Bar graphs show mean ± SEM. Statistical significance is shown (2-tailed Student t test). (D) RT-PCR results showing expression of NMDAR subunit transcripts Grin2A, Grin2D, and Grin3B in WT and Pf4-Grin1−/− MKs; transcripts for other NMDAR subunits were not expressed. Mouse brain tissue was used as positive control. Negative control contained no DNA template (ie, no template control [NTC]). Actin B (Actb) served as a loading control. (E) Immunostaining of BM MKs (formalin-fixed paraffin-embedded sections) for the MK marker CD61 (red) and the GluN1 protein (green). An overlap between CD61 and GluN1 staining was seen in WT but not Pf4-Grin1−/− mice (an example is indicated by arrows). Cell nuclei were counterstained with Hoechst 33358 (blue). Three independent experiments were performed. Scale bar is shown. (Fi) Semiquantitative western blotting results demonstrating the level of the GluN1 signal estimated relative to β-actin in washed platelets from WT and Pf4-Grin1−/− mice. Results from 4 experiments are shown, each relative to the mean of controls within that run (normalized to 100%). Green symbols mark platelet samples processed by negative immunomagnetic selection procedure to deplete them of red cells (using anti–TER-119) and white cells (using anti-CD45 antibodies). (Fii) Western blot examples showing GluN1 and β-actin signals in washed platelets (lanes 1-5; 4 and 5 were loaded in duplicate) and in negatively selected platelets (lanes 6-9). (G-H) Ca2+ responses to NMDAR agonists in WT and Pf4-Grin1−/− platelets loaded with fura-2-AM. Baseline values were recorded for 30 seconds, and cells were stimulated by the addition of NMDA (100 μM) (G) and glutamate (500 μM) (H). Values are reported ratiometrically as 340 nm (Ca2+ bound) over 380 nm (Ca2+ free) (F340/F380) after being normalized to (1) at baseline. (Gi-Hi) Line graphs showing the mean relative levels of intracellular Ca2+ recorded over 120 seconds. (Gii-Hii) Corresponding scatterplots showing the peak relative levels of intracellular Ca2+ during the observation period (mean ± SEM). Data represent triplicate values from 3 biologic replicates per genotype. Statistical significance is shown (1-way analysis of variance with Dunnett post hoc for panels Gi and Hi and 2-tailed Student t test for panels Fi, Gii, and Hii). gDNA, genomic DNA; MW, molecular weight; ns, not significant.](https://ash.silverchair-cdn.com/ash/content_public/journal/blood/139/17/10.1182_blood.2021014000/4/m_bloodbld2021014000f1.png?Expires=1763487582&Signature=fwzBXJAYU2zOlpmlixewr8tE4gx0SFuEA2EG7uMAop18~bSS5QVYWpVBrj7GG8w9ZTp8DwHkZO-Dpwnw2lCuYOZuYe03qkkW8XRMcSg~GQr4hsHzwLv9RpTmvhE38tQ-mthan7FigOE2oMXYrQhVYb5XO8zT3lnWZ5NJ5tcfohPzI~1v7rI6jlv2PP~8djgmbByDPCDvk-REKGzVhYWmQ6phsTYqg4aFJ29V22PPrOzL232KqFUGXvUMg5Ph-EzJc--qLfp~tZjShneWLv7XdRPHIUh8DmxqNC9BXwcPT41e91IgeM9UQx7nYXQpb~c3LH4RhDdgcTEhmOzYVrtYHA__&Key-Pair-Id=APKAIE5G5CRDK6RD3PGA)
Validation of Grin1 knockout (KO) in mouse MKs. (A) Schematic demonstrating the Grin1 KO strategy. (A) The Grin1 gene locus (i) and the GluN1 protein (ii) are drawn showing the targeted portion for deletion in blue. Exons 11 to 22 surrounded by the loxP sites are shown in panel Ai; black arrows indicate location of the genotyping primers. The protein was truncated approximately at amino acid (aa) 400 (ii, blue arrow). The deletion encompassed the transmembrane (TM) region containing 4 TM domains (TM I-IV) and the C-terminus of GluN1. (B-C) Bar graphs showing the relative level of Grin1 deletion by Cre recombinase (B) and Grin1 messenger RNA expression (C) examined by quantitative PCR in Pf4-Grin1−/− MKs, calculated relative to WT MKs. Genomic DNA was amplified using primer sets targeting a nondeleted region of Grin1 (exons 7-8) and the loxP-flanked deleted region of Grin1 (exons 13-14); levels of deleted Grin1 were normalized to nondeleted Grin1 and made relative to WT (B); transcript levels of Grin1 were normalized to GusB and made relative to WT (C). Four independent experiments were performed, in triplicate. Bar graphs show mean ± SEM. Statistical significance is shown (2-tailed Student t test). (D) RT-PCR results showing expression of NMDAR subunit transcripts Grin2A, Grin2D, and Grin3B in WT and Pf4-Grin1−/− MKs; transcripts for other NMDAR subunits were not expressed. Mouse brain tissue was used as positive control. Negative control contained no DNA template (ie, no template control [NTC]). Actin B (Actb) served as a loading control. (E) Immunostaining of BM MKs (formalin-fixed paraffin-embedded sections) for the MK marker CD61 (red) and the GluN1 protein (green). An overlap between CD61 and GluN1 staining was seen in WT but not Pf4-Grin1−/− mice (an example is indicated by arrows). Cell nuclei were counterstained with Hoechst 33358 (blue). Three independent experiments were performed. Scale bar is shown. (Fi) Semiquantitative western blotting results demonstrating the level of the GluN1 signal estimated relative to β-actin in washed platelets from WT and Pf4-Grin1−/− mice. Results from 4 experiments are shown, each relative to the mean of controls within that run (normalized to 100%). Green symbols mark platelet samples processed by negative immunomagnetic selection procedure to deplete them of red cells (using anti–TER-119) and white cells (using anti-CD45 antibodies). (Fii) Western blot examples showing GluN1 and β-actin signals in washed platelets (lanes 1-5; 4 and 5 were loaded in duplicate) and in negatively selected platelets (lanes 6-9). (G-H) Ca2+ responses to NMDAR agonists in WT and Pf4-Grin1−/− platelets loaded with fura-2-AM. Baseline values were recorded for 30 seconds, and cells were stimulated by the addition of NMDA (100 μM) (G) and glutamate (500 μM) (H). Values are reported ratiometrically as 340 nm (Ca2+ bound) over 380 nm (Ca2+ free) (F340/F380) after being normalized to (1) at baseline. (Gi-Hi) Line graphs showing the mean relative levels of intracellular Ca2+ recorded over 120 seconds. (Gii-Hii) Corresponding scatterplots showing the peak relative levels of intracellular Ca2+ during the observation period (mean ± SEM). Data represent triplicate values from 3 biologic replicates per genotype. Statistical significance is shown (1-way analysis of variance with Dunnett post hoc for panels Gi and Hi and 2-tailed Student t test for panels Fi, Gii, and Hii). gDNA, genomic DNA; MW, molecular weight; ns, not significant.
Validation of Grin1 knockout (KO) in mouse MKs. (A) Schematic demonstrating the Grin1 KO strategy. (A) The Grin1 gene locus (i) and the GluN1 protein (ii) are drawn showing the targeted portion for deletion in blue. Exons 11 to 22 surrounded by the loxP sites are shown in panel Ai; black arrows indicate location of the genotyping primers. The protein was truncated approximately at amino acid (aa) 400 (ii, blue arrow). The deletion encompassed the transmembrane (TM) region containing 4 TM domains (TM I-IV) and the C-terminus of GluN1. (B-C) Bar graphs showing the relative level of Grin1 deletion by Cre recombinase (B) and Grin1 messenger RNA expression (C) examined by quantitative PCR in Pf4-Grin1−/− MKs, calculated relative to WT MKs. Genomic DNA was amplified using primer sets targeting a nondeleted region of Grin1 (exons 7-8) and the loxP-flanked deleted region of Grin1 (exons 13-14); levels of deleted Grin1 were normalized to nondeleted Grin1 and made relative to WT (B); transcript levels of Grin1 were normalized to GusB and made relative to WT (C). Four independent experiments were performed, in triplicate. Bar graphs show mean ± SEM. Statistical significance is shown (2-tailed Student t test). (D) RT-PCR results showing expression of NMDAR subunit transcripts Grin2A, Grin2D, and Grin3B in WT and Pf4-Grin1−/− MKs; transcripts for other NMDAR subunits were not expressed. Mouse brain tissue was used as positive control. Negative control contained no DNA template (ie, no template control [NTC]). Actin B (Actb) served as a loading control. (E) Immunostaining of BM MKs (formalin-fixed paraffin-embedded sections) for the MK marker CD61 (red) and the GluN1 protein (green). An overlap between CD61 and GluN1 staining was seen in WT but not Pf4-Grin1−/− mice (an example is indicated by arrows). Cell nuclei were counterstained with Hoechst 33358 (blue). Three independent experiments were performed. Scale bar is shown. (Fi) Semiquantitative western blotting results demonstrating the level of the GluN1 signal estimated relative to β-actin in washed platelets from WT and Pf4-Grin1−/− mice. Results from 4 experiments are shown, each relative to the mean of controls within that run (normalized to 100%). Green symbols mark platelet samples processed by negative immunomagnetic selection procedure to deplete them of red cells (using anti–TER-119) and white cells (using anti-CD45 antibodies). (Fii) Western blot examples showing GluN1 and β-actin signals in washed platelets (lanes 1-5; 4 and 5 were loaded in duplicate) and in negatively selected platelets (lanes 6-9). (G-H) Ca2+ responses to NMDAR agonists in WT and Pf4-Grin1−/− platelets loaded with fura-2-AM. Baseline values were recorded for 30 seconds, and cells were stimulated by the addition of NMDA (100 μM) (G) and glutamate (500 μM) (H). Values are reported ratiometrically as 340 nm (Ca2+ bound) over 380 nm (Ca2+ free) (F340/F380) after being normalized to (1) at baseline. (Gi-Hi) Line graphs showing the mean relative levels of intracellular Ca2+ recorded over 120 seconds. (Gii-Hii) Corresponding scatterplots showing the peak relative levels of intracellular Ca2+ during the observation period (mean ± SEM). Data represent triplicate values from 3 biologic replicates per genotype. Statistical significance is shown (1-way analysis of variance with Dunnett post hoc for panels Gi and Hi and 2-tailed Student t test for panels Fi, Gii, and Hii). gDNA, genomic DNA; MW, molecular weight; ns, not significant.
Statistical analyses
Quantitative data are expressed as mean ± standard error of the mean (SEM) for parametric data or median ± 95% confidence interval (CI) for nonparametric data; data parametricity was assessed via Shapiro-Wilk test. Statistical analyses were conducted using GraphPad Prism 8.0 (GraphPad Software, San Diego, CA). Differences between group means were compared with either Student t test (2 tailed), Welch t test, 1-way analysis of variance with Dunnett post hoc, 2-way analysis of variance, or analysis of covariance for parametric data and with Mann-Whitney U test for nonparametric data. To combine the statistical evidence provided by microarrays with the quantitative reverse transcription PCR (RT-PCR) data, Student t test (2 tailed) was performed, followed by a meta-analysis using the Stouffer method.33,34P values <.05 were considered statistically significant.
Results
Platelets from Pf4-Grin1−/− mice show reduced Ca2+ fluxes
This study generated a platelet lineage–specific NMDAR knockout mouse model, the Pf4-Grin1−/− mouse, to examine NMDAR function in MKs and platelets in vivo. The lineage-targeted approach was required, because global NMDAR knockout results in neonatal death in mice.35 Our model used the MK-directed Pf4 promoter–driven Cre recombinase to excise exons 11 to 22 of the Grin1 gene in MKs (Figure 1Ai). The deleted exons encode the large transmembrane region of the GluN1 protein required for receptor assembly (Figure 1Aii).20 To validate Grin1 deletion, MKs were isolated from BM by density gradient centrifugation, magnetic bead sorting, and micromanipulation (∼100 MKs per mouse), and the levels of Grin1 DNA and messenger RNA were determined relative to MKs of wild-type (WT) mice. Pf4-Grin1−/− MKs showed an 85% reduction of genomic Grin1 (Figure 1B), and in Grin1 transcripts (Figure 1C), compared with WT MKs. Expression of other Grin transcripts (Grin2A, Grin2D, and Grin3B) was maintained (Figure 1D; other subunits were not expressed). Immunofluorescence of BM sections showed loss of staining for the GluN1 protein in Pf4-Grin1−/− MKs visualized with anti-CD61 (Figure 1E). Examination of MKs by flow cytometry was precluded by the lack of suitable antibodies (supplemental Figure 2). By western blotting, GluN1 expression in washed platelets was reduced by up to 80%, with up to 90% reduction detected after the depletion of red cells and white cells, because these cells may also express NMDAR36-39 (Figure 1F). To confirm NMDAR function was reduced, mouse platelets were isolated and loaded with fura-2-AM, and Ca2+ fluxes were tested in response to NMDAR agonists. NMDA (a synthetic but specific NMDAR agonist) triggered Ca2+ fluxes in WT platelets, but these were minimal in Pf4-Grin1−/− platelets (Figure 1G), confirming effective knockout of the NMDAR channel function. Glutamate (endogenous but nonspecific NMDAR agonist) caused Ca2+ fluxes that were weaker in Pf4-Grin1−/− platelets (peak responses were lower by 47.2%; Figure 1H), consistent with the presence of other glutamate-responsive Ca2+ pathways in platelets.40
Pf4-Grin1−/− mice have reduced platelet counts and abnormal platelet function
Pf4-Grin1−/− mice showed normal Mendelian inheritance, normal weight and growth rates, and no obvious signs of ill health (data not shown). Blood counts on the blood collected via saphenous vein puncture showed a mean 27% reduction in the peripheral blood platelet count in Pf4-Grin1−/− mice (801 ± 41 vs 1090 ± 40 ×109/L in WT mice; Figure 2A). No other changes in blood count or platelet size were detected (Table 1), and no changes in gross platelet morphology or platelet ultrastructure were visible (supplemental Figure 3).
![Impact of Grin1 deletion on platelet phenotype. (A-B) Scatterplots of platelet counts (A) and tail bleeding time (B) in WT, Pf4-Grin1+/−, and Pf4-Grin1−/− mice (8-17 biologic replicates per group). (C) Line graphs showing median fluorescence intensity of the platelet surface activation markers CD62P and JON/A after activation with ADP (1, 2.5, 5, and 10 μM) (i), thrombin (0.01, 0.25, and 0.5 U/mL) (ii), and convulxin (0.05 and 0.5 μg/mL) (iii), examined by flow cytometry. Four independent experiments were performed. (D) Scatterplots showing platelet aggregation as a percentage of area under the curve. Platelets were stimulated with either ADP (2.5, 5, and 10 μM) or thrombin (0.025, 0.05, and 0.1 U/mL), and platelet aggregation was measured by light transmission aggregometry. Three to 5 independent biologic experiments were performed, with 3 technical replicates per group. Data points are mean ± SEM. Statistical significance is shown (2-tailed Student t test for panels A and B [with Welch correction]; 2-way analysis of variance for panels C and D).](https://ash.silverchair-cdn.com/ash/content_public/journal/blood/139/17/10.1182_blood.2021014000/4/m_bloodbld2021014000f2.png?Expires=1763487582&Signature=t6fRRRLzl0aTlPeOYErxG52ytCFRgflc5gtrfnTFZqBeLnSKfa8HDQ7hdUhEz4Gjx4YGOapHJdmdCFHaBAjCPUdlhIKlNYy4JTpBIH1JAPOlejti3f~gWPg7D5ZsV2RSxPBsuAduS0ikEIHWJ6g4O1cjlhWWmL5l-z2EY-jt~E5ouUrtm97bHCIXlHvA9XUc2PatSx66ov7PZXKzsvF5Ia3kr0GsyUiyW5rM13YGiROUI5jpuZpso31ArxSNBI0wSigD7i-gQZn1M9RCvcYAPbdB8T25Kec2ce4L4~~L3RURkOzOoq1jl~gQnIogC71C3Wx26FWk1iTd0WRG7yW6Jg__&Key-Pair-Id=APKAIE5G5CRDK6RD3PGA)
Impact of Grin1 deletion on platelet phenotype. (A-B) Scatterplots of platelet counts (A) and tail bleeding time (B) in WT, Pf4-Grin1+/−, and Pf4-Grin1−/− mice (8-17 biologic replicates per group). (C) Line graphs showing median fluorescence intensity of the platelet surface activation markers CD62P and JON/A after activation with ADP (1, 2.5, 5, and 10 μM) (i), thrombin (0.01, 0.25, and 0.5 U/mL) (ii), and convulxin (0.05 and 0.5 μg/mL) (iii), examined by flow cytometry. Four independent experiments were performed. (D) Scatterplots showing platelet aggregation as a percentage of area under the curve. Platelets were stimulated with either ADP (2.5, 5, and 10 μM) or thrombin (0.025, 0.05, and 0.1 U/mL), and platelet aggregation was measured by light transmission aggregometry. Three to 5 independent biologic experiments were performed, with 3 technical replicates per group. Data points are mean ± SEM. Statistical significance is shown (2-tailed Student t test for panels A and B [with Welch correction]; 2-way analysis of variance for panels C and D).
Impact of Grin1 deletion on platelet phenotype. (A-B) Scatterplots of platelet counts (A) and tail bleeding time (B) in WT, Pf4-Grin1+/−, and Pf4-Grin1−/− mice (8-17 biologic replicates per group). (C) Line graphs showing median fluorescence intensity of the platelet surface activation markers CD62P and JON/A after activation with ADP (1, 2.5, 5, and 10 μM) (i), thrombin (0.01, 0.25, and 0.5 U/mL) (ii), and convulxin (0.05 and 0.5 μg/mL) (iii), examined by flow cytometry. Four independent experiments were performed. (D) Scatterplots showing platelet aggregation as a percentage of area under the curve. Platelets were stimulated with either ADP (2.5, 5, and 10 μM) or thrombin (0.025, 0.05, and 0.1 U/mL), and platelet aggregation was measured by light transmission aggregometry. Three to 5 independent biologic experiments were performed, with 3 technical replicates per group. Data points are mean ± SEM. Statistical significance is shown (2-tailed Student t test for panels A and B [with Welch correction]; 2-way analysis of variance for panels C and D).
Peripheral blood counts from WT, Pf4-Grin1+/−, and Pf4-Grin1−/− mice
| WT | Pf4-Grin1+/− | P | Pf4-Grin1+/− | P | |
|---|---|---|---|---|---|
| Hemoglobin, g/L | 152.4 ± 4.0 | 144.4 ± 5.8 | .313 | 146.8 ± 6.8 | .459 |
| Hematocrit, % | 51.8 ± 1.0 | 49.3 ± 1.9 | .252 | 49.6 ± 2.3 | .367 |
| Red blood cell count, ×1012 cells per L | 9.95 ± 0.22 | 9.40 ± 0.32 | .210 | 9.50 ± 0.44 | .337 |
| White blood cell count, ×109 cells per L | 12.1 ± 1.2 | 11.2 ± 1.4 | .170 | 14.3 ± 1.1 | .197 |
| Platelet count, ×109 cells per L | 1090 ± 40 | 1043 ± 50 | .275 | 801 ± 41 | <.001 |
| Mean platelet volume, fL | 4.74 ± 0.09 | 4.85 ± 0.12 | .482 | 4.86 ± 0.17 | .750 |
| Platelet distribution width, fL | 14.61 ± 0.05 | 14.6 ± 0.03 | .801 | 14.60 ± 0.08 | .970 |
Data are given as mean ± SEM.
Pf4-Grin1−/− mice had increased tail bleeding time (421.8 ± 39.7 vs 252.4 ± 13.7 seconds in WT mice; Figure 2B). Pf4-Grin1−/− platelets showed impaired activation ex vivo manifested by reduced CD62P externalization after activation with thrombin (0.01-0.5 U/mL; Figure 2Cii) and reduced JON/A binding after stimulation with ADP (1-10 μM; Figure 2Ci) and convulxin (0.05-0.5 μg/mL; Figure 2Ciii; supplemental Figures 4 and 5). The reduction in CD62P and JON/A surface staining was similar across activators, implying that loss of NMDAR affected platelet activation in a systemic manner rather than via a specific pathway. There was no difference in the intracellular detection of the dense granule marker CD63 or α-granule marker CD62P in nonactivated platelets (supplemental Figure 6). Expression of platelet glycoproteins (GPIbα, GPIbβ, GPVI, and GPIIb/IIIa) was also unchanged when tested by flow cytometry (supplemental Figure 7). After stimulation with a gradient of ADP (2.5-10 μM), there was no difference in platelet ATP release (supplemental Figure 8) and no clear defect in platelet aggregation in response to ADP and thrombin by light transmission aggregometry (Figure 2D; supplemental Figure 9). These results support an NMDAR role in normal hemostasis, but the mechanism remains unclear.
Pf4-Grin1−/− platelets display reduced Ca2+ responses to thapsigargin and ADP
After activation with ligands, neuronal NMDAR is highly permeable to Ca2+.20 Nonneuronal NMDAR may also operate in a metabotropic manner and induce Ca2+ release from the ER.22,41,42 Intracellular Ca2+ signaling is crucial for platelet activation43; therefore, we studied Ca2+ responses in Pf4-Grin1−/− platelets. Platelets were loaded with fura-2-AM, and relative intracellular Ca2+ levels were determined from the fluorescent 340/380 nm ratio. Release of intracellular Ca2+ stores and SOCE were evaluated in a modified Ca2+ add-back protocol32,44 (Figure 3; supplemental Figure 10). In the presence of extracellular Ca2+, NMDA (100 μM) induced Ca2+ influx into platelets, as expected; however, intracellular Ca2+ levels also increased when NMDA was added in the absence of extracellular Ca2+, suggesting a metabotropic-like NMDAR function in platelets (Figure 3A). The amplitude of this metabotropic-like response slowly declined but increased after the addition of extracellular Ca2+ (Figure 3A), and it was abolished by Grin1 knockout (Figure 3B). We then evaluated platelet Ca2+ responses to thapsigargin (2 μM) and ADP (5 μM), first in the absence of NMDA to determine whether NMDAR tonically regulates intracellular Ca2+ homeostasis (Figure 3C-D) and then after preincubation with NMDA (100 μM; 10 minutes) to assess contribution of active NMDAR (Figure 3E-F). In the absence of NMDA, there was no clear difference in Ca2+ response between WT and Pf4-Grin1−/− platelets (Figure 3C-D), arguing against constitutive NMDAR contribution to platelet Ca2+ homeostasis. In contrast, preincubation with NMDA enhanced both thapsigargin- and ADP-induced intracellular Ca2+ store release and SOCE in WT (Figure 3E-F) but not Pf4-Grin1−/− platelets (Figure 3F-G), emphasizing an active role of NMDAR in platelet Ca2+ signaling. The weakening of the Ca2+ response was also observed when Pf4-Grin1−/− platelets were tested in a buffer containing Ca2+ (1 mM) and glutamate (100 μM) to mimic conditions in plasma (supplemental Figure 11).45 The reduced Ca2+ signals in Pf4-Grin1−/− platelets may have influenced their abnormal function.
![Impact of Grin1 deletion on intracellular Ca2+ responses in mouse platelets. (A-H [i panels]) Line graphs showing mean ± SEM relative levels of intracellular Ca2+ in platelets loaded with fura-2-AM (15 μM) determined from a normalized fluorescent 340/380 nm ratio (F340/F380) recorded over 535 seconds under the conditions indicated. Platelets were prepared and tested in the presence of platelet inhibitors (100 μM of aspirin, 0.32 U/mL of apyrase, and 50 μg/mL of Intergrilin [eptifibatide]). Line graphs start with showing the relative level of intracellular Ca2+ in platelets recorded in the presence of 2 mM of Ca2+ (30-second baseline), followed by the measurements recorded after the addition of EGTA (2 mM; dashed line) and then after the readdition of extracellular Ca2+ (2 mM; solid line). Downward arrow indicates a time point when a modulator was added: NMDA (100 μM) (A-B), thapsigargin (TG; 2 μM) C,E,G), or ADP (5 μM) (D,F,H). The first wave of the Ca2+ response, recorded after the addition of a modulator, corresponds to the release of intracellular Ca2+ stores, and the second wave, recorded after the readdition of extracellular Ca2+, corresponds to SOCE. In panels E, F, and G, “+ NMDA” refers to a 10-minute preincubation of platelets with NMDA (100 μM) performed before the commencement of the recordings; panels C and D were recorded without preincubation with NMDA; panels G and H show the knockout platelet controls for both conditions. WT platelet controls are shown in supplemental Figure 10. (A-H [ii panels]) Corresponding scatterplots showing changes in intracellular Ca2+ store release and SOCE quantified from an area under the curve measured using Prism software for the first and second waves of the Ca2+ response, respectively. Five independent experiments were performed for each condition, with 3 technical replicates. Data points are mean ± SEM. Mouse genotype is indicated. Statistical significance is shown (unpaired Student t test). ns, not significant.](https://ash.silverchair-cdn.com/ash/content_public/journal/blood/139/17/10.1182_blood.2021014000/4/m_bloodbld2021014000f3a.png?Expires=1763487582&Signature=LxXepYHAyhDrjkZaScM4NcKWWGMFfL9aM1pj9fUFf3phhBPBZ4-cXOFe2HF2cRGWVyZcE8wHfnT25ob6EOT7Yr5m3yRiKe5BvixjQTPCmU6MpPP7e5ks-Ac0A7bKLOpYlGqe90nxf5st7sqNmfgwaT7NC95mZ6ZK8TGZ953xR7mG6lVqJqwhTSnNm5Q7R-cqS5gtnIF0DXmqIQmgZtzZyTG1jGAWa~70FBzbHN42ZsxvJwB5rOD~gdxmnJe1laf8I4w2nmOVlYZCvB1LIlQNYPNDa95vw6iK-Fvwn6~ZNKwQpnjYo9aR3ginf5YG1xmrNl8FNgek~b~-JuXvly623A__&Key-Pair-Id=APKAIE5G5CRDK6RD3PGA)
![Impact of Grin1 deletion on intracellular Ca2+ responses in mouse platelets. (A-H [i panels]) Line graphs showing mean ± SEM relative levels of intracellular Ca2+ in platelets loaded with fura-2-AM (15 μM) determined from a normalized fluorescent 340/380 nm ratio (F340/F380) recorded over 535 seconds under the conditions indicated. Platelets were prepared and tested in the presence of platelet inhibitors (100 μM of aspirin, 0.32 U/mL of apyrase, and 50 μg/mL of Intergrilin [eptifibatide]). Line graphs start with showing the relative level of intracellular Ca2+ in platelets recorded in the presence of 2 mM of Ca2+ (30-second baseline), followed by the measurements recorded after the addition of EGTA (2 mM; dashed line) and then after the readdition of extracellular Ca2+ (2 mM; solid line). Downward arrow indicates a time point when a modulator was added: NMDA (100 μM) (A-B), thapsigargin (TG; 2 μM) C,E,G), or ADP (5 μM) (D,F,H). The first wave of the Ca2+ response, recorded after the addition of a modulator, corresponds to the release of intracellular Ca2+ stores, and the second wave, recorded after the readdition of extracellular Ca2+, corresponds to SOCE. In panels E, F, and G, “+ NMDA” refers to a 10-minute preincubation of platelets with NMDA (100 μM) performed before the commencement of the recordings; panels C and D were recorded without preincubation with NMDA; panels G and H show the knockout platelet controls for both conditions. WT platelet controls are shown in supplemental Figure 10. (A-H [ii panels]) Corresponding scatterplots showing changes in intracellular Ca2+ store release and SOCE quantified from an area under the curve measured using Prism software for the first and second waves of the Ca2+ response, respectively. Five independent experiments were performed for each condition, with 3 technical replicates. Data points are mean ± SEM. Mouse genotype is indicated. Statistical significance is shown (unpaired Student t test). ns, not significant.](https://ash.silverchair-cdn.com/ash/content_public/journal/blood/139/17/10.1182_blood.2021014000/4/m_bloodbld2021014000f3b.png?Expires=1763487582&Signature=WK692xltKqJ1hHWBXL2-s9qELui8tmeYvnQKfhhgA9I5-FpTq0robwoZi1qdOXThxzvjPTRK4i76cPnc66SkCItCzbk73RwOQJpC70wkstdSwQrR0DefLbb1KMdyfazE1MRzwMoenILqrZNFaokrOSS5BSIqeVEPMa3atxT6F0H6WyZNwu9G0XQlNIE8vpgs1jWJ7yuUe4x7Bf-m8LQtExzuuGXARTsdyaqZMLG5JWvZxZEKoeZH9UbuGVp0dRXYTVGnaxuZzi09dNwdKjmIhLYfAZj0nh0~M9lDuFwnuR7~ruiMt8Rpof~6lI9nTlvTagjMdEk2g5KCnf8AtO7IqQ__&Key-Pair-Id=APKAIE5G5CRDK6RD3PGA)
![Impact of Grin1 deletion on intracellular Ca2+ responses in mouse platelets. (A-H [i panels]) Line graphs showing mean ± SEM relative levels of intracellular Ca2+ in platelets loaded with fura-2-AM (15 μM) determined from a normalized fluorescent 340/380 nm ratio (F340/F380) recorded over 535 seconds under the conditions indicated. Platelets were prepared and tested in the presence of platelet inhibitors (100 μM of aspirin, 0.32 U/mL of apyrase, and 50 μg/mL of Intergrilin [eptifibatide]). Line graphs start with showing the relative level of intracellular Ca2+ in platelets recorded in the presence of 2 mM of Ca2+ (30-second baseline), followed by the measurements recorded after the addition of EGTA (2 mM; dashed line) and then after the readdition of extracellular Ca2+ (2 mM; solid line). Downward arrow indicates a time point when a modulator was added: NMDA (100 μM) (A-B), thapsigargin (TG; 2 μM) C,E,G), or ADP (5 μM) (D,F,H). The first wave of the Ca2+ response, recorded after the addition of a modulator, corresponds to the release of intracellular Ca2+ stores, and the second wave, recorded after the readdition of extracellular Ca2+, corresponds to SOCE. In panels E, F, and G, “+ NMDA” refers to a 10-minute preincubation of platelets with NMDA (100 μM) performed before the commencement of the recordings; panels C and D were recorded without preincubation with NMDA; panels G and H show the knockout platelet controls for both conditions. WT platelet controls are shown in supplemental Figure 10. (A-H [ii panels]) Corresponding scatterplots showing changes in intracellular Ca2+ store release and SOCE quantified from an area under the curve measured using Prism software for the first and second waves of the Ca2+ response, respectively. Five independent experiments were performed for each condition, with 3 technical replicates. Data points are mean ± SEM. Mouse genotype is indicated. Statistical significance is shown (unpaired Student t test). ns, not significant.](https://ash.silverchair-cdn.com/ash/content_public/journal/blood/139/17/10.1182_blood.2021014000/4/m_bloodbld2021014000f3c.png?Expires=1763487582&Signature=WCy7oyGADPWXjwpNAuJOBk80SJhTvaXI99CQxzgNxIt1rp-p8nDAjOQCOg6ixNFv~x2UiQYa5KAxp~4B5nwlOLRZm92825Wc4cd2qXTS8MSNDX5w29k2tkLSzWxtVLX43-hlsprjUXoGjfGCrRntAVk8x8JWC8Nuk-jn6f3VshMW1f1TxvJ8aPKben4WK7h5yRELXTSe0S6-0NoIGRtYcO2N85Gi6sybqBxvibarWlNkzmRVOKFeV8LNuOhauA-vASXEQmnrNCDbiALKDaCWmRMkYOBL8dbjz3FHbdrg3qnHN8Ko5a9IxeqYTgWqIVBrElnTH9sQNYZrIU9WxjdU3w__&Key-Pair-Id=APKAIE5G5CRDK6RD3PGA)
Impact of Grin1 deletion on intracellular Ca2+ responses in mouse platelets. (A-H [i panels]) Line graphs showing mean ± SEM relative levels of intracellular Ca2+ in platelets loaded with fura-2-AM (15 μM) determined from a normalized fluorescent 340/380 nm ratio (F340/F380) recorded over 535 seconds under the conditions indicated. Platelets were prepared and tested in the presence of platelet inhibitors (100 μM of aspirin, 0.32 U/mL of apyrase, and 50 μg/mL of Intergrilin [eptifibatide]). Line graphs start with showing the relative level of intracellular Ca2+ in platelets recorded in the presence of 2 mM of Ca2+ (30-second baseline), followed by the measurements recorded after the addition of EGTA (2 mM; dashed line) and then after the readdition of extracellular Ca2+ (2 mM; solid line). Downward arrow indicates a time point when a modulator was added: NMDA (100 μM) (A-B), thapsigargin (TG; 2 μM) C,E,G), or ADP (5 μM) (D,F,H). The first wave of the Ca2+ response, recorded after the addition of a modulator, corresponds to the release of intracellular Ca2+ stores, and the second wave, recorded after the readdition of extracellular Ca2+, corresponds to SOCE. In panels E, F, and G, “+ NMDA” refers to a 10-minute preincubation of platelets with NMDA (100 μM) performed before the commencement of the recordings; panels C and D were recorded without preincubation with NMDA; panels G and H show the knockout platelet controls for both conditions. WT platelet controls are shown in supplemental Figure 10. (A-H [ii panels]) Corresponding scatterplots showing changes in intracellular Ca2+ store release and SOCE quantified from an area under the curve measured using Prism software for the first and second waves of the Ca2+ response, respectively. Five independent experiments were performed for each condition, with 3 technical replicates. Data points are mean ± SEM. Mouse genotype is indicated. Statistical significance is shown (unpaired Student t test). ns, not significant.
Impact of Grin1 deletion on intracellular Ca2+ responses in mouse platelets. (A-H [i panels]) Line graphs showing mean ± SEM relative levels of intracellular Ca2+ in platelets loaded with fura-2-AM (15 μM) determined from a normalized fluorescent 340/380 nm ratio (F340/F380) recorded over 535 seconds under the conditions indicated. Platelets were prepared and tested in the presence of platelet inhibitors (100 μM of aspirin, 0.32 U/mL of apyrase, and 50 μg/mL of Intergrilin [eptifibatide]). Line graphs start with showing the relative level of intracellular Ca2+ in platelets recorded in the presence of 2 mM of Ca2+ (30-second baseline), followed by the measurements recorded after the addition of EGTA (2 mM; dashed line) and then after the readdition of extracellular Ca2+ (2 mM; solid line). Downward arrow indicates a time point when a modulator was added: NMDA (100 μM) (A-B), thapsigargin (TG; 2 μM) C,E,G), or ADP (5 μM) (D,F,H). The first wave of the Ca2+ response, recorded after the addition of a modulator, corresponds to the release of intracellular Ca2+ stores, and the second wave, recorded after the readdition of extracellular Ca2+, corresponds to SOCE. In panels E, F, and G, “+ NMDA” refers to a 10-minute preincubation of platelets with NMDA (100 μM) performed before the commencement of the recordings; panels C and D were recorded without preincubation with NMDA; panels G and H show the knockout platelet controls for both conditions. WT platelet controls are shown in supplemental Figure 10. (A-H [ii panels]) Corresponding scatterplots showing changes in intracellular Ca2+ store release and SOCE quantified from an area under the curve measured using Prism software for the first and second waves of the Ca2+ response, respectively. Five independent experiments were performed for each condition, with 3 technical replicates. Data points are mean ± SEM. Mouse genotype is indicated. Statistical significance is shown (unpaired Student t test). ns, not significant.
Grin1 deletion alters platelet production
The decreased platelet counts in Pf4-Grin1−/− mice could have been caused by a defect in platelet production and/or a defect in platelet lifespan. Platelet production kinetics were investigated in a model of acute antibody-induced thrombocytopenia. After IV injection of rabbit-derived antiplatelet serum, Pf4-Grin1−/− mice showed slower recovery of platelet counts compared with WT mice, with a peak differential of a 29% lower count after 72 hours (Figure 4A), suggesting a defect in platelet production. The rapid rise in platelet counts beyond baseline levels was consistent with the mechanism of emergency thrombopoiesis.46,47 Measurements of platelet half-life after platelet labeling with DyLight488-conjugated anti-CD42 antibodies revealed no difference between Pf4-Grin1−/− and WT mice, indicating normal platelet clearance rates (Figure 4B).
![Impact of Grin1 deletion on megakaryopoiesis and thrombopoiesis in vivo and ex vivo. (A) Line graph showing peripheral platelet counts from Pf4-Grin1−/− and WT mice after injection with antiplatelet serum (APS). Three independent experiments were performed, with a total of 12 to 15 biologic replicates per group. (B) Line graph showing platelet half-life of Pf4-Grin1−/− and WT mice. Platelets were labeled in vivo after IV injection of DyLight488-conjugated anti-CD42 (×488) antibodies, and the proportion of positively labeled platelets was measured by flow cytometry. Four independent experiments were performed, with a total of 10 biologic replicates per group per time point. (C-E) Representative images of BM sections from WT and Pf4-Grin1−/− mice under bright-field microscopy stained with hematoxylin and eosin (C), immunofluorescence staining of GPIX (megakaryocytic marker [green]) and CD105 (endothelial cell marker [red], with framed areas enlarged in the right panels; nuclei stained with 4′,6-diamidino-2-phenylindole [blue]) (D), and CD61 immunostaining (Ei). Scale bars are shown. (Eii) Bar graph showing MK counts (CD61+ cells per 20× field counted from sections shown in panel Ei) from WT and Pf4-Grin1−/− mice. (F) Bar graph showing level of nuclear ploidy (%) in WT and Pf4-Grin1−/− mice examined by flow cytometry; 2N, 4N, 8N, 16N, 32N, and 64N indicate ploidy classes. Five independent experiments were performed with 5 biologic replicates per group. (G) Bar graphs showing number of MK colonies observed per matrix, examined using the MegaCult assay. MKs were stained with acetylthiocholiniodide solution; colonies were counted and scored as small (3-20 cells), medium (20-50 cells), or large (>50 cells). Four independent experiments were performed. (H) Examination of PPF by MKs migrating out of BM explants. (Hi) Representative images of MKs scored as round, protrusion forming, or proplatelet forming (indicated by arrows). Scale bar is shown. (Hii) Bar graphs showing percentage of MK forms per explant. Three independent experiments were performed. Triplicate measures were recorded per biologic replicate with a total of 3 biologic replicates per group. Line and bar graphs show mean ± SEM in panels A-B and E-H. Statistical significance is shown (2-way analysis of variance for panels A and F; analysis of covariance for panel B; 2-tailed Student t test for panels Eii, G, and Hii).](https://ash.silverchair-cdn.com/ash/content_public/journal/blood/139/17/10.1182_blood.2021014000/4/m_bloodbld2021014000f4.png?Expires=1763487582&Signature=FGzTc08fNG2JcT61TOogwrVr7uTRP3RGhzd2T~0u7ZV7-PhJqqxY8pGRIxELcJB5i3URiJfMB0yx5FLy49REjqDIZSNLnsGXRiVq64~F67SZIjWUsG9iu3rde3JDMBHjiuiMFcBRAMSTxSX8Ph8oE7a6QV0JH91dm8QuBfiNIIKGXFmhdCryMBgrlUyS91m6mwau3qoJ-vg0UGeLJbR7BeAhY~8dlubXiXxCsXBXHf8SgEbcmVXoLHtqqg~yP3i0hlMxTydpJ~z51x5EC4c7PZ0mgc5sLeM-Faa2UDOEIJlU~WQKz07E7umtVrofGvVUoy5c~UKOFy0rWtHqC63Vng__&Key-Pair-Id=APKAIE5G5CRDK6RD3PGA)
Impact of Grin1 deletion on megakaryopoiesis and thrombopoiesis in vivo and ex vivo. (A) Line graph showing peripheral platelet counts from Pf4-Grin1−/− and WT mice after injection with antiplatelet serum (APS). Three independent experiments were performed, with a total of 12 to 15 biologic replicates per group. (B) Line graph showing platelet half-life of Pf4-Grin1−/− and WT mice. Platelets were labeled in vivo after IV injection of DyLight488-conjugated anti-CD42 (×488) antibodies, and the proportion of positively labeled platelets was measured by flow cytometry. Four independent experiments were performed, with a total of 10 biologic replicates per group per time point. (C-E) Representative images of BM sections from WT and Pf4-Grin1−/− mice under bright-field microscopy stained with hematoxylin and eosin (C), immunofluorescence staining of GPIX (megakaryocytic marker [green]) and CD105 (endothelial cell marker [red], with framed areas enlarged in the right panels; nuclei stained with 4′,6-diamidino-2-phenylindole [blue]) (D), and CD61 immunostaining (Ei). Scale bars are shown. (Eii) Bar graph showing MK counts (CD61+ cells per 20× field counted from sections shown in panel Ei) from WT and Pf4-Grin1−/− mice. (F) Bar graph showing level of nuclear ploidy (%) in WT and Pf4-Grin1−/− mice examined by flow cytometry; 2N, 4N, 8N, 16N, 32N, and 64N indicate ploidy classes. Five independent experiments were performed with 5 biologic replicates per group. (G) Bar graphs showing number of MK colonies observed per matrix, examined using the MegaCult assay. MKs were stained with acetylthiocholiniodide solution; colonies were counted and scored as small (3-20 cells), medium (20-50 cells), or large (>50 cells). Four independent experiments were performed. (H) Examination of PPF by MKs migrating out of BM explants. (Hi) Representative images of MKs scored as round, protrusion forming, or proplatelet forming (indicated by arrows). Scale bar is shown. (Hii) Bar graphs showing percentage of MK forms per explant. Three independent experiments were performed. Triplicate measures were recorded per biologic replicate with a total of 3 biologic replicates per group. Line and bar graphs show mean ± SEM in panels A-B and E-H. Statistical significance is shown (2-way analysis of variance for panels A and F; analysis of covariance for panel B; 2-tailed Student t test for panels Eii, G, and Hii).
Impact of Grin1 deletion on megakaryopoiesis and thrombopoiesis in vivo and ex vivo. (A) Line graph showing peripheral platelet counts from Pf4-Grin1−/− and WT mice after injection with antiplatelet serum (APS). Three independent experiments were performed, with a total of 12 to 15 biologic replicates per group. (B) Line graph showing platelet half-life of Pf4-Grin1−/− and WT mice. Platelets were labeled in vivo after IV injection of DyLight488-conjugated anti-CD42 (×488) antibodies, and the proportion of positively labeled platelets was measured by flow cytometry. Four independent experiments were performed, with a total of 10 biologic replicates per group per time point. (C-E) Representative images of BM sections from WT and Pf4-Grin1−/− mice under bright-field microscopy stained with hematoxylin and eosin (C), immunofluorescence staining of GPIX (megakaryocytic marker [green]) and CD105 (endothelial cell marker [red], with framed areas enlarged in the right panels; nuclei stained with 4′,6-diamidino-2-phenylindole [blue]) (D), and CD61 immunostaining (Ei). Scale bars are shown. (Eii) Bar graph showing MK counts (CD61+ cells per 20× field counted from sections shown in panel Ei) from WT and Pf4-Grin1−/− mice. (F) Bar graph showing level of nuclear ploidy (%) in WT and Pf4-Grin1−/− mice examined by flow cytometry; 2N, 4N, 8N, 16N, 32N, and 64N indicate ploidy classes. Five independent experiments were performed with 5 biologic replicates per group. (G) Bar graphs showing number of MK colonies observed per matrix, examined using the MegaCult assay. MKs were stained with acetylthiocholiniodide solution; colonies were counted and scored as small (3-20 cells), medium (20-50 cells), or large (>50 cells). Four independent experiments were performed. (H) Examination of PPF by MKs migrating out of BM explants. (Hi) Representative images of MKs scored as round, protrusion forming, or proplatelet forming (indicated by arrows). Scale bar is shown. (Hii) Bar graphs showing percentage of MK forms per explant. Three independent experiments were performed. Triplicate measures were recorded per biologic replicate with a total of 3 biologic replicates per group. Line and bar graphs show mean ± SEM in panels A-B and E-H. Statistical significance is shown (2-way analysis of variance for panels A and F; analysis of covariance for panel B; 2-tailed Student t test for panels Eii, G, and Hii).
Histologic examination of BM tissue showed no gross changes in BM morphology (Figure 4C), including similar localization of MKs relative to sinusoidal vessels visualized with GPIX and CD105 immunostaining, respectively (Figure 4D). There was no difference in numbers of MKs counted on marrow sections after staining for CD61 (Figure 4Ei-ii), no change in ploidy distribution tested by flow cytometry (Figure 4F; supplemental Figure 12), and no obvious ultrastructural abnormalities in MKs from Pf4-Grin1−/− mice (supplemental Figure 13).
MK colony formation was examined ex vivo using the MegaCult assay. Marrow progenitors were isolated and cultured on a collagen matrix in the presence of a cocktail of cytokines, including TPO, interleukin-3, and interleukin-6. After staining with acetylthiocholiniodide, MK colonies were counted and scored as small (3-20 cells), medium (20-50 cells), or large (>50 cells; supplemental Figure 14). Pf4-Grin1−/− cultures showed 18.2% fewer total colonies (45.8 ± 1.7 vs 38.7 ± 1.9) and 61.4% fewer large MK colonies (1.9 ± 0.5 vs 0.7 ± 0.3) than WT cultures (Figure 4G).
To examine formation of proplatelets, BM explants were isolated and cultured for 12 hours. MKs were counted and scored as round, protrusion forming, or proplatelet forming (Figure 4Hi). Pf4-Grin1−/− explants generated half the number of proplatelet-forming MKs of WT explants, accompanied by a corresponding increase in the number of round MKs (Figure 4Hii). In summary, these experiments identified an NMDAR role in MK differentiation, particularly in PPF. The ex vivo phenotype was stronger compared with the mild thrombocytopenia in Pf4-Grin1−/− mice, suggesting that other BM cells/constituents provide compensation in vivo, as seen before.48
Pf4-Grin1−/− MKs and platelets demonstrate defective cytoskeletal reorganization upon spreading
Motivated by a defect in PPF in Pf4-Grin1−/− mice, we sought to investigate the impact of the Grin1 knockout on MK cytoskeleton reorganization. Isolated MKs were allowed to spread on glass coverslips coated with collagen; cells were then fixed and immunostained for F-actin and α-tubulin, and image analysis was performed (Figure 5A-B). Compared with controls, Pf4-Grin1−/− MKs remained smaller (cell area was lower by 30%; Figure 5A-Bi) and more circular (Figure 5Bii), implying cells had reduced ability to spread and form cytoplasmic projections. Congruently, we saw fewer F-actin nodules in Pf4-Grin1−/− MKs (37% fewer per μm2 [Figure 5Biii] and 60% fewer per cell [Figure 5Biv]). These findings argue that impaired cytoskeletal rearrangements inhibited PPF in Pf4-Grin1−/− mice.

Impact of Grin1 deletion on platelet and MK spreading on either a collagen or fibrinogen matrix. (A-B) Morphology of MKs from Pf4-Grin1−/− and WT mice spread on glass coverslips coated with collagen. (A) Representative images of MKs stained for F-actin (red), α-tubulin (green), and Hoechst 33342 nuclear counterstain (blue). Red arrows indicate examples of F-actin nodules frequent in WT but not Pf4-Grin1−/− MKs. Green arrowheads point to the α-tubulin coil often maintained in Pf4-Grin1−/− MKs. (B) Bar graphs showing cell area (i), cell circularity (ii), F-actin nodule density per cell area (μm2) (iii), and numbers of F-actin nodules per cell (iv), quantified from fluorescence images shown in panel A using ImageJ. (C) Morphology of platelets from Pf4-Grin1−/− and WT mice spread on glass coverslips coated with fibrinogen. (C) Representative images of platelets activated with either 10 μM of ADP (i-ii) or 0.1 U/mL of thrombin (iii-iv) and stained for F-actin (red) and α-tubulin (green); red arrows point to F-actin nodules common in WT but not Pf4-Grin1−/− platelets (i-ii); green arrowheads point to deformed, collapsed, and centralized α-tubulin coil, and red arrowheads indicate peripheral stress fibers of F-actin (iv), both more frequent in WT but not Pf4-Grin1−/− platelets (iii); green arrows indicate partially maintained peripheral α-tubulin coil in Pf4-Grin1−/− platelets (iv). For panels A and C, 2 independent experiments were performed with a total of 5 biologic replicates per group. For panel B, 35 MKs were analyzed per group. All bar graphs show median ± 95% CI. Statistical significance is shown (Mann-Whitney U test).
Impact of Grin1 deletion on platelet and MK spreading on either a collagen or fibrinogen matrix. (A-B) Morphology of MKs from Pf4-Grin1−/− and WT mice spread on glass coverslips coated with collagen. (A) Representative images of MKs stained for F-actin (red), α-tubulin (green), and Hoechst 33342 nuclear counterstain (blue). Red arrows indicate examples of F-actin nodules frequent in WT but not Pf4-Grin1−/− MKs. Green arrowheads point to the α-tubulin coil often maintained in Pf4-Grin1−/− MKs. (B) Bar graphs showing cell area (i), cell circularity (ii), F-actin nodule density per cell area (μm2) (iii), and numbers of F-actin nodules per cell (iv), quantified from fluorescence images shown in panel A using ImageJ. (C) Morphology of platelets from Pf4-Grin1−/− and WT mice spread on glass coverslips coated with fibrinogen. (C) Representative images of platelets activated with either 10 μM of ADP (i-ii) or 0.1 U/mL of thrombin (iii-iv) and stained for F-actin (red) and α-tubulin (green); red arrows point to F-actin nodules common in WT but not Pf4-Grin1−/− platelets (i-ii); green arrowheads point to deformed, collapsed, and centralized α-tubulin coil, and red arrowheads indicate peripheral stress fibers of F-actin (iv), both more frequent in WT but not Pf4-Grin1−/− platelets (iii); green arrows indicate partially maintained peripheral α-tubulin coil in Pf4-Grin1−/− platelets (iv). For panels A and C, 2 independent experiments were performed with a total of 5 biologic replicates per group. For panel B, 35 MKs were analyzed per group. All bar graphs show median ± 95% CI. Statistical significance is shown (Mann-Whitney U test).
The cytoskeletal defect in MKs prompted us to also examine cytoskeletal rearrangements in platelets. Platelets were activated with either 10 μM of ADP or 0.1 U/mL of thrombin and allowed to adhere and spread on glass coverslips coated with fibrinogen. F-actin and α-tubulin were stained as in MKs; in addition, some preparations were sputter coated for scanning electron microscopy (Figure 5C; supplemental Figure 15). In the presence of ADP, WT platelets formed distinctive F-actin nodules (Figure 5Ci), and in the presence of thrombin, their microtubule coil collapsed (Figure 5Ciii). In contrast, Pf4-Grin1−/− platelets showed fewer F-actin nodules in the presence of ADP (Figure 5Cii) and more frequent preservation of the α-tubulin coil in the presence of thrombin (Figure 5Civ). Congruently, scanning electron microscopy demonstrated that Pf4-Grin1−/− platelets produced fewer spiky filopodia in the presence of ADP and spread less in the presence of thrombin (supplemental Figure 15ii,iv, respectively). Quantitative analysis of the cytoskeletal staining highlighted changes in the platelet area, aspect ratio, and circularity depending on the strength of activation (supplemental Figure 16). Taken together, these experiments identified crucial NMDAR contribution to cytoskeleton reorganization and cell shape change in adhering MKs and activated platelets.
Transcriptome analysis supports NMDAR involvement in PPF and matrix remodeling
To search for molecular pathways altered in MKs from Pf4-Grin1−/− mice, whole-transcriptome analysis was performed on isolated MKs and compared with WT MKs. An estimated 100 000 CD41+ MKs were isolated per strain using magnetic beads, and the gene expression profiles were tested using Clariom S Pico microarrays. Gene set enrichment analysis identified 79 gene ontology biologic processes and 56 Kyoto Encyclopedia of Genes and Genomes pathway gene sets that were differentially expressed between Pf4-Grin1−/− and WT MKs (selected terms are shown in Figure 6A; other results are provided in supplemental Tables 3 and 4; full data are provided in the data supplement).


Gene set enrichment analysis of WT and Pf4-Grin1−/− MK transcriptomes. (A) Bar graphs showing differential expression of the gene ontology (GO) biologic processes (i) and Kyoto Encyclopedia of Genes and Genomes pathways (ii) in Pf4-Grin1−/− MKs compared with WT MKs assayed with Clariom S Pico RNA microarray (n = 6 samples per strain). Upregulated pathways are shown in red and downregulated in green. Gene set enrichment analysis was performed using the WebGestalt online tool, and a gene set was considered enriched where the false discovery rate (FDR) adjusted P value was ≤.01. Selected enriched data sets are shown, listed in order of descending FDR. FDR values were transformed and are shown as −log10(FDR). (B-C) Schematics showing transcriptional changes in Pf4-Grin1−/− MKs affecting the phosphatidylinositol signaling system (mmu04070) (B) and inflammatory mediator regulation of transient receptor potential (TRP) channel (mmu04750) (C) pathways mapped with the R package Pathview. Upregulated genes are shown in red and downregulated in green, and genes not mapped from our data set are in gray. Abbreviations of deregulated molecules are provided. Other pathway details can be found through the following links: https://www.genome.jp/dbget-bin/www_bget?mmu04070 (for mmu04070 shown in panel B) and https://www.genome.jp/entry/mmu04750 (for mmu04750 shown in panel C). Molecules marked by numbers refer to a series of inositol, diacylglycerol, or lipid synthases, kinases, and phosphatases. Additional data are provided in supplemental Tables 3 and 4, data supplement, and under Gene Expression Omnibus accession number GSE183044. AC, adenylate cyclase; ASIC, acid-sensing ion channel; BK, kininogen; B1/B2, bradykinin receptors; CaM or CALM, calmodulin; EP, prostaglandin E receptor; GF, insulin-like growth factor; Gq and Gs, guanine nucleotide binding proteins; H1, histamine receptor; 5HTR, serotonin receptor; IL-1β, interleukin-1β; INPP4, inositol polyphosphate-4-phosphatase; p38/JNK, p38 MAP kinase; MKK3/6, MAP kinase kinase 3/6; NGF, nerve growth factor; P2YR, P2Y receptor; P450, cytochrome P450; PAR2, thrombin receptor-like 1; PI4K, phosphatidylinositol 4-kinase; PIK3C, phosphoinositide-3-kinase regulatory subunits; PIKFYVE, phosphoinositide kinase, FYVE type; PKC, protein kinase C; PLCβ, phospholipase Cβ; PP1, protein phosphatase 1; PTEN, phosphatase and tensin homolog; SHIP, inositol polyphosphate-5-phosphatase D; Src, tyrosine-protein kinase Src; TrkA, neurotrophic tyrosine kinase receptor; TRPA1, transient receptor potential cation channel subfamily A member 1; TRPM8, transient receptor potential cation channel subfamily M member 8; TRPV1-TRPV4, transient receptor potential cation channel subfamily V members 1-4.
Gene set enrichment analysis of WT and Pf4-Grin1−/− MK transcriptomes. (A) Bar graphs showing differential expression of the gene ontology (GO) biologic processes (i) and Kyoto Encyclopedia of Genes and Genomes pathways (ii) in Pf4-Grin1−/− MKs compared with WT MKs assayed with Clariom S Pico RNA microarray (n = 6 samples per strain). Upregulated pathways are shown in red and downregulated in green. Gene set enrichment analysis was performed using the WebGestalt online tool, and a gene set was considered enriched where the false discovery rate (FDR) adjusted P value was ≤.01. Selected enriched data sets are shown, listed in order of descending FDR. FDR values were transformed and are shown as −log10(FDR). (B-C) Schematics showing transcriptional changes in Pf4-Grin1−/− MKs affecting the phosphatidylinositol signaling system (mmu04070) (B) and inflammatory mediator regulation of transient receptor potential (TRP) channel (mmu04750) (C) pathways mapped with the R package Pathview. Upregulated genes are shown in red and downregulated in green, and genes not mapped from our data set are in gray. Abbreviations of deregulated molecules are provided. Other pathway details can be found through the following links: https://www.genome.jp/dbget-bin/www_bget?mmu04070 (for mmu04070 shown in panel B) and https://www.genome.jp/entry/mmu04750 (for mmu04750 shown in panel C). Molecules marked by numbers refer to a series of inositol, diacylglycerol, or lipid synthases, kinases, and phosphatases. Additional data are provided in supplemental Tables 3 and 4, data supplement, and under Gene Expression Omnibus accession number GSE183044. AC, adenylate cyclase; ASIC, acid-sensing ion channel; BK, kininogen; B1/B2, bradykinin receptors; CaM or CALM, calmodulin; EP, prostaglandin E receptor; GF, insulin-like growth factor; Gq and Gs, guanine nucleotide binding proteins; H1, histamine receptor; 5HTR, serotonin receptor; IL-1β, interleukin-1β; INPP4, inositol polyphosphate-4-phosphatase; p38/JNK, p38 MAP kinase; MKK3/6, MAP kinase kinase 3/6; NGF, nerve growth factor; P2YR, P2Y receptor; P450, cytochrome P450; PAR2, thrombin receptor-like 1; PI4K, phosphatidylinositol 4-kinase; PIK3C, phosphoinositide-3-kinase regulatory subunits; PIKFYVE, phosphoinositide kinase, FYVE type; PKC, protein kinase C; PLCβ, phospholipase Cβ; PP1, protein phosphatase 1; PTEN, phosphatase and tensin homolog; SHIP, inositol polyphosphate-5-phosphatase D; Src, tyrosine-protein kinase Src; TrkA, neurotrophic tyrosine kinase receptor; TRPA1, transient receptor potential cation channel subfamily A member 1; TRPM8, transient receptor potential cation channel subfamily M member 8; TRPV1-TRPV4, transient receptor potential cation channel subfamily V members 1-4.
The impact of NMDAR deletion on intracellular Ca2+ signaling was reflected by changes in the phosphatidylinositol signaling system, inositol phosphate metabolism,49 and inflammatory mediator regulation of TRP channels pathways16,43,50 (Figure 6A). A number of transcripts involved in phosphatidylinositol signaling were affected, including those encoding phospholipase Cβ (PLCβ), phosphatidylinositol kinases (eg, FYVE finger containing) and phosphatases (eg, of inositol polyphosphate), 1,2-diacyl-glycerol kinases, lipid phosphatases (eg, myotubularin-related proteins), protein kinase C, IP3Rs, and phosphatidylinositol-3-kinase (Figure 6B; data supplement). Transcripts encoding TRP canonical (TRPC) channels TRPC1 and TRPC6 were the most highly expressed in both WT and Pf4-Grin1−/− MKs, consistent with previous reports.14,51,52Trpc1 transcripts were mildly upregulated in Pf4-Grin1−/− MKs (39% increase). Expression of other Trp genes was similar, but gene set enrichment analysis revealed deregulated transcription linking NMDAR with TRP vanilloid (TRPV1-TRPV4), ankyrin (TRPA1) and melastatin (TRPM8) receptors, and inflammatory-type signaling engaging arachidonate lipoxygenases, mitogen-activated protein kinases, and adenylate cyclase (Figure 6C; data supplement).
Consistent with reduced differentiation of Pf4-Grin1−/− MKs and impaired platelet function, differential expression was identified in the terms chromosome segregation, DNA replication, hematopoietic cell lineage, and platelet activation (Figure 6Ai-ii). In keeping with the defect in PPF, changes were seen in the terms cell-substrate adhesion, cell adhesion molecules, integrin-mediated signaling, actin filament organization, tube formation, and dendrite development (Figure 6Ai-ii). In support, NMDAR is required for the actin reorganization underlying dendritic spine formation in neurons, which bears similarities to PPF.53 Several other regulatory pathways were identified to be disturbed in the Kyoto Encyclopedia of Genes and Genomes data set, including TP53, Wnt, Ras-proximate-1 (RAP1), and Ras (Figure 6Aii), highlighting the widespread impact of NMDAR activity on MK signaling.
We then checked expression of selected molecules known to be involved in MK-ECM interaction and remodeling (Figure 7A).54 Transcripts for certain crucial ECM elements (eg, collagen type 1 [Col1], fibronectin 1 [Fn1], lumican [Lum], secreted protein acidic and cysteine rich [Sparc], and decorin [Dcn]) and ECM-remodeling enzymes (eg, metalloproteinase 2 [Mmp2], Mmp14, Mmp16, and lysyl oxidase [Lox]) were lower in Pf4-Grin1−/− MKs, suggesting reduced capability to remodel ECM (Figure 7A). Real-time RT-PCR was used to validate deregulated expression of selected genes (Col1a1, Sparc, Fn1, Dcn, Mmp2, and Mmp14), which confirmed that microarray and quantitative RT-PCR data were directionally matched (Figure 7B).
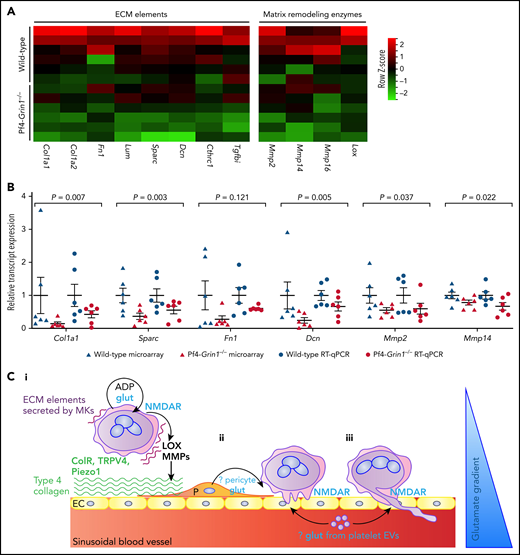
Transcriptional evidence for NMDAR involvement in matrix remodeling and a model of the NMDAR role in PPF. (A) Heat map highlighting differential expression of transcripts for selected ECM and matrix remodeling genes in Pf4-Grin1−/− MKs compared with WT MKs. Microarray data are shown after z score transformation. (B) Scatterplot showing relative transcript levels of selected matrix remodeling genes detected using Clariom S Pico microarray and by quantitative RT-PCR (RT-qPCR) in Pf4-Grin1−/− MKs calculated relative to WT MKs (mean ± SEM). Six independent experiments were performed, with a total of 6 biologic replicates per group. Microarray and quantitative PCR data were analyzed using a 2-tailed Student t test; the statistical evidence for each gene was then combined using the Stouffer method for meta-analysis. (C) Hypothetic model of glutamate-NMDAR role in PPF. In maturing MKs, glutamate acting through NMDAR enhances ADP effects on migration and adhesion and supports expression of ECM elements (eg, collagen and fibronectin) and ECM remodeling enzymes (eg, LOX and MMPs). Integrins and mechanosensitive channels (ColR, TRPV4, and Piezo1) detect permissive ECM (eg, type 4 collagen and softer matrices) and induce PPF (Ci). (Cii-iii) Glutamate provides additional localizing signals to guide podosomes and proplatelets inside BM sinusoids along the glutamate gradient. Possible sources of glutamate in the vascular niche include perisinusoidal pericytes and platelet extracellular vesicles (EVs). Col1 a1 and a2, collagen type 1 a1 and a2; ColR, collagen receptors; Cthrc1, collagen triple helix repeat containing 1; Dcn, decorin; EC, endothelial cell; Fn1, fibronectin 1; LOX, lysyl oxidase; P, pericyte; Sparc, secreted protein acidic and cysteine rich; Tgfbi, transforming growth factor β induced.
Transcriptional evidence for NMDAR involvement in matrix remodeling and a model of the NMDAR role in PPF. (A) Heat map highlighting differential expression of transcripts for selected ECM and matrix remodeling genes in Pf4-Grin1−/− MKs compared with WT MKs. Microarray data are shown after z score transformation. (B) Scatterplot showing relative transcript levels of selected matrix remodeling genes detected using Clariom S Pico microarray and by quantitative RT-PCR (RT-qPCR) in Pf4-Grin1−/− MKs calculated relative to WT MKs (mean ± SEM). Six independent experiments were performed, with a total of 6 biologic replicates per group. Microarray and quantitative PCR data were analyzed using a 2-tailed Student t test; the statistical evidence for each gene was then combined using the Stouffer method for meta-analysis. (C) Hypothetic model of glutamate-NMDAR role in PPF. In maturing MKs, glutamate acting through NMDAR enhances ADP effects on migration and adhesion and supports expression of ECM elements (eg, collagen and fibronectin) and ECM remodeling enzymes (eg, LOX and MMPs). Integrins and mechanosensitive channels (ColR, TRPV4, and Piezo1) detect permissive ECM (eg, type 4 collagen and softer matrices) and induce PPF (Ci). (Cii-iii) Glutamate provides additional localizing signals to guide podosomes and proplatelets inside BM sinusoids along the glutamate gradient. Possible sources of glutamate in the vascular niche include perisinusoidal pericytes and platelet extracellular vesicles (EVs). Col1 a1 and a2, collagen type 1 a1 and a2; ColR, collagen receptors; Cthrc1, collagen triple helix repeat containing 1; Dcn, decorin; EC, endothelial cell; Fn1, fibronectin 1; LOX, lysyl oxidase; P, pericyte; Sparc, secreted protein acidic and cysteine rich; Tgfbi, transforming growth factor β induced.
Discussion
This study provides the first in vivo evidence of the role of NMDAR function in platelets and MKs. We found that compared with WT mice, Pf4-Grin1−/− mice had lower platelet counts, longer bleeding time, and slower platelet recovery in an antibody-induced model of thrombocytopenia. Ex vivo, Pf4-Grin1−/− platelets showed impaired activation with defective filopodia formation, and Pf4-Grin1−/− MKs produced fewer colonies and fewer proplatelets. Impaired cytoskeletal reorganization was identified as the most direct mechanism underlying abnormal platelet function and production in Pf4-Grin1−/− mice. MK transcriptome analysis supported NMDAR contribution toward Ca2+ signaling and ECM remodeling. Our data identify NMDAR as an important regulator of platelet function and PPF.
Our earlier work demonstrated that NMDAR antagonists inhibit platelet function ex vivo.24,25 Congruently, this study shows that Pf4-Grin1−/− mice have prolonged tail bleeding time, and Pf4-Grin1−/− platelets have reduced ability to adhere and spread over the fibrinogen matrix. We believe that the defect in matrix sensing and related cytoskeletal reorganization represent the main cause of impaired hemostasis in Pf4-Grin1−/− mice. In support, others have found that exogenous glutamate instigates platelet spreading and aggregation on immobilized matrices under flow conditions.55 Our data highlight the role of NMDAR in platelet production. Pf4-Grin1−/− mice have lower platelet counts and slower platelet production rates in vivo, along with reduced MK colony formation and PPF ex vivo. Pf4-Grin1−/− MKs show impaired ability to adhere to collagen matrices and reduced cytoskeletal rearrangements. Gene expression profiling adds evidence that NMDAR regulates expression of molecules involved in MK adhesion and ECM remodeling.
We provide novel insights into the role of NMDAR in platelet Ca2+ signaling. Similar to endothelial cells and astrocytes,22,41,42 platelet NMDAR may act in a metabotropic-like (flux-independent) manner. Further characterization of this response is required in platelets and MKs, including use of additional controls (eg, IP3R and PLCβ inhibitors) and elucidation of the underlying mechanism and downstream signaling. We saw no obvious evidence that NMDAR constitutively regulates intracellular Ca2+ homeostasis in platelets; nevertheless, this cannot be excluded. Recent work uncovered a direct link between the GluN2 and STIM proteins in neurons.44 It is prudent to look for similar interactions in platelets and MKs.
ADP is an established regulator of platelet cell shape change, MK adhesion, and PPF16,56,57; we show that NMDAR is also involved in these processes. ADP and glutamate are both released from activated platelets, as well as constitutively from maturing MKs,40,56,58 setting a scene for cooperative signaling. Upon binding to its metabotropic P2Y1 and P2Y13 receptors, ADP acts through PLCβ to increase intracellular Ca2+ levels in platelets and MKs.16,57 Neuronal NMDAR can also act through PLCβ to regulate actin reorganization during dendritic spine formation.59-61 Two of our findings support cross-talk between ADP and NMDAR signaling in platelets and MKs: (1) NMDA increases ADP-mediated intracellular Ca2+ responses in platelets by up to 24%, and (2) PLC transcription is upregulated in Pf4-Grin1−/− MKs, implying compensation by other pathways, particularly those ADP mediated.16 These findings suggest that NMDAR in platelets and MKs acts to enhance cellular effects of endogenous ADP. A similar phenomenon was recently demonstrated for the KCa1.1 calcium- and voltage-activated potassium channel, but in the opposite direction.62 KCa1.1 agonists reduce intracellular Ca2+ levels in ADP-stimulated MKs; therefore, it was proposed that KCa1.1 inhibits PPF through reducing MK sensitivity to ADP.62
In the BM microenvironment, ECM is mainly composed of fibrillar collagen, of which type 1 is pervasively distributed, and type 4 is more abundant around the sinusoids.54,63-65 Type 1 collagen inhibits and type 4 supports PPF,65-67 but even more than the type of collagen, stiff ECM inhibits and soft ECM induces PPF.18,48,68 The level of ECM stiffness is controlled by the balance between the type and abundance of ECM elements and their cross-linking and degradation. MKs contribute to this balance by secreting their own ECM elements (eg, type 4 collagen and fibronectin),54 ECM cross-linking enzymes (eg, LOX),69 and ECM degrading enzymes (eg, MMPs).70 We found that expression of all these molecules was lower in Pf4-Grin1−/− MKs, suggesting reduced ability of MKs to modulate their immediate BM microenvironment. Our transcriptional data point to a link between NMDAR, TRP channels, and inflammatory signaling involving TRPV1-TRPV4, TRPA1, and TRPM8. TRPV4 is an important mechanosensitive channel in MKs18 and was recently proposed to link mechanosensation with immune responses in immune cells.71 TRPV2,51 TRPV4,18 and TRPA172 are expressed in MK cell lines and TRPV172 in human platelets. Our findings raise the possibility that integrated function of NMDAR and TRP channels modulates inflammatory signaling in MKs, which may affect the BM microenvironment,73,74 including development of fibrosis.75
Other nonneuronal NMDARs in cartilage and kidney may also regulate tissue remodeling.76,77 Intriguingly, in a mouse model of ureter obstruction, NMDAR overactivation leads to renal fibrosis, and NMDAR inhibitors counteract this effect.78 In primary myelofibrosis (PMF), MKs overexpress LOX and show stronger adhesion to collagen than normal MKs.79 MKs derived from patients with calreticulin mutations display spontaneous activation of SOCE, which increases MK proliferation.80,81 SOCE inhibition reverses MK proliferation, implying that targeting abnormal Ca2+ signaling may be useful in myeloproliferative neoplasms.81 Our work demonstrates that NMDAR participates in a number of mechanisms relevant to PMF pathophysiology, including Ca2+ and ADP signaling, inflammatory responses, MK-ECM interactions, and ECM remodeling. Therefore, NMDAR inhibitors should be tested in PMF models.
Our results suggest that NMDAR in MKs helps link ECM sensing with cytoskeletal rearrangements. Other MK molecules with similar functions include mechanosensitive cation channels (eg, TRPV4 and Piezo1)17,18 and collagen receptors (eg, integrin α2β1 and GPVI).82 TRPV4 and Piezo1 sense matrix softness and support PPF through increased Ca2+ influx.17,18 Integrin α2β1 and GPVI bind type 1 collagen, which inhibits PPF primarily through Syk-independent GPVI signaling.65,83 However, both integrin α2β1 and GPVI are dispensable for PPF, indicating that other compensatory signaling pathways and receptors also regulate thrombopoiesis.84 Neuronal NMDAR is mechanosensitive85 and interacts with integrins86 and thus may be involved in direct matrix sensing in MKs. However, an important difference between NMDAR and other mechanosensitive channels is that NMDAR is primarily regulated by ligands, particularly glutamate.20 The functional glutamate-NMDAR axis in MKs, proven genetically in this work, offers the potential to provide spatiotemporal control over PPF. Neuroscience provides important clues as to how mechanotransduction can synergize with chemical (glutamate) signals to guide PPF in vivo. Using cultures of retinal ganglion cells, it was found that neuronal axons grow and splay projections toward softer tissue.87 This pattern of growth is beneficial in regions where axons have to search for their targets to form synapses guided by biochemical signals. Softer matrices seem better suited to support a cross-talk between mechanical and chemical signaling during axon pathfinding.87 We believe a similar situation may apply during PPF and propose the following model of NMDAR contribution to PPF in vivo (Figure 7C). In maturing MKs, NMDAR enhances ADP signaling and assists matrix remodeling through secretion of ECM elements (eg, collagen and fibronectin) and ECM remodeling enzymes (eg, MMPs and LOX). Mechanosensitive channels (integrins, TRPV4, and Piezo1) sense softer matrices, which induces PPF. Then, NMDAR provides additional spatiotemporal guidance to direct proplatelets inside blood vessels along the glutamate gradient. Sources of glutamate in the vascular niche remain unknown. Possibilities include that perisinusoidal pericytes and platelet extracellular vesicles deliver pulses of glutamate to MKs (Figure 7C). In support, brain pericytes secrete glutamate.88 Platelets also have the machinery to secrete glutamate,89 and glutamate elicits extensive shedding of extracellular vesicles from activated platelets.55
In conclusion, our findings from Pf4-Grin1−/− mice confirm previous pharmacologic data that NMDAR assists platelet function and MK maturation. We provide the first genetic evidence that platelet NMDAR strengthens Ca2+ response to ADP and regulates cytoskeletal reorganization upon platelet contact with matrix. In MKs, NMDAR regulates PPF through a mechanism that links MK-ECM interactions with cytoskeletal dynamics. Our findings implicate the glutamate-NMDAR axis in the localized control of PPF in vivo. NMDAR is amenable to pharmacologic modulation; many inhibitors are already available for applications in neuroscience, and some are in clinical use.90 This provides an opportunity for rapid testing of NMDAR inhibitors in disease models, including those of thrombosis and PMF.
Acknowledgments
The authors thank the staff of the Vernon Jansen Animal Facility who supported animal work, especially Andrew Brown, facility manager, who organized importation of the Pf4-Cre and Grin1-loxP mouse strains and supported colony management; Stephen Edgar and Jacqueline Ross, Biomedical Imaging Research Unit, who helped with flow cytometry and imaging, respectively; Clare Gebbie, Auckland Genomics Facility, for performing gene expression arrays; Radha Gorantla and Soakimi Pouhila, LabPlus Coagulation Section, who helped with platelet aggregation; Margaret Hammond, Marion Lyne, and Rajeshwari Nair, LabPlus Haematology, who supported quality control of our full blood count analyzers; Daniela Naumann, Bender Laboratory, who provided excellent technical assistance with tissue processing for histology and electron microscopy; and Elizabeth C. Ledgerwood for sharing her megakaryocyte culture methods and reviewing the manuscript prior to submission.
This worked was funded by grants from the Faculty of Medical and Health Sciences Research Development Fund (M.L.K.-Z.), grants 1115012 and 1119009 from the Auckland Medical Research Foundation (M.L.K.-Z.), and grant UoA 3720536 from the Christchurch Bone Marrow Cancer Research Trust (M.L.K.-Z.). J.I.H. received a scholarship from the Norman Family (M.L.K.-Z.), supplemented by payments from the Marijana Kumerich Trust (S.K.B.). M.B. is supported by grants BE5084/5-1 and TR240 (project 374031971) from the Deutsche Forschungsgemeinschaft. E.C.J. was supported by a fellowship from the Lorenzo and Pamela Galli Charitable Trust.
Authorship
Contribution: J.I.H. and T.N.G. generated most of the data, analyzed results, and wrote the manuscript; C.L.H., J.B., and R.C.P. generated and analyzed data; M.B. and E.C.J. helped generate and analyze data and edited the manuscript; N.K. helped analyze and interpret array data; S.K.B. contributed scholarship funding for J.I.H. and edited the manuscript; and M.L.K.-Z. designed and funded the research, provided supervision of staff and students, helped analyze and interpret data, and wrote the paper.
Conflict-of-interest disclosure: The authors declare no competing financial interests.
Correspondence: Maggie L. Kalev-Zylinska, Department of Molecular Medicine and Pathology, School of Medical Sciences, University of Auckland, 85 Park Rd, Grafton, Auckland 1023, New Zealand; e-mail: m.kalev@auckland.ac.nz.
The data reported in this article have been deposited in the Gene Expression Omnibus database (accession number GSE183044).
The data generated and analyzed in this study are available from the corresponding author on reasonable request.
The online version of this article contains a data supplement.
The publication costs of this article were defrayed in part by page charge payment. Therefore, and solely to indicate this fact, this article is hereby marked “advertisement” in accordance with 18 USC section 1734.

This feature is available to Subscribers Only
Sign In or Create an Account Close Modal