

Key Points
B-cell commitment into PBs activates PIM2 via STAT3, which promotes G1/S transition and inhibits caspase 3–driven apoptosis.
PC survival requires strong expression of PIM2 and its inhibition exhibits a synergistic effect with MCL1-inhibitor in myeloma.

Abstract
The differentiation of B cells into plasmablasts (PBs) and then plasma cells (PCs) is associated with extensive cell reprogramming and new cell functions. By using specific inhibition strategies (including a novel morpholino RNA antisense approach), we found that early, sustained upregulation of the proviral integrations of Moloney virus 2 (PIM2) kinase is a pivotal event during human B-cell in vitro differentiation and then continues in mature normal and malignant PCs in the bone marrow. In particular, PIM2 sustained the G1/S transition by acting on CDC25A and p27Kip1 and hindering caspase 3–driven apoptosis through BAD phosphorylation and cytoplasmic stabilization of p21Cip1. In PCs, interleukin-6 triggered PIM2 expression, resulting in antiapoptotic effects on which malignant PCs were particularly dependent. In multiple myeloma, pan-PIM and myeloid cell leukemia-1 (MCL1) inhibitors displayed synergistic activity. Our results highlight a cell-autonomous function that links kinase activity to the newly acquired secretion ability of the PBs and the adaptability observed in both normal and malignant PCs. These findings should finally prompt the reconsideration of PIM2 as a therapeutic target in multiple myeloma.
Introduction
Before becoming plasma cells (PCs), the B cells first pass through an immature, proliferative plasmablast (PB) stage. The PBs emerge after major changes in B-cell morphology, epigenome-sustained expression profile, and life span.1,2 This tightly regulated cell metamorphosis can be hijacked by oncogenic alterations that drive malignant transformation. Although there is a large body of data on normal B-cell differentiation, studies of B-cell malignancies have shown that our understanding of normal B-cell function is incomplete,3 in particular for identifying specific factors and determining their spatiotemporal involvement in the molecular modifications underlying B-cell metamorphosis.
We have reported that the emergence of human PBs is associated with large-scale methylome modifications, with the local acquisition of active epigenetic marks on PC identity genes during a committal step in which some activated B cells differentiate into PBs.4 These highly proliferative, activated, committed B cells (hereafter referred to as preplasmablasts [prePBs]) are characterized by the silencing of the interleukin-4 (IL-4)/STAT6 pathway and thus downregulation of CD23 surface marker expression.5 By focusing on this feature, a comparative RNA sequencing (RNA-seq) analysis of prePBs allowed us to identify here a striking increase in expression of the gene encoding the proviral integrations of Moloney virus 2 (PIM2) serine/threonine kinase. The 3 members of the PIM kinase family are known to phosphorylate numerous substrates involved in crucial cellular functions.6 Dysregulated expression of PIM kinases has been reported in several cancers, including multiple myeloma (MM).7,8 Surprisingly, PIM2 has never been analyzed in the context of normal B-cell differentiation. In mouse pro–B cells, Pim2 expression depends on growth factor–induced transcription,9,10 which justifies further research in the context of PC differentiation.
The present study evaluated the effects of PIM2 on PB generation and PC survival. We found that the B-cell commitment activates the transcription of PIM2 in a STAT3-dependent manner, which leads to a strong increase in the protein’s expression level and functional activity. We assessed the biological effects of PIM2 in primary B cells by comparing a normal culture with 2 conditions in which the functions of PIM2 were altered by either stopping gene expression or blocking kinase activity. Along with PIM2-mediated BAD phosphorylation, we detected effects on p21Cip1, CDC25A, and p27Kip1. During the final step in differentiation, these effects all promote cell survival and entry into the S phase of the cell cycle. Moreover, PIM2 was found to be strongly expressed in quiescent mature PCs and essential for cell survival. In a malignant setting, PCs are addicted to PIM2, and targeting this kinase was synergistic with BH3 mimetics, offering new treatment options for MM.
Methods
Purification of primary B cells, cell culture, cell cycle assessment, immunophenotyping, cell sorting, and protein assays
Procedures and methods are detailed in the supplemental Methods (available on the Blood Web site).
Cell line culture and viability assays
Human myeloma cell lines were obtained and cultured as described previously.11 Viability was assessed for cells treated with selected compounds: AZD1208 and AZD5991 (Selleck Chemicals). CellTiter-Glo Luminescent Assay kit (Promega) was used as described by the manufacturer. Results were normalized to the samples without treatment, and synergy scores were calculated by using the Bliss method12 as described by Combès et al.13
Primary MM cells
Samples were collected with the approval of the institutional research board from Rennes University Hospital and in accordance with the Declaration of Helsinki. Mononuclear cells were isolated by using Ficoll density gradient centrifugation. Samples were cultured in the presence of 2 ng/mL of IL-6. Cell cytotoxicity was evaluated by using flow cytometry to determine the percentage of viable CD138+ cells.
Splice-switching antisense oligonucleotide experiments
Inhibition of PIM2 expression is enabled by the use of a vivo-morpholino PIM2 splice-switching antisense oligonucleotide (SSO-PIM2) from Gene Tools, LLC. An irrelevant vivo-morpholino standard oligonucleotide was used as control (SSO-CTL). PIM2 messenger RNA (mRNA) knockdown efficiency was evaluated by reverse transcription polymerase chain reaction (RT-PCR) to simultaneously identify full-length (286 pb) and alternatively spliced (176 bp) PIM2 mRNAs on an agarose gel. Quantification of inhibition was also performed by quantitative RT-PCR with exon 2 targeting primers and verified at the protein level by immunoblot.
RNA-seq, assay for transposase-accessible chromatin sequencing, and data accessibility
Procedures and analysis methods have been described previously.5
Results
The emergence of PIM2 expression during PB commitment
To identify genes regulated specifically during the final commitment step, we used our previously described in vitro differentiation model with human naive B cells generating 4 cell populations on day 6 (D6) (Figure 1A).14 The RNA-seq data (confirmed by quantitative PCR assays) revealed a striking elevation of PIM2 mRNA expression (but not PIM1 or PIM3 expression) in prePBs (P2/CD23– population) and PBs (P1 population), relative to B cells diverted from differentiation (P2/CD23+ and P3 populations) (Figure 1B; supplemental Figure 1A). In an unsupervised analysis, the results of single-cell quantitative RT-PCRs in P2/CD23– vs P2/CD23+ cell populations ranked PIM2 as the most discriminating gene, ahead of PRDM1 (Figure 1C; supplemental Figure 1B). Analysis of our RNA-seq data sets showed that PIM2 was in the top 150 genes characterizing PBs, relative to noncommitted B-cell populations (supplemental Figure 1C).5 The protein levels correlated perfectly with gene expression levels, with strong PIM2 expression in prePBs and PBs (Figure 1B). With regard to human tonsil-derived cell populations, CD19+IgD–CD38bright PBs expressed higher levels of PIM2 than other B-cell populations (Figure 1D).
![PIM2 expression and regulation during normal B-cell differentiation. (A) Using a 2-step cell culture process, VPD-labeled naive B cells (NBCs) were differentiated into the cell populations P1, P2, and P3. P2 cells were subdivided into P2/CD23+ and P2/CD23– subsets. The PB P1 population arose from the P2/CD23– subset. (B) Left: PIM2 RNA-seq results on D4 or day 5 (D5) in the various cell populations. Data are presented as the mean ± SD, n = 3. Right: PIM2 mRNA expression in the various cell populations on D6. mRNA data are presented as the median (range); n = 6. Bottom, PIM2 protein expression in all cell populations, from day 0 (D0) to D6. (C) A single-cell quantitative RT-PCR heat map of the expression of 31 genes in P2/CD23– vs P2/CD23+ cell subsets; the red arrow indicates PIM2 mRNA expression. (D) PIM2 mRNA expression (top) and protein expression (bottom) in different tonsil-derived B-cell populations. mRNA data are presented as the median (range), n = 7. (E) The Integrative Genomic Viewer genome browser window, showing several features around the PIM2 locus. Colored tracks at the top are our RNA-seq and ATAC-seq data.5 ATAC-seq showed that the open regions included the PIM2 promoter and an upstream enhancer that physically interact together. ATAC-seq regions close to PIM2 comprise transcription factor–binding sites for relevant factors such as STAT3, according to ENCODE data, and also BACH2, including one we have identified by chromatin immunoprecipitation.17 5hmC marks are identified in ATAC-seq regions and the body of the PIM2 sequence in PBs.4 Details are provided in supplemental Figure 2A. (F) Levels of BACH2 and PIM2 mRNA expression (left) and protein expression (right) in D4lo cells after transfection with siBACH2 on day 2 (D2). mRNA data are presented as the mean ± SD, n = 4. (G) On D5, PBs were sorted, starved, and then stimulated with the indicated cytokines. Left: PIM2 mRNA expression after 4 hours (pink) and 16 hours (red). For each time point, the results were normalized against the nonstimulated condition (set arbitrarily to 1 [in gray]). mRNA data are presented as the mean ± SD, n = 5. Right: PIM2, pSTAT3 and pSTAT5 protein expression after 16 hours. (H) On D5, PBs were sorted, starved, and then treated with increasing doses of a STAT3 inhibitor (Stat3i) 1 hour before the addition of IL-10. PIM2 mRNA expression (left) and protein expression (right) were assessed 4 hours after the addition of IL-10. mRNA data are presented as the mean ± SD, n = 5. (I) Regulation of PIM2 expression during B-cell differentiation. At the start of B-cell differentiation and despite the open chromatin on the promoter and on other regulatory regions, PIM2 expression is constrained by BACH2. BACH2 expression then declines throughout the differentiation process, whereas T follicular helper–driven molecules stimulate STAT3 signaling. Both events promote the burst in PIM2 expression in cells committed to differentiation into PBs. Statistical significance was evaluated by using the Mann-Whitney U test (panels C, F, G, and H) or the Kruskal-Wallis test (panel H). *P < .05, **P < .01, ***P < .001. CpG, cytosine guanine dinucleotide; GC, germinal center; IgM, immunoglobulin M; MBC, memory B cell; ns, not significant; siCTL, small interference (si) RNA control (CTL); TFs, transcription factors; VPD, violet cell proliferation dilution. Further details are presented in supplemental Figure 1.](https://ash.silverchair-cdn.com/ash/content_public/journal/blood/139/15/10.1182_blood.2021014011/4/m_bloodbld2021014011f1a.png?Expires=1769080323&Signature=W2exyqYl-6dxQif2vdSYLr2FMNycoGpQYXTznsCpgcOBfXH~AxFevY-e5YfDoo~ExcQyzJNTUUXgPfQMmUcvi-LLNLlumW8NK6OS96YH4JRNkoEp6wcWR~RREE9rK8jksfDhkvaQP1eFyzabh2BXMp4wgqBJJnrgYNgTrZDZ~xa-mVsmf~2IptIwcCmGEBdH1mJO-h0Nf5K0a1BpsPm~PzK9Ii9qrXglSOXbbHNchq8AlIwfAHPPRsCZfHBiNTtKLJChfMRH1paHmaQRkRH09hNEEv9URw-ymJkZKJgh6zfzdOJOs4TCULwy-LkyHTxfouM41EB4t3PBIz9mXvBCtQ__&Key-Pair-Id=APKAIE5G5CRDK6RD3PGA)
![PIM2 expression and regulation during normal B-cell differentiation. (A) Using a 2-step cell culture process, VPD-labeled naive B cells (NBCs) were differentiated into the cell populations P1, P2, and P3. P2 cells were subdivided into P2/CD23+ and P2/CD23– subsets. The PB P1 population arose from the P2/CD23– subset. (B) Left: PIM2 RNA-seq results on D4 or day 5 (D5) in the various cell populations. Data are presented as the mean ± SD, n = 3. Right: PIM2 mRNA expression in the various cell populations on D6. mRNA data are presented as the median (range); n = 6. Bottom, PIM2 protein expression in all cell populations, from day 0 (D0) to D6. (C) A single-cell quantitative RT-PCR heat map of the expression of 31 genes in P2/CD23– vs P2/CD23+ cell subsets; the red arrow indicates PIM2 mRNA expression. (D) PIM2 mRNA expression (top) and protein expression (bottom) in different tonsil-derived B-cell populations. mRNA data are presented as the median (range), n = 7. (E) The Integrative Genomic Viewer genome browser window, showing several features around the PIM2 locus. Colored tracks at the top are our RNA-seq and ATAC-seq data.5 ATAC-seq showed that the open regions included the PIM2 promoter and an upstream enhancer that physically interact together. ATAC-seq regions close to PIM2 comprise transcription factor–binding sites for relevant factors such as STAT3, according to ENCODE data, and also BACH2, including one we have identified by chromatin immunoprecipitation.17 5hmC marks are identified in ATAC-seq regions and the body of the PIM2 sequence in PBs.4 Details are provided in supplemental Figure 2A. (F) Levels of BACH2 and PIM2 mRNA expression (left) and protein expression (right) in D4lo cells after transfection with siBACH2 on day 2 (D2). mRNA data are presented as the mean ± SD, n = 4. (G) On D5, PBs were sorted, starved, and then stimulated with the indicated cytokines. Left: PIM2 mRNA expression after 4 hours (pink) and 16 hours (red). For each time point, the results were normalized against the nonstimulated condition (set arbitrarily to 1 [in gray]). mRNA data are presented as the mean ± SD, n = 5. Right: PIM2, pSTAT3 and pSTAT5 protein expression after 16 hours. (H) On D5, PBs were sorted, starved, and then treated with increasing doses of a STAT3 inhibitor (Stat3i) 1 hour before the addition of IL-10. PIM2 mRNA expression (left) and protein expression (right) were assessed 4 hours after the addition of IL-10. mRNA data are presented as the mean ± SD, n = 5. (I) Regulation of PIM2 expression during B-cell differentiation. At the start of B-cell differentiation and despite the open chromatin on the promoter and on other regulatory regions, PIM2 expression is constrained by BACH2. BACH2 expression then declines throughout the differentiation process, whereas T follicular helper–driven molecules stimulate STAT3 signaling. Both events promote the burst in PIM2 expression in cells committed to differentiation into PBs. Statistical significance was evaluated by using the Mann-Whitney U test (panels C, F, G, and H) or the Kruskal-Wallis test (panel H). *P < .05, **P < .01, ***P < .001. CpG, cytosine guanine dinucleotide; GC, germinal center; IgM, immunoglobulin M; MBC, memory B cell; ns, not significant; siCTL, small interference (si) RNA control (CTL); TFs, transcription factors; VPD, violet cell proliferation dilution. Further details are presented in supplemental Figure 1.](https://ash.silverchair-cdn.com/ash/content_public/journal/blood/139/15/10.1182_blood.2021014011/4/m_bloodbld2021014011f1b.png?Expires=1769080323&Signature=yoluSFcJPki3il4UJbsNQ02MOWnnMVO2UStUj4lowIU5S2i4uJjx7c64-cDaOUsLBiISzIldnpDUMbsoIAdwQDiAYLOZMJm5HK4BXurPBrV8gE85Bcw7mVMnj6gMX8dUO8osajZmgYMfOG5DU8RBUINqgEzQ5~w6fIElwM5ZQ-ieQ3vNC4sJjTRUT2wXT7mfYp2KgnCC7sdmpKvpeKBoTgvzeM6xH9F-5r9Mk~i1OTMn82elDW-HuTXYZBc-WQk~kMQzSlweHx4msc67PC5M8qNc5uZuksOfoLLX7BVxFnRK8hBlq5WsvfkL4QgvSb18O-dIGyEsn84VfTKJhwk6ag__&Key-Pair-Id=APKAIE5G5CRDK6RD3PGA)
PIM2 expression and regulation during normal B-cell differentiation. (A) Using a 2-step cell culture process, VPD-labeled naive B cells (NBCs) were differentiated into the cell populations P1, P2, and P3. P2 cells were subdivided into P2/CD23+ and P2/CD23– subsets. The PB P1 population arose from the P2/CD23– subset. (B) Left: PIM2 RNA-seq results on D4 or day 5 (D5) in the various cell populations. Data are presented as the mean ± SD, n = 3. Right: PIM2 mRNA expression in the various cell populations on D6. mRNA data are presented as the median (range); n = 6. Bottom, PIM2 protein expression in all cell populations, from day 0 (D0) to D6. (C) A single-cell quantitative RT-PCR heat map of the expression of 31 genes in P2/CD23– vs P2/CD23+ cell subsets; the red arrow indicates PIM2 mRNA expression. (D) PIM2 mRNA expression (top) and protein expression (bottom) in different tonsil-derived B-cell populations. mRNA data are presented as the median (range), n = 7. (E) The Integrative Genomic Viewer genome browser window, showing several features around the PIM2 locus. Colored tracks at the top are our RNA-seq and ATAC-seq data.5 ATAC-seq showed that the open regions included the PIM2 promoter and an upstream enhancer that physically interact together. ATAC-seq regions close to PIM2 comprise transcription factor–binding sites for relevant factors such as STAT3, according to ENCODE data, and also BACH2, including one we have identified by chromatin immunoprecipitation.17 5hmC marks are identified in ATAC-seq regions and the body of the PIM2 sequence in PBs.4 Details are provided in supplemental Figure 2A. (F) Levels of BACH2 and PIM2 mRNA expression (left) and protein expression (right) in D4lo cells after transfection with siBACH2 on day 2 (D2). mRNA data are presented as the mean ± SD, n = 4. (G) On D5, PBs were sorted, starved, and then stimulated with the indicated cytokines. Left: PIM2 mRNA expression after 4 hours (pink) and 16 hours (red). For each time point, the results were normalized against the nonstimulated condition (set arbitrarily to 1 [in gray]). mRNA data are presented as the mean ± SD, n = 5. Right: PIM2, pSTAT3 and pSTAT5 protein expression after 16 hours. (H) On D5, PBs were sorted, starved, and then treated with increasing doses of a STAT3 inhibitor (Stat3i) 1 hour before the addition of IL-10. PIM2 mRNA expression (left) and protein expression (right) were assessed 4 hours after the addition of IL-10. mRNA data are presented as the mean ± SD, n = 5. (I) Regulation of PIM2 expression during B-cell differentiation. At the start of B-cell differentiation and despite the open chromatin on the promoter and on other regulatory regions, PIM2 expression is constrained by BACH2. BACH2 expression then declines throughout the differentiation process, whereas T follicular helper–driven molecules stimulate STAT3 signaling. Both events promote the burst in PIM2 expression in cells committed to differentiation into PBs. Statistical significance was evaluated by using the Mann-Whitney U test (panels C, F, G, and H) or the Kruskal-Wallis test (panel H). *P < .05, **P < .01, ***P < .001. CpG, cytosine guanine dinucleotide; GC, germinal center; IgM, immunoglobulin M; MBC, memory B cell; ns, not significant; siCTL, small interference (si) RNA control (CTL); TFs, transcription factors; VPD, violet cell proliferation dilution. Further details are presented in supplemental Figure 1.
PIM2 expression and regulation during normal B-cell differentiation. (A) Using a 2-step cell culture process, VPD-labeled naive B cells (NBCs) were differentiated into the cell populations P1, P2, and P3. P2 cells were subdivided into P2/CD23+ and P2/CD23– subsets. The PB P1 population arose from the P2/CD23– subset. (B) Left: PIM2 RNA-seq results on D4 or day 5 (D5) in the various cell populations. Data are presented as the mean ± SD, n = 3. Right: PIM2 mRNA expression in the various cell populations on D6. mRNA data are presented as the median (range); n = 6. Bottom, PIM2 protein expression in all cell populations, from day 0 (D0) to D6. (C) A single-cell quantitative RT-PCR heat map of the expression of 31 genes in P2/CD23– vs P2/CD23+ cell subsets; the red arrow indicates PIM2 mRNA expression. (D) PIM2 mRNA expression (top) and protein expression (bottom) in different tonsil-derived B-cell populations. mRNA data are presented as the median (range), n = 7. (E) The Integrative Genomic Viewer genome browser window, showing several features around the PIM2 locus. Colored tracks at the top are our RNA-seq and ATAC-seq data.5 ATAC-seq showed that the open regions included the PIM2 promoter and an upstream enhancer that physically interact together. ATAC-seq regions close to PIM2 comprise transcription factor–binding sites for relevant factors such as STAT3, according to ENCODE data, and also BACH2, including one we have identified by chromatin immunoprecipitation.17 5hmC marks are identified in ATAC-seq regions and the body of the PIM2 sequence in PBs.4 Details are provided in supplemental Figure 2A. (F) Levels of BACH2 and PIM2 mRNA expression (left) and protein expression (right) in D4lo cells after transfection with siBACH2 on day 2 (D2). mRNA data are presented as the mean ± SD, n = 4. (G) On D5, PBs were sorted, starved, and then stimulated with the indicated cytokines. Left: PIM2 mRNA expression after 4 hours (pink) and 16 hours (red). For each time point, the results were normalized against the nonstimulated condition (set arbitrarily to 1 [in gray]). mRNA data are presented as the mean ± SD, n = 5. Right: PIM2, pSTAT3 and pSTAT5 protein expression after 16 hours. (H) On D5, PBs were sorted, starved, and then treated with increasing doses of a STAT3 inhibitor (Stat3i) 1 hour before the addition of IL-10. PIM2 mRNA expression (left) and protein expression (right) were assessed 4 hours after the addition of IL-10. mRNA data are presented as the mean ± SD, n = 5. (I) Regulation of PIM2 expression during B-cell differentiation. At the start of B-cell differentiation and despite the open chromatin on the promoter and on other regulatory regions, PIM2 expression is constrained by BACH2. BACH2 expression then declines throughout the differentiation process, whereas T follicular helper–driven molecules stimulate STAT3 signaling. Both events promote the burst in PIM2 expression in cells committed to differentiation into PBs. Statistical significance was evaluated by using the Mann-Whitney U test (panels C, F, G, and H) or the Kruskal-Wallis test (panel H). *P < .05, **P < .01, ***P < .001. CpG, cytosine guanine dinucleotide; GC, germinal center; IgM, immunoglobulin M; MBC, memory B cell; ns, not significant; siCTL, small interference (si) RNA control (CTL); TFs, transcription factors; VPD, violet cell proliferation dilution. Further details are presented in supplemental Figure 1.
To determine whether PIM2 gene expression is coupled to genomic changes during PC differentiation, we analyzed our previously published data sets4,5 and ENCODE annotations (https://www.encodeproject.org). An assay for transposase-accessible chromatin sequencing (ATAC-seq) showed that the open regions in prePBs and PBs included the PIM2 promoter and an upstream enhancer. This latter overlaps with a region denoted as interacting physically with the PIM2 promoter in the FANTOM5 database15 and with a superenhancer described in PBs and MM PCs (Figure 1E).16 The comparative analysis of genome-wide 5hmC marks in naive B cells vs PBs showed that read densities increased in both the identified ATAC-seq regions and the body of the PIM2 sequence; this action testified to the enhancer functions and activation in PBs, as has been shown for PB/PC identity genes (Figure 1E; supplemental Figure 1D).4
ATAC-seq analysis showed that the time course of promoter opening did not match the gene expression pattern; this disparity suggests that a transcriptional regulator is present in the PIM2 locus (Figure 1E; supplemental Figure 1D). By chromatin immunoprecipitation sequencing of human activated B cells, we identified a BACH2 binding site in the PIM2 promoter.17 BACH2 inhibition experiments revealed a subsequent increase in PIM2 expression and thus confirmed that BACH2 acts as a repressor (Figure 1F). Furthermore, the stimulation of PBs with IL-10, IL-21, and (to a lesser extent) IL-6 resulted in a sharp induction of PIM2 expression (Figure 1G). Given that all 3 cytokines are known to recruit the STAT3 pathway, we exposed the cells to the STAT3 inhibitor C188-9; this led to the dose-dependent repression of PIM2 expression (Figure 1G-H). In contrast, IL-2 (which recruits STAT5) and interferon-α were weak inducers. Because STAT3 signaling also induces PRDM1/BLIMP1 expression,18 we wondered if PIM2 was one of the downstream factors of BLIMP1. In fact, under IL-10 (or IL-21 [data not shown]) stimulation, PRDM1 was induced but later than PIM2 expression (supplemental Figure 1E). In addition, siPRDM1 experiments on primary B cells and U266 MM cells showed no modifications in PIM2 expression, unlike the well-known target genes of BLIMP1 (supplemental Figure 1F-G),19,20 consistent with previous data in pre-PB/PBs from knockout Prdm1 mice.21 Finally, by chromatin immunoprecipitation–quantitative PCR on PBs and in RPMI8226 MM cells as well, we confirmed the binding of phosphorylated-STAT3 (pSTAT3) on the PIM2 promoter, as well as on the intron 3 of PIM2 locus (predicted enhancer region) and in the putative enhancer located downstream of the gene (Figure 1E; supplemental Figure 1H). Altogether, these results confirmed that PIM2 respond directly to STAT3 and not via BLIMP1. Interestingly, although PIM2-positive PBs were pSTAT3 positive in the absence of BACH2, PIM2-negative/BACH2-positive CD23+ activated B cells (CD23+ aBCs) were also positive for pSTAT3, suggesting that the downregulation of BACH2 is required before STAT3 can induce PIM2 expression (supplemental Figure 1I).
Taken as a whole, our results show that PB differentiation is associated with a sharp elevation of PIM2 kinase expression; this elevation requires the removal of BACH2 repression and STAT3 activation (Figure 1I).
PIM2 is required for the differentiation of B cells into PBs
To determine the functional involvement of PIM2 in the committal step and obtain further differentiated cells on D6, we focused our study on resulting PBs and CD23+ post-activated B cells (hereafter referred to as CD23+ aBCs), which both differed markedly in their PIM2 expression (Figure 2A). In subsequent experiments, we compared a normal culture setting with conditions in which PIM2 was inhibited on day 4 (D4) by exposure to the small-molecule pan-PIM inhibitor AZD1208 (hereafter referred as PIMi) or by specifically blocking PIM2 gene expression using a novel antisense RNA strategy based on a morpholino SSO (Figure 2B). Cells cultured with SSO-PIM2 exhibited a dose-dependent decrease in full-length PIM2 mRNA, the expression of a weaker band corresponding to alternatively spliced mRNAs lacking exon 2, as well as PIM2 protein expression (Figure 2C). At the selected dose of 2 µM, PIM2 expression was almost completely abrogated in PBs, without affecting PIM1 expression (Figure 2D; supplemental Figure 2B). Although exposure to SSO-PIM2 did not affect the expression of key transcription factors involved in B-cell differentiation (supplemental Figure 2C), PIM2 knockdown led to a sharp decrease in PB generation (Figure 2E-F; supplemental Figure 2D). In contrast, CD23+ aBCs were not affected. These results suggest that PIM2 kinase activity sustains the PB commitment.
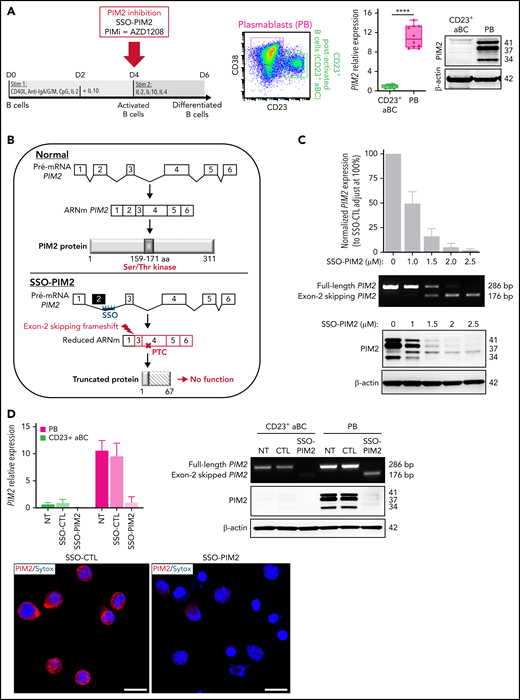
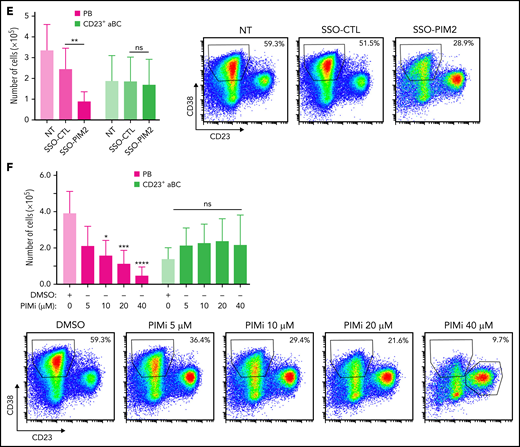
Specific inhibition of PIM2 affects the generation of PBs. (A) Left: On D6, total blood B cells were differentiated into 2 different cell populations: CD23+ aBCs and PBs. Right: PIM2 mRNA expression and protein expression in CD23+ aBCs and PBs on D6. Data are presented as the median (range), n = 10. (B) Diagram illustrating the mode of action of SSO-PIM2. Specific inhibition of PIM2 was performed by specifically blocking PIM2 gene expression using a novel antisense RNA strategy based on a morpholino SSO. In line with a previously described forced-splicing–dependent nonsense-mediated decay approach to knockdown,56,57 the SSO targets the 5′ splice site of exon 2 of PIM2, induces out-of-frame exon skipping, and generates a premature stop codon in exon 4. This latter eventually triggers nonsense-mediated decay or generates a truncated, nonfunctional protein. Details are provided in the supplemental Methods. (C) Activated B cells were treated with various doses of SSO-PIM2 from D4 to D6. Top, PIM2 mRNA expression levels were compared with those in a control experiment, set arbitrarily to 100% (mean ± SD, n = 4) (top section). The agarose gel from the PIM2 PCR shows the exon skipping (bottom section). Dose escalation experiments allowed us to select an SSO-PIM2 concentration of 2 µM for the subsequent experiments in the in vitro model. Bottom, PIM2 protein expression was assessed by western blot on D6 after PIM2 inhibition with an increasing dose of SSO-PIM2. (D) PIM2 mRNA expression (mean ± SD, n = 6) (left) and protein expression (right), as determined by immunoblotting and immunofluorescence in CD23+ aBCs and PBs after PIM2 inhibition with SSO-PIM2 (2 µM). Sytox (blue) stains the nucleus. Scale bar: 10 µm. (E-F) On D4, cells were treated with SSO-PIM2 (E) or increasing doses of PIMi (F). On D6, analysis of cell differentiation was performed in the model described in panel A. Proportion of CD23+ aBCs (CD23+/CD38low cells) and PBs (CD38high/CD23– cells) and the absolute number of each cell population were assessed by flow cytometry according to the gating strategy described in supplemental Figure 2D. Left: The absolute number of PBs and CD23+ aBCs obtained on D6 after PIM2 inhibition, compared with controls. Data are presented as the mean ± SD, n = 8. Right: One representative result of the proportion of PBs on D6 (evaluated by using flow cytometry) after PIM2 inhibition, compared with controls. Statistical significance was evaluated by using Mann-Whitney U (panel A), Wilcoxon (panel E), and Friedman (panel F) tests. *P < .05, **P < .01, ***P < .001, ****P < .0001. CpG, cytosine guanine dinucleotide; D0, day 0; D2, day 2; DMSO, dimethyl sulfoxide; NT, no treatment; ns, not significant. Further details are presented in supplemental Figure 2.
Specific inhibition of PIM2 affects the generation of PBs. (A) Left: On D6, total blood B cells were differentiated into 2 different cell populations: CD23+ aBCs and PBs. Right: PIM2 mRNA expression and protein expression in CD23+ aBCs and PBs on D6. Data are presented as the median (range), n = 10. (B) Diagram illustrating the mode of action of SSO-PIM2. Specific inhibition of PIM2 was performed by specifically blocking PIM2 gene expression using a novel antisense RNA strategy based on a morpholino SSO. In line with a previously described forced-splicing–dependent nonsense-mediated decay approach to knockdown,56,57 the SSO targets the 5′ splice site of exon 2 of PIM2, induces out-of-frame exon skipping, and generates a premature stop codon in exon 4. This latter eventually triggers nonsense-mediated decay or generates a truncated, nonfunctional protein. Details are provided in the supplemental Methods. (C) Activated B cells were treated with various doses of SSO-PIM2 from D4 to D6. Top, PIM2 mRNA expression levels were compared with those in a control experiment, set arbitrarily to 100% (mean ± SD, n = 4) (top section). The agarose gel from the PIM2 PCR shows the exon skipping (bottom section). Dose escalation experiments allowed us to select an SSO-PIM2 concentration of 2 µM for the subsequent experiments in the in vitro model. Bottom, PIM2 protein expression was assessed by western blot on D6 after PIM2 inhibition with an increasing dose of SSO-PIM2. (D) PIM2 mRNA expression (mean ± SD, n = 6) (left) and protein expression (right), as determined by immunoblotting and immunofluorescence in CD23+ aBCs and PBs after PIM2 inhibition with SSO-PIM2 (2 µM). Sytox (blue) stains the nucleus. Scale bar: 10 µm. (E-F) On D4, cells were treated with SSO-PIM2 (E) or increasing doses of PIMi (F). On D6, analysis of cell differentiation was performed in the model described in panel A. Proportion of CD23+ aBCs (CD23+/CD38low cells) and PBs (CD38high/CD23– cells) and the absolute number of each cell population were assessed by flow cytometry according to the gating strategy described in supplemental Figure 2D. Left: The absolute number of PBs and CD23+ aBCs obtained on D6 after PIM2 inhibition, compared with controls. Data are presented as the mean ± SD, n = 8. Right: One representative result of the proportion of PBs on D6 (evaluated by using flow cytometry) after PIM2 inhibition, compared with controls. Statistical significance was evaluated by using Mann-Whitney U (panel A), Wilcoxon (panel E), and Friedman (panel F) tests. *P < .05, **P < .01, ***P < .001, ****P < .0001. CpG, cytosine guanine dinucleotide; D0, day 0; D2, day 2; DMSO, dimethyl sulfoxide; NT, no treatment; ns, not significant. Further details are presented in supplemental Figure 2.
PIM2 sustains the G1/S transition through an effect on CDC25A and p27Kip1
A comparison of gene expression in prePBs vs noncommitted B-cell populations evidenced the downregulation of SMAD3 in the former population. Accordingly, prePBs upregulated CDC25A, CCND2, and CDK6 expression (supplemental Figure 3A), reentered the cell cycle, and gave rise to PBs.4 At D6, two days after inhibition of PIM2, the S phase decreased, and cells accumulated in G0/G1 (Figure 3A; supplemental Figure 3B). In parallel, the number of generated PBs decreased (Figure 2E-F), regardless of effects on cell death as shown by the QVD-OPH condition (supplemental Figure 3B-C). Moreover, after short exposure to PIMi (12 hours), the decrease of S phase was already observable in the absence of an effect on apoptosis (supplemental Figure 3B-D). Altogether, these results suggest that PIM2 promotes the G1/S transition independently of the cell death induction. We next performed cell cycle synchronization experiments in the XG21 MM cell line. As expected, unlike the control conditions, in which cells reached the S phase 6 hours after release, PIM2 inhibition was associated with blockage of the cells in G1 (supplemental Figure 3E).
![PIM2 supports cell cycle entry by promoting the G1/S transition. (A) Flow cytometry evaluation of the cell cycle in PBs on D6 after treatment with SSO-PIM2 and increasing doses of PIMi, compared with controls (n = 6). (B) Left: CDC25A mRNA expression in CD23+ aBCs and PBs on D6. Data are presented as the median (range), n = 10. Right: CDC25A protein expression (in the red square) in CD23+ aBCs and PBs on D6 after treatment with PIMi. †Nonspecific band. (C) D4 B cells were treated with PIMi and incubated with cycloheximide (CHX). At the indicated time points, CDC25A expression was analyzed by immunoblotting. (D) On D4, B cells were treated with PIMi and incubated in the presence of MG-132 for 2 hours. CDC25A expression was analyzed by immunoblotting. (E) Left: CDKN1B mRNA expression in CD23+ aBCs and PBs on D6. Data are presented as the median (range), n = 10. Right: PIM2, p(Thr198)-p27Kip1 (p-p27), and total p27Kip1 protein expression in CD23+ aBCs and PBs on D6 in total protein extracts and nuclear and cytoplasmic fractions. (F) Cells were incubated with CHX on D6, just before sorting. At the indicated time points, p27Kip1 expression in CD23+ aBCs and PBs was analyzed by immunoblotting. (G) Cells were incubated for 4 hours with MG-132 before sorting on D6. p27Kip1 expression in CD23+ aBCs and PBs was assessed by immunoblotting. (H) Left: Immunoprecipitation (IP) of p27Kip1 in D4-activated B cells. PIM2 and p27Kip1 were detected by immunoblotting. Right: On D4, activated B cells were shortly treated with PIMi. At the indicated time points, p-p27 and total p27Kip1 protein expression were assessed by immunoblotting. (I) PIM2 and p27Kip1 protein expression in PBs after treatment with PIMi in total protein extracts and nuclear and cytoplasmic fractions. (J) On D6, cells were treated with PIMi and incubated with CHX before sorting. At the indicated time points, p27Kip1 expression in PBs was assessed by immunoblotting. (K) On D6, cells were treated with PIMi for 2 hours before sorting. p-p27 and total p27Kip1 were assessed by immunoblotting. (L) On D6, cells were incubated in the presence or absence of PIMi for 2 hours before the addition (or not) of MG-132 for 4 hours. Left: p27Kip1 was assessed by immunoblotting. Right: Polyubiquitinated p27Kip1 and native p27Kip1 were assessed by immunoblotting. (M) PIM2 promotes the G1/S transition. Positive effects (in pink) are PIM2 dependent, whereas effects not directly related to PIM2 are shown in green. On one hand, PIM2 induces p27Kip1 degradation once the protein is localized in the cytoplasm; on the other hand, PIM2 maintains the expression of CDC25A. Statistical significance was evaluated by using Kruskal-Wallis tests (panel A, for PIMi experiment) and Mann-Whitney U test (panels A [for SSO experiment], B, and E). *P < .05, **P < .01, ****P < .0001. DAPI, 4′,6-diamidino-2-phenylindole; DMSO, dimethyl sulfoxide; IP-Ub, immunoprecipitation of the ubiquitin forms; NT, no treatment; ns, not significant. Further details are presented in supplemental Figure 3.](https://ash.silverchair-cdn.com/ash/content_public/journal/blood/139/15/10.1182_blood.2021014011/4/m_bloodbld2021014011f3a.png?Expires=1769080323&Signature=kVv35qdBxR8OjKROx9yKGFi5saLvFUrZ9ivQ4Yk9sGZ8Do48Zb0bbgXgT1aUqrGaCTjeOV64~O4xwlOujNtG1ArZ0cav0fn1uHsfdC5eqM3YnXUC-QzkA~uchl40WuFUZB00Jd235tUydvxoQBJy81woSlDt05Tt9ajdjvG7Dz4iujCifltsc7NdOAetTgXClRa-NkBcq6-oX~vGyiKRMDfvFzyHslK3XGqqY8usQQlvNM4DEH0gV7Of0GlpKzBw1HgRyOhXoyBCwrPOj7h8ytSG-8cYK14D~j9DLcjc--NLw0U9n4TBRGSmxIUMuIic8QOA2iwQpBVqVcE3bHONkQ__&Key-Pair-Id=APKAIE5G5CRDK6RD3PGA)
![PIM2 supports cell cycle entry by promoting the G1/S transition. (A) Flow cytometry evaluation of the cell cycle in PBs on D6 after treatment with SSO-PIM2 and increasing doses of PIMi, compared with controls (n = 6). (B) Left: CDC25A mRNA expression in CD23+ aBCs and PBs on D6. Data are presented as the median (range), n = 10. Right: CDC25A protein expression (in the red square) in CD23+ aBCs and PBs on D6 after treatment with PIMi. †Nonspecific band. (C) D4 B cells were treated with PIMi and incubated with cycloheximide (CHX). At the indicated time points, CDC25A expression was analyzed by immunoblotting. (D) On D4, B cells were treated with PIMi and incubated in the presence of MG-132 for 2 hours. CDC25A expression was analyzed by immunoblotting. (E) Left: CDKN1B mRNA expression in CD23+ aBCs and PBs on D6. Data are presented as the median (range), n = 10. Right: PIM2, p(Thr198)-p27Kip1 (p-p27), and total p27Kip1 protein expression in CD23+ aBCs and PBs on D6 in total protein extracts and nuclear and cytoplasmic fractions. (F) Cells were incubated with CHX on D6, just before sorting. At the indicated time points, p27Kip1 expression in CD23+ aBCs and PBs was analyzed by immunoblotting. (G) Cells were incubated for 4 hours with MG-132 before sorting on D6. p27Kip1 expression in CD23+ aBCs and PBs was assessed by immunoblotting. (H) Left: Immunoprecipitation (IP) of p27Kip1 in D4-activated B cells. PIM2 and p27Kip1 were detected by immunoblotting. Right: On D4, activated B cells were shortly treated with PIMi. At the indicated time points, p-p27 and total p27Kip1 protein expression were assessed by immunoblotting. (I) PIM2 and p27Kip1 protein expression in PBs after treatment with PIMi in total protein extracts and nuclear and cytoplasmic fractions. (J) On D6, cells were treated with PIMi and incubated with CHX before sorting. At the indicated time points, p27Kip1 expression in PBs was assessed by immunoblotting. (K) On D6, cells were treated with PIMi for 2 hours before sorting. p-p27 and total p27Kip1 were assessed by immunoblotting. (L) On D6, cells were incubated in the presence or absence of PIMi for 2 hours before the addition (or not) of MG-132 for 4 hours. Left: p27Kip1 was assessed by immunoblotting. Right: Polyubiquitinated p27Kip1 and native p27Kip1 were assessed by immunoblotting. (M) PIM2 promotes the G1/S transition. Positive effects (in pink) are PIM2 dependent, whereas effects not directly related to PIM2 are shown in green. On one hand, PIM2 induces p27Kip1 degradation once the protein is localized in the cytoplasm; on the other hand, PIM2 maintains the expression of CDC25A. Statistical significance was evaluated by using Kruskal-Wallis tests (panel A, for PIMi experiment) and Mann-Whitney U test (panels A [for SSO experiment], B, and E). *P < .05, **P < .01, ****P < .0001. DAPI, 4′,6-diamidino-2-phenylindole; DMSO, dimethyl sulfoxide; IP-Ub, immunoprecipitation of the ubiquitin forms; NT, no treatment; ns, not significant. Further details are presented in supplemental Figure 3.](https://ash.silverchair-cdn.com/ash/content_public/journal/blood/139/15/10.1182_blood.2021014011/4/m_bloodbld2021014011f3b.png?Expires=1769080323&Signature=yuXZYjVTkM8r~M8aenau08Ww20CdddO5QUy5cz-UG9WH-qkSdCwJWZKu08na45al4Ccqt5~EKZi7MIp7Yr5X5qzOeplnNqfURffY9a9Hp~eRqrTxADE8WX5iefr0wITTjfkJNmmJRhDrtRHB~-JlyVPbw2dDLqvQ5aqXwJjVwTu1laKgYLLz1rF3eW-UejQa8es9BfLiFTOsk~ukF4LB4TVfHtBD3HJnD1zYN0kV9PpbdfCg5o33aHMmtCbuUBVdIUhz4Caye6GoHU9NpxeGVbouqC7ETUZPOFvLALkcOI46LNYRomEG9j5u3hXFPm6fSahZMZD0zILhpiTRV8ebnA__&Key-Pair-Id=APKAIE5G5CRDK6RD3PGA)
PIM2 supports cell cycle entry by promoting the G1/S transition. (A) Flow cytometry evaluation of the cell cycle in PBs on D6 after treatment with SSO-PIM2 and increasing doses of PIMi, compared with controls (n = 6). (B) Left: CDC25A mRNA expression in CD23+ aBCs and PBs on D6. Data are presented as the median (range), n = 10. Right: CDC25A protein expression (in the red square) in CD23+ aBCs and PBs on D6 after treatment with PIMi. †Nonspecific band. (C) D4 B cells were treated with PIMi and incubated with cycloheximide (CHX). At the indicated time points, CDC25A expression was analyzed by immunoblotting. (D) On D4, B cells were treated with PIMi and incubated in the presence of MG-132 for 2 hours. CDC25A expression was analyzed by immunoblotting. (E) Left: CDKN1B mRNA expression in CD23+ aBCs and PBs on D6. Data are presented as the median (range), n = 10. Right: PIM2, p(Thr198)-p27Kip1 (p-p27), and total p27Kip1 protein expression in CD23+ aBCs and PBs on D6 in total protein extracts and nuclear and cytoplasmic fractions. (F) Cells were incubated with CHX on D6, just before sorting. At the indicated time points, p27Kip1 expression in CD23+ aBCs and PBs was analyzed by immunoblotting. (G) Cells were incubated for 4 hours with MG-132 before sorting on D6. p27Kip1 expression in CD23+ aBCs and PBs was assessed by immunoblotting. (H) Left: Immunoprecipitation (IP) of p27Kip1 in D4-activated B cells. PIM2 and p27Kip1 were detected by immunoblotting. Right: On D4, activated B cells were shortly treated with PIMi. At the indicated time points, p-p27 and total p27Kip1 protein expression were assessed by immunoblotting. (I) PIM2 and p27Kip1 protein expression in PBs after treatment with PIMi in total protein extracts and nuclear and cytoplasmic fractions. (J) On D6, cells were treated with PIMi and incubated with CHX before sorting. At the indicated time points, p27Kip1 expression in PBs was assessed by immunoblotting. (K) On D6, cells were treated with PIMi for 2 hours before sorting. p-p27 and total p27Kip1 were assessed by immunoblotting. (L) On D6, cells were incubated in the presence or absence of PIMi for 2 hours before the addition (or not) of MG-132 for 4 hours. Left: p27Kip1 was assessed by immunoblotting. Right: Polyubiquitinated p27Kip1 and native p27Kip1 were assessed by immunoblotting. (M) PIM2 promotes the G1/S transition. Positive effects (in pink) are PIM2 dependent, whereas effects not directly related to PIM2 are shown in green. On one hand, PIM2 induces p27Kip1 degradation once the protein is localized in the cytoplasm; on the other hand, PIM2 maintains the expression of CDC25A. Statistical significance was evaluated by using Kruskal-Wallis tests (panel A, for PIMi experiment) and Mann-Whitney U test (panels A [for SSO experiment], B, and E). *P < .05, **P < .01, ****P < .0001. DAPI, 4′,6-diamidino-2-phenylindole; DMSO, dimethyl sulfoxide; IP-Ub, immunoprecipitation of the ubiquitin forms; NT, no treatment; ns, not significant. Further details are presented in supplemental Figure 3.
PIM2 supports cell cycle entry by promoting the G1/S transition. (A) Flow cytometry evaluation of the cell cycle in PBs on D6 after treatment with SSO-PIM2 and increasing doses of PIMi, compared with controls (n = 6). (B) Left: CDC25A mRNA expression in CD23+ aBCs and PBs on D6. Data are presented as the median (range), n = 10. Right: CDC25A protein expression (in the red square) in CD23+ aBCs and PBs on D6 after treatment with PIMi. †Nonspecific band. (C) D4 B cells were treated with PIMi and incubated with cycloheximide (CHX). At the indicated time points, CDC25A expression was analyzed by immunoblotting. (D) On D4, B cells were treated with PIMi and incubated in the presence of MG-132 for 2 hours. CDC25A expression was analyzed by immunoblotting. (E) Left: CDKN1B mRNA expression in CD23+ aBCs and PBs on D6. Data are presented as the median (range), n = 10. Right: PIM2, p(Thr198)-p27Kip1 (p-p27), and total p27Kip1 protein expression in CD23+ aBCs and PBs on D6 in total protein extracts and nuclear and cytoplasmic fractions. (F) Cells were incubated with CHX on D6, just before sorting. At the indicated time points, p27Kip1 expression in CD23+ aBCs and PBs was analyzed by immunoblotting. (G) Cells were incubated for 4 hours with MG-132 before sorting on D6. p27Kip1 expression in CD23+ aBCs and PBs was assessed by immunoblotting. (H) Left: Immunoprecipitation (IP) of p27Kip1 in D4-activated B cells. PIM2 and p27Kip1 were detected by immunoblotting. Right: On D4, activated B cells were shortly treated with PIMi. At the indicated time points, p-p27 and total p27Kip1 protein expression were assessed by immunoblotting. (I) PIM2 and p27Kip1 protein expression in PBs after treatment with PIMi in total protein extracts and nuclear and cytoplasmic fractions. (J) On D6, cells were treated with PIMi and incubated with CHX before sorting. At the indicated time points, p27Kip1 expression in PBs was assessed by immunoblotting. (K) On D6, cells were treated with PIMi for 2 hours before sorting. p-p27 and total p27Kip1 were assessed by immunoblotting. (L) On D6, cells were incubated in the presence or absence of PIMi for 2 hours before the addition (or not) of MG-132 for 4 hours. Left: p27Kip1 was assessed by immunoblotting. Right: Polyubiquitinated p27Kip1 and native p27Kip1 were assessed by immunoblotting. (M) PIM2 promotes the G1/S transition. Positive effects (in pink) are PIM2 dependent, whereas effects not directly related to PIM2 are shown in green. On one hand, PIM2 induces p27Kip1 degradation once the protein is localized in the cytoplasm; on the other hand, PIM2 maintains the expression of CDC25A. Statistical significance was evaluated by using Kruskal-Wallis tests (panel A, for PIMi experiment) and Mann-Whitney U test (panels A [for SSO experiment], B, and E). *P < .05, **P < .01, ****P < .0001. DAPI, 4′,6-diamidino-2-phenylindole; DMSO, dimethyl sulfoxide; IP-Ub, immunoprecipitation of the ubiquitin forms; NT, no treatment; ns, not significant. Further details are presented in supplemental Figure 3.
The phosphatase CDC25A is required for the G1/S transition.22CDC25A gene expression was significantly greater in PBs than in CD23+ aBCs, as well as the protein expression (Figure 3B). Chemical inhibition of CDC25A first led to a dramatic decrease in the proportion of S-phase cells and then, ultimately, to a strong reduction in the number of generated PBs (supplemental Figure 3F-G). Interestingly, PIM2 inhibition led to a decrease of CDC25A protein level in PBs without affecting CDC25A expression (Figure 3B; supplemental Figure 3H). At D4, the addition of PIMi to cycloheximide-treated cells accelerated the degradation of CDC25A (Figure 3C; supplemental Figure 3I), whereas in the presence of MG-132, cells maintained CDC25A expression (Figure 3D).
Cyclin-dependent kinase (CDK) inhibitor 1B (p27Kip1, encoded by the CDKN1B gene) prevents progression to G1.23 This effect is linked to the location of p27Kip1 in the nucleus; cells that enter the cell cycle exhibit a cyclin D2–mediated nuclear export of p27Kip1.24CDKN1B expression was significantly higher in PBs than in CD23+ aBCs, whereas the p27Kip1 protein expression was lower and mainly located in the nucleus in CD23+ aBCs (Figure 3E). In addition, we detected the threonine 198-phopshorylated [p(Thr198)] form of p27Kip1, predominantly expressed in PBs compared with CD23+ aBCs. These results prompted us to assess the half-life of p27Kip1 in PBs vs CD23+ aBCs. Cycloheximide-treated PBs were more susceptible to p27Kip1 proteasome-mediated degradation, as shown after the addition of MG-132 (Figure 3F-G). Interestingly, in highly proliferative D4 B cells, endogenous immunoprecipitation of p27Kip1 revealed the binding of PIM2, and short treatment by PIMi resulted in a time-dependent decrease of p(Thr198)-p27Kip1 (Figure 3H). PBs generated after PIM2 inhibition showed an increase in the global level of p27Kip1 expression, independently to CDKN1B expression, particularly in the nucleus (Figure 3I; supplemental Figure 3J-K). In cycloheximide-treated PBs, the addition of PIMi stabilized p27Kip1 (Figure 3J; supplemental Figure 3L). Finally, PIMi-treated PBs showed a decrease of p(Thr198)-p27Kip1 as well as a decrease in poly-ubiquitinylated forms of p27Kip1 in the presence of MG-132 (Figure 3K-L; supplemental Figure 3M).
Overall, PIM2 expression during PB differentiation promotes the G1/S transition in prePBs by stabilizing CDC25A phosphatase and increasing the degradation of cytoplasmic p27Kip1 (Figure 3M).
PIM2 hinders the execution of caspase 3–driven apoptosis
The most prominent changes during PB commitment are related to cell death/survival.4 Indeed, in culture, the majority of B cells were dead on D6 (Figure 4A). The pan-caspase inhibitor QVD-OPH rescued the cells from death with the exception of the PBs; the latter seemed to be protected from apoptosis and despite an increase in CASP3 gene expression (Figure 4A-B). Investigations of the proteins produced by the various cell subsets in our differentiation model showed that PBs contained higher levels of antiapoptotic phosphorylated BAD (pBAD) and X-linked inhibitor of apoptosis protein (XIAP) (Figure 4C-D).9,10 Consistent with this finding, immunoprecipitation of PIM2 revealed a binding on BAD most likely required before phosphorylation (Figure 4E). In accordance with this finding and despite the elevation in levels of procaspase 3, PBs displayed low levels of caspase 3 autocatalytic activity and thus did not produce many active p19/p17 forms [as highlighted by lower levels of cleaved poly(ADP-ribose) polymerase (PARP)] as P2/CD23+ cells did (Figure 4F).25 Overall, PBs maintain caspase 9 in an inactivated state, and XIAP protein remains protected from degradation (Figure 4C-F).26 XIAP is thought to have a key role in PBs by inhibiting caspase 3 activation. Indeed, immunoprecipitation of caspase 3 and XIAP revealed the binding of XIAP on p19/p17 fragments of caspase 3 (Figure 4G), which impairs their catalytic activity on procaspase 3.27,28 Lastly, the P2/CD23+ cells’ complete degradation of PARP (Figure 4F) showed that terminal B-cell differentiation is associated with apoptosis if cells are not otherwise protected by the PB commitment. In PBs, PIM2 inhibition induced an increase in activated caspase 3 levels and thus a decrease in cell viability (Figure 4H-I; supplemental Figure 4A). This effect was driven by: (1) the strong mitochondrial depolarization due to the inhibition of pBAD; (2) the production of cleaved caspase 9; (3) the decrease in XIAP; (4) the detection of the p17 fragment of caspase 3; and (5) PARP cleavage (Figure 4J-L). Lastly, addition of the caspase 3 inhibitor Q-DEVD-OPH rescued the PBs from cell death (supplemental Figure 4B).
![PIM2 is required to counter mitochondrial apoptosis. (A) Analysis of cell death was performed in the model previously described.5 Cell viability (number of caspase 3–active negative [alive cells] and positive [death cells]) and cell differentiation (number of P3 cells, P2/CD23+ cells, P2/CD23– cells, and P1 cells) were assessed by using flow cytometry. (A, left) The total numbers of dead cells and living cells in the 4 populations on D6. The pie chart shows the percentage of cells, n = 7. (A, right) On D4, cells were treated (or not) with QVD-OPH. On D6, the numbers of cells in each population were recorded. Data are presented as the mean ± SD, n = 6. (B) CASP3 mRNA expression in the various cell populations on D6. The data are presented as the median (range), n = 6. (C) Factors in the mitochondrial apoptosis pathway involved in B-cell differentiation. The green “+” symbol represents a death-activating effect, and the red “-” symbol represents a death-inhibiting effect. The pro-apoptotic protein BAD causes depolarization of the mitochondria, followed by the cleavage of procaspase 9 into active caspase 9, which in turn cleaves procaspase 3 to generate an intermediate, inactive p20 form. Following an auto-catalytic process, the p20 form gives rise to catalytically active p19 and p17 fragments. These molecules cleave PARP (the end effector in the apoptotic process) and also p20 in a feedback loop. Molecules are released from the mitochondria after depolarization and block the action of the inhibitor of apoptosis proteins, including XIAP. The phosphorylation of BAD leads to its cytoplasmic sequestration by 14-3-3, thus hijacking its pro-apoptotic effect. (D and F) Assessment of the protein expression of factors involved in the mitochondrial apoptosis pathway during primary B-cell differentiation. (E) Immunoprecipitation of PIM2 in PBs. PIM2 and BAD were detected by immunoblotting. (G) Immunoprecipitation (IP) of XIAP (top) and caspase 3 (bottom) in PBs. XIAP and caspase 3 were detected by immunoblotting. (H-I) Flow cytometry evaluation of the percentage of active caspase 3–positive PBs on D6, after treatment with SSO-PIM2 (H) or with increasing doses of PIMi (I), relative to controls. Data are presented as the mean ± SD, n = 8. (J) One representative result of the tetramethylrhodamine methyl ester (TMRM) signal on D6 in PBs (analyzed by flow cytometry) after treatment with SSO-PIM2 (left) or PIMi (right), compared with controls. (K-L) Assessment of protein expression levels in PBs on D6 for factors involved in the mitochondrial apoptosis pathway after PIM2 inhibition by SSO-PIM2 (K) or PIMi (10 µM) (L), compared with controls. Statistical significance was evaluated by using Mann-Whitney U (panels A and B), Wilcoxon (panel H), and Friedman (panel I) tests. *P < .05, **P < .01, ***P < .001, ****P < .0001. Cl, cleaved; DMSO, dimethyl sulfoxide; FSC, forward scatter; NBC, naive B cells; ns, not significant; NT, no treatment. Further details are presented in supplemental Figure 4.](https://ash.silverchair-cdn.com/ash/content_public/journal/blood/139/15/10.1182_blood.2021014011/4/m_bloodbld2021014011f4a.png?Expires=1769080323&Signature=ueGV9poS9zbcVeX1aD0Bb0uWuycbyddi0-60ryL0DeOGX4baK4yMeUtRTcIFZKJV0cK1t0YAbKVqP1drpVwCyzrK4apMS76ksg6s24eWcXdW-Sr4WfRuaHwq1sepLWuqsEQzxIibRFIT9eMAMtbfUTIE9jSsqnAh~2uJ28P5HZ1gqp-Pqo8fF0v7p16O4XVnpA1F0Xp2pF8w09Nb1wiVR-AjEw6EySQtV52kWOfw559RtbONiPujKBArFHo6QZ1CgPW3tStdv83iouCdpA~BiR0Os7O5yZW2ur90gN1SNktJmHMTHe3pLccnr9snjtUH1ZUdZNcoPpMKIs6YzumQ0A__&Key-Pair-Id=APKAIE5G5CRDK6RD3PGA)
![PIM2 is required to counter mitochondrial apoptosis. (A) Analysis of cell death was performed in the model previously described.5 Cell viability (number of caspase 3–active negative [alive cells] and positive [death cells]) and cell differentiation (number of P3 cells, P2/CD23+ cells, P2/CD23– cells, and P1 cells) were assessed by using flow cytometry. (A, left) The total numbers of dead cells and living cells in the 4 populations on D6. The pie chart shows the percentage of cells, n = 7. (A, right) On D4, cells were treated (or not) with QVD-OPH. On D6, the numbers of cells in each population were recorded. Data are presented as the mean ± SD, n = 6. (B) CASP3 mRNA expression in the various cell populations on D6. The data are presented as the median (range), n = 6. (C) Factors in the mitochondrial apoptosis pathway involved in B-cell differentiation. The green “+” symbol represents a death-activating effect, and the red “-” symbol represents a death-inhibiting effect. The pro-apoptotic protein BAD causes depolarization of the mitochondria, followed by the cleavage of procaspase 9 into active caspase 9, which in turn cleaves procaspase 3 to generate an intermediate, inactive p20 form. Following an auto-catalytic process, the p20 form gives rise to catalytically active p19 and p17 fragments. These molecules cleave PARP (the end effector in the apoptotic process) and also p20 in a feedback loop. Molecules are released from the mitochondria after depolarization and block the action of the inhibitor of apoptosis proteins, including XIAP. The phosphorylation of BAD leads to its cytoplasmic sequestration by 14-3-3, thus hijacking its pro-apoptotic effect. (D and F) Assessment of the protein expression of factors involved in the mitochondrial apoptosis pathway during primary B-cell differentiation. (E) Immunoprecipitation of PIM2 in PBs. PIM2 and BAD were detected by immunoblotting. (G) Immunoprecipitation (IP) of XIAP (top) and caspase 3 (bottom) in PBs. XIAP and caspase 3 were detected by immunoblotting. (H-I) Flow cytometry evaluation of the percentage of active caspase 3–positive PBs on D6, after treatment with SSO-PIM2 (H) or with increasing doses of PIMi (I), relative to controls. Data are presented as the mean ± SD, n = 8. (J) One representative result of the tetramethylrhodamine methyl ester (TMRM) signal on D6 in PBs (analyzed by flow cytometry) after treatment with SSO-PIM2 (left) or PIMi (right), compared with controls. (K-L) Assessment of protein expression levels in PBs on D6 for factors involved in the mitochondrial apoptosis pathway after PIM2 inhibition by SSO-PIM2 (K) or PIMi (10 µM) (L), compared with controls. Statistical significance was evaluated by using Mann-Whitney U (panels A and B), Wilcoxon (panel H), and Friedman (panel I) tests. *P < .05, **P < .01, ***P < .001, ****P < .0001. Cl, cleaved; DMSO, dimethyl sulfoxide; FSC, forward scatter; NBC, naive B cells; ns, not significant; NT, no treatment. Further details are presented in supplemental Figure 4.](https://ash.silverchair-cdn.com/ash/content_public/journal/blood/139/15/10.1182_blood.2021014011/4/m_bloodbld2021014011f4b.png?Expires=1769080323&Signature=CzJ5Ml4gL1eke-e~shmoEoKqGXKl1~gOb~cb-tM5IkcBAq5qdl54HPQoHZmJZhWkhYB1nRHfUzOLrsVKuwtbHvnpeoiE-mCAtEQ4US9hRYKlCG5wCzE4rkhqqcfdDfjf~1aQumZZM0TwKTpLGAV6GCk~0ypE9qSJBa9BdCtF0L1DaPbfBlZFixi-C3nJSzqdycvArblxGV1q2-JvcvEIH6al8phjnDqxR8vzgMxzNSjjqZGOHGBSGW3QCesqXOf2bThWsHwXJqjKhCBwxH3hKoKVdTbUcLKnv5Hz9JAYdxH-5oQ47Gtgv0yyCFfmn-Kjjt3WsaY0lhqFn-prcjd7fw__&Key-Pair-Id=APKAIE5G5CRDK6RD3PGA)
PIM2 is required to counter mitochondrial apoptosis. (A) Analysis of cell death was performed in the model previously described.5 Cell viability (number of caspase 3–active negative [alive cells] and positive [death cells]) and cell differentiation (number of P3 cells, P2/CD23+ cells, P2/CD23– cells, and P1 cells) were assessed by using flow cytometry. (A, left) The total numbers of dead cells and living cells in the 4 populations on D6. The pie chart shows the percentage of cells, n = 7. (A, right) On D4, cells were treated (or not) with QVD-OPH. On D6, the numbers of cells in each population were recorded. Data are presented as the mean ± SD, n = 6. (B) CASP3 mRNA expression in the various cell populations on D6. The data are presented as the median (range), n = 6. (C) Factors in the mitochondrial apoptosis pathway involved in B-cell differentiation. The green “+” symbol represents a death-activating effect, and the red “-” symbol represents a death-inhibiting effect. The pro-apoptotic protein BAD causes depolarization of the mitochondria, followed by the cleavage of procaspase 9 into active caspase 9, which in turn cleaves procaspase 3 to generate an intermediate, inactive p20 form. Following an auto-catalytic process, the p20 form gives rise to catalytically active p19 and p17 fragments. These molecules cleave PARP (the end effector in the apoptotic process) and also p20 in a feedback loop. Molecules are released from the mitochondria after depolarization and block the action of the inhibitor of apoptosis proteins, including XIAP. The phosphorylation of BAD leads to its cytoplasmic sequestration by 14-3-3, thus hijacking its pro-apoptotic effect. (D and F) Assessment of the protein expression of factors involved in the mitochondrial apoptosis pathway during primary B-cell differentiation. (E) Immunoprecipitation of PIM2 in PBs. PIM2 and BAD were detected by immunoblotting. (G) Immunoprecipitation (IP) of XIAP (top) and caspase 3 (bottom) in PBs. XIAP and caspase 3 were detected by immunoblotting. (H-I) Flow cytometry evaluation of the percentage of active caspase 3–positive PBs on D6, after treatment with SSO-PIM2 (H) or with increasing doses of PIMi (I), relative to controls. Data are presented as the mean ± SD, n = 8. (J) One representative result of the tetramethylrhodamine methyl ester (TMRM) signal on D6 in PBs (analyzed by flow cytometry) after treatment with SSO-PIM2 (left) or PIMi (right), compared with controls. (K-L) Assessment of protein expression levels in PBs on D6 for factors involved in the mitochondrial apoptosis pathway after PIM2 inhibition by SSO-PIM2 (K) or PIMi (10 µM) (L), compared with controls. Statistical significance was evaluated by using Mann-Whitney U (panels A and B), Wilcoxon (panel H), and Friedman (panel I) tests. *P < .05, **P < .01, ***P < .001, ****P < .0001. Cl, cleaved; DMSO, dimethyl sulfoxide; FSC, forward scatter; NBC, naive B cells; ns, not significant; NT, no treatment. Further details are presented in supplemental Figure 4.
PIM2 is required to counter mitochondrial apoptosis. (A) Analysis of cell death was performed in the model previously described.5 Cell viability (number of caspase 3–active negative [alive cells] and positive [death cells]) and cell differentiation (number of P3 cells, P2/CD23+ cells, P2/CD23– cells, and P1 cells) were assessed by using flow cytometry. (A, left) The total numbers of dead cells and living cells in the 4 populations on D6. The pie chart shows the percentage of cells, n = 7. (A, right) On D4, cells were treated (or not) with QVD-OPH. On D6, the numbers of cells in each population were recorded. Data are presented as the mean ± SD, n = 6. (B) CASP3 mRNA expression in the various cell populations on D6. The data are presented as the median (range), n = 6. (C) Factors in the mitochondrial apoptosis pathway involved in B-cell differentiation. The green “+” symbol represents a death-activating effect, and the red “-” symbol represents a death-inhibiting effect. The pro-apoptotic protein BAD causes depolarization of the mitochondria, followed by the cleavage of procaspase 9 into active caspase 9, which in turn cleaves procaspase 3 to generate an intermediate, inactive p20 form. Following an auto-catalytic process, the p20 form gives rise to catalytically active p19 and p17 fragments. These molecules cleave PARP (the end effector in the apoptotic process) and also p20 in a feedback loop. Molecules are released from the mitochondria after depolarization and block the action of the inhibitor of apoptosis proteins, including XIAP. The phosphorylation of BAD leads to its cytoplasmic sequestration by 14-3-3, thus hijacking its pro-apoptotic effect. (D and F) Assessment of the protein expression of factors involved in the mitochondrial apoptosis pathway during primary B-cell differentiation. (E) Immunoprecipitation of PIM2 in PBs. PIM2 and BAD were detected by immunoblotting. (G) Immunoprecipitation (IP) of XIAP (top) and caspase 3 (bottom) in PBs. XIAP and caspase 3 were detected by immunoblotting. (H-I) Flow cytometry evaluation of the percentage of active caspase 3–positive PBs on D6, after treatment with SSO-PIM2 (H) or with increasing doses of PIMi (I), relative to controls. Data are presented as the mean ± SD, n = 8. (J) One representative result of the tetramethylrhodamine methyl ester (TMRM) signal on D6 in PBs (analyzed by flow cytometry) after treatment with SSO-PIM2 (left) or PIMi (right), compared with controls. (K-L) Assessment of protein expression levels in PBs on D6 for factors involved in the mitochondrial apoptosis pathway after PIM2 inhibition by SSO-PIM2 (K) or PIMi (10 µM) (L), compared with controls. Statistical significance was evaluated by using Mann-Whitney U (panels A and B), Wilcoxon (panel H), and Friedman (panel I) tests. *P < .05, **P < .01, ***P < .001, ****P < .0001. Cl, cleaved; DMSO, dimethyl sulfoxide; FSC, forward scatter; NBC, naive B cells; ns, not significant; NT, no treatment. Further details are presented in supplemental Figure 4.
Taken as a whole, these data show that PIM2 counteracts the activation of caspase 3 in PBs and thus promotes cell survival.
PIM2 stabilizes cytoplasmic p21Cip1 and promotes the latter’s binding to caspase 3
As with p27Kip1, nuclear p21Cip1 is a CDK inhibitor and inhibits entry into the S phase of the cell cycle.29 PB commitment was associated with a significant increase in transcription of CDKN1A (which encodes p21Cip1), and levels of p21Cip1 were markedly higher in PBs than in CD23+ aBCs (Figure 5A). Surprisingly, p21Cip1 was essentially expressed in the cytoplasm, and endogenous immunoprecipitation experiments yielded a multiprotein complex in which p21Cip1 interacted with PIM2 and heat shock protein 90β (HSP90β) (Figure 5B-C). Moreover, PIM2 inhibition led to a dramatic decrease in cytoplasmic p21Cip1 without effect on either CDKN1A expression or nucleus relocalization (Figure 5D; supplemental Figure 5A-B). The addition of PIMi to cycloheximide-treated cells accelerated the degradation of p21Cip1 (Figure 5E). Treatment with MG-132 induced a strong accumulation of p21Cip1, and the addition of PIMi was associated with elevated poly-ubiquitinylated p21Cip1 (Figure 5F-G). XG21 cells presented similar results (supplemental Figure 5C-F). Collectively, these results show that PIM2 stabilizes p21Cip1 in PBs by promoting its binding to a cytoplasmic multiprotein complex and, thus, preventing proteasome-mediated degradation of p21Cip1.
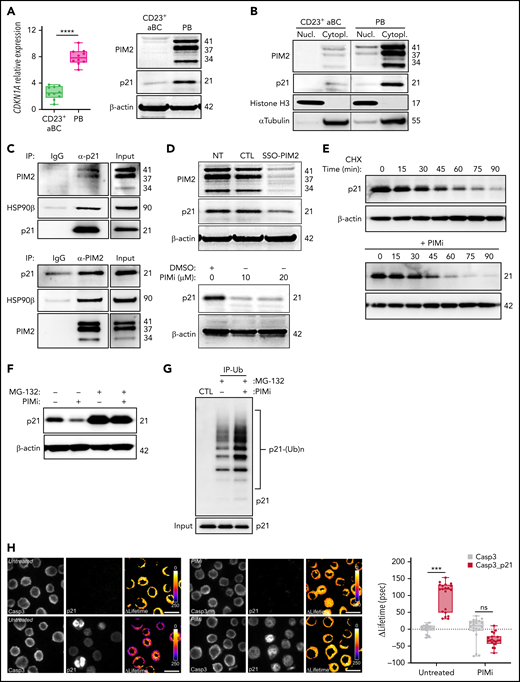
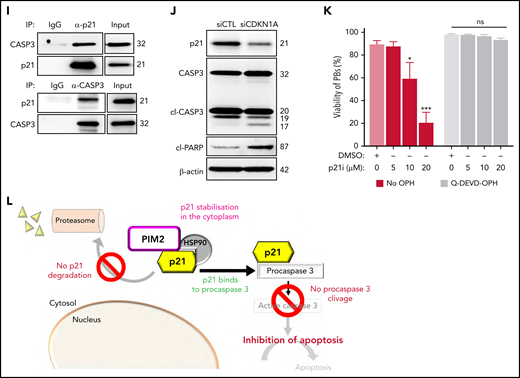
PIM2 helps to stabilize cytoplasmic p21Cip1 and promotes the caspase 3/p21Cip1 interaction. (A) Left: CDKN1A mRNA expression was measured on D6 in CD23+ aBCs and PBs. Data are presented as the median (range), n = 10. Right: PIM2 and p21Cip1 protein expression on D6 in CD23+ aBCs and PBs. (B) PIM2 and p21Cip1 protein expression was measured in nuclear and cytoplasmic fractions from CD23+ aBCs and PBs. (C) PIM2 (left) and p21Cip1 (right) immunoprecipitation (IP) in PBs. Heat shock protein 90β (HSP90β), p21Cip, and PIM2 were detected by immunoblotting. (D) PIM2 and p21Cip1 protein expression after treatment with SSO-PIM2 (top) or PIMi (bottom) in total extracts from PBs. (E) PBs were sorted and then treated with PIMi and incubated with cycloheximide (CHX). At indicated times, p21Cip1 expression was assessed by immunoblotting. (F) PBs were sorted and then treated with PIMi for 2 hours in the presence (or not) of MG-132. p21Cip1 was assessed by immunoblotting. (G) PBs were treated for 30 minutes with PIMi after incubation in the presence of MG-132 for 2 hours. Polyubiquitinated p21Cip1 and native p21Cip1 were assessed by immunoblotting. (H) FRET/FLIM (Förster resonance energy transfer (FRET) by fluorescence lifetime imaging (FLIM)) was analyzed in XG21 cells stained for caspase 3 (the donor) in the presence or absence of p21Cip1 (the acceptor). Cells were left untreated (upper panels) or treated with PIMi (lower panels). The graph shows the quantified ΔLifetime. Data are presented as the median (range), n = 20 cells per condition. Pseudocolor scale, pixel-by-pixel ΔLifetime. Scale bar: 10 µm. (I) p21Cip1 (top) and caspase 3 (bottom) IP in PBs. Caspase 3 and p21Cip were detected by immunoblotting. (J) p21Cip1, procaspase 3, cleaved caspase 3, and cleaved PARP protein expression on D6 in PBs, after transfection with siCDKN1A or siCTL on D4. (K) On D4, activated B cells were treated for 24 hours with increased doses of p21i in the presence or absence of Q-DEVD-OPH. PB viability (the proportion of active caspase 3–negative cells) was assessed by flow cytometry. Data are presented as the mean ± SD, n = 5. (L) The PIM2/p21Cip1/caspase 3 pathway in PBs. p21Cip1 is stabilized in the cytoplasm by a protein complex that also includes PIM2 and HSP90β. Due to this localization, p21Cip1 interacts with procaspase 3 and blocks its activation. Statistical significance was evaluated by using Mann-Whitney U (panels A and H) and Kruskal-Wallis (panel K) tests. *P < .05, ***P < .001, ****P < .0001. Cl, cleaved; DMSO, dimethyl sulfoxide; IgG, immunoglobulin G; IP-Ub, immunoprecipitation of ubiquitin forms; ns, not significant; NT, no treatment; siCTL, small interference (si) RNA control (CTL). Further details are presented in supplemental Figure 5.
PIM2 helps to stabilize cytoplasmic p21Cip1 and promotes the caspase 3/p21Cip1 interaction. (A) Left: CDKN1A mRNA expression was measured on D6 in CD23+ aBCs and PBs. Data are presented as the median (range), n = 10. Right: PIM2 and p21Cip1 protein expression on D6 in CD23+ aBCs and PBs. (B) PIM2 and p21Cip1 protein expression was measured in nuclear and cytoplasmic fractions from CD23+ aBCs and PBs. (C) PIM2 (left) and p21Cip1 (right) immunoprecipitation (IP) in PBs. Heat shock protein 90β (HSP90β), p21Cip, and PIM2 were detected by immunoblotting. (D) PIM2 and p21Cip1 protein expression after treatment with SSO-PIM2 (top) or PIMi (bottom) in total extracts from PBs. (E) PBs were sorted and then treated with PIMi and incubated with cycloheximide (CHX). At indicated times, p21Cip1 expression was assessed by immunoblotting. (F) PBs were sorted and then treated with PIMi for 2 hours in the presence (or not) of MG-132. p21Cip1 was assessed by immunoblotting. (G) PBs were treated for 30 minutes with PIMi after incubation in the presence of MG-132 for 2 hours. Polyubiquitinated p21Cip1 and native p21Cip1 were assessed by immunoblotting. (H) FRET/FLIM (Förster resonance energy transfer (FRET) by fluorescence lifetime imaging (FLIM)) was analyzed in XG21 cells stained for caspase 3 (the donor) in the presence or absence of p21Cip1 (the acceptor). Cells were left untreated (upper panels) or treated with PIMi (lower panels). The graph shows the quantified ΔLifetime. Data are presented as the median (range), n = 20 cells per condition. Pseudocolor scale, pixel-by-pixel ΔLifetime. Scale bar: 10 µm. (I) p21Cip1 (top) and caspase 3 (bottom) IP in PBs. Caspase 3 and p21Cip were detected by immunoblotting. (J) p21Cip1, procaspase 3, cleaved caspase 3, and cleaved PARP protein expression on D6 in PBs, after transfection with siCDKN1A or siCTL on D4. (K) On D4, activated B cells were treated for 24 hours with increased doses of p21i in the presence or absence of Q-DEVD-OPH. PB viability (the proportion of active caspase 3–negative cells) was assessed by flow cytometry. Data are presented as the mean ± SD, n = 5. (L) The PIM2/p21Cip1/caspase 3 pathway in PBs. p21Cip1 is stabilized in the cytoplasm by a protein complex that also includes PIM2 and HSP90β. Due to this localization, p21Cip1 interacts with procaspase 3 and blocks its activation. Statistical significance was evaluated by using Mann-Whitney U (panels A and H) and Kruskal-Wallis (panel K) tests. *P < .05, ***P < .001, ****P < .0001. Cl, cleaved; DMSO, dimethyl sulfoxide; IgG, immunoglobulin G; IP-Ub, immunoprecipitation of ubiquitin forms; ns, not significant; NT, no treatment; siCTL, small interference (si) RNA control (CTL). Further details are presented in supplemental Figure 5.
This PIM2-induced cytoplasmic stabilization of p21Cip1 prompted us to question the latter’s role in PB commitment. As described previously for other cell types,30,31 we hypothesized that p21Cip1 interacts with procaspase 3. In fluorescence resonance energy transfer (FRET)32 experiments on XG21 cells, we detected a p21Cip1/procaspase 3 complex whose formation was abrogated by pretreatment of the cells with PIMi (Figure 5H). Immunoprecipitation experiments confirmed the presence of this complex in PBs (Figure 5I; supplemental Figure 5G). To determine whether p21Cip1 mediates apoptosis inhibition, small interfering RNA was used to downregulate CDKN1A expression (supplemental Figure 5H). On D6, the generated PBs were found to contain p17-forms of caspase 3 and cleaved PARP, confirming that apoptosis had taken place (Figure 5J; supplemental Figure 5I). Treatment with the small-molecule p21Cip1 inhibitor UC2288 was associated with a dose-dependent decrease in cell viability, which was restored by treatment with the caspase 3 inhibitor Q-DEVD-OPH (Figure 5K; supplemental Figure 5J-K).
Taken as a whole, these findings show that in addition to its mitochondrial effects, PIM2 inhibits the execution of apoptosis by stabilizing cytoplasmic p21Cip1, allowing the latter to bind to procaspase 3, and thus inhibiting the production of activated caspase 3 (Figure 5L).
Mature PCs need PIM2 to inhibit the activation of caspase 3
PC maturation is a continuum that runs from PBs to fully mature, long-lived PCs such as those residing in the bone marrow (BM) niche, in which cell survival depends on various extrinsic factors.33 A comparison of various tonsil-derived B-cell populations, PBs, and BM PCs revealed that the level of PIM2 expression increased along the maturation pathway (Figure 6A). On paraffin-embedded BM biopsy specimens, staining experiments revealed that virtually all BM PCs (detected either with CD138 or B-cell maturation antigen markers) were strongly positive for PIM2 (Figure 6B; supplemental Figure 6A-B).
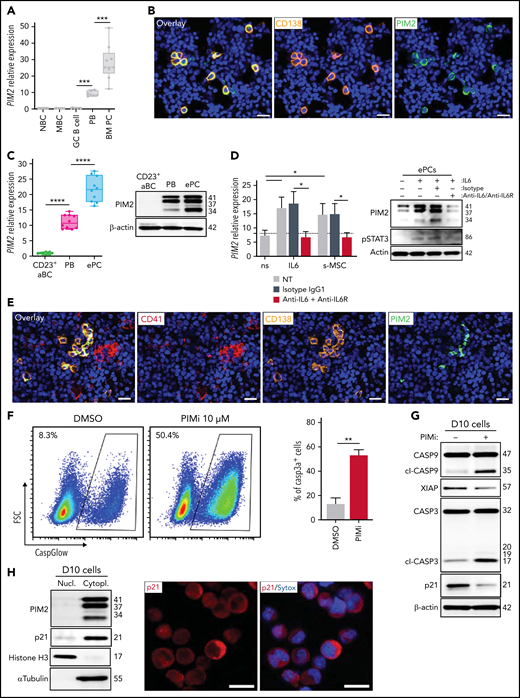
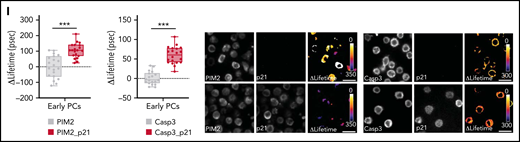
PIM2 in BM plasma cells. (A) PIM2 mRNA expression in different tonsil-derived B-cell populations (n = 7) and in BM PCs (n = 9). The data are presented as the median (range). (B) Immunofluorescence staining of PIM2 (green) and CD138 (orange) on paraffin-embedded normal BM. 4′,6-Diamidino-2-phenylindole (blue) stains the nucleus. Scale bar: 20 µm. (C) PIM2 mRNA and PIM2 protein expression in CD23+ aBCs and PBs on D6 and ePCs on day 10 (D10). Data are presented as the median (range), n = 10. (D) On D10, ePCs were sorted, starved, and treated (or not) with an anti–IL6R monoclonal antibody 1 hour before stimulation. IL-6 and supernatants of BM mesenchymal stroma cells (s-MSC) were pre-incubated (or not) for 1 hour with an anti-IL6 monoclonal antibody. PIM2 mRNA expression (left) and protein expression (right) in ePCs 5 hours after the addition of IL-6 or s-MSC. Data are presented as the mean ± SD, n = 4. (E) Immunofluorescence staining of PIM2 (green), CD41 (red), and CD138 (orange) on paraffin-embedded normal BM. 4′,6-Diamidino-2-phenylindole (blue) stains the nucleus. Scale bar: 20 µm. (F) On day 9, cells were treated with PIMi. The proportion of active caspase-3–positive cells was assessed on D10 by using flow cytometry. Data are presented as the mean ± SD, n = 6. (G) On D10, live cells were treated for 2 hours with PIMi. Protein expression levels of caspase 9, XIAP, caspase 3, and p21Cip were assessed by immunoblotting. (H) p21Cip1 expression was assessed on D10 in nuclear and cytoplasmic fractions by immunoblotting and immunofluorescence. Sytox (blue) stains the nucleus. Scale bar: 5 µm. (I) FRET/FLIM data were analyzed for ePCs stained for (the donor) PIM2 (left) or caspase 3 (right) in the presence or absence of p21Cip1 (the acceptor). The graph shows the quantified ΔLifetime. Data are presented as the median (range), n = 20 cells per condition. Pseudocolor scale, pixel-by-pixel ΔLifetime. Scale bar: 10 µm. Statistical significance was evaluated by using the Mann-Whitney U test in panels A, C, D, F, and I. *P < .05, **P < .01, ***P < .001, ****P < .0001. DMSO, dimethyl sulfoxide; FRET/FLIM, förster resonance energy transfer (FRET) by fluorescence lifetime imaging (FLIM)FSC, forward scatter; GC, germinal center; MBC, memory B cells; NBC, naive B cells; ns, not significant; NT, no treatment. Further details are presented in supplemental Figure 6.
PIM2 in BM plasma cells. (A) PIM2 mRNA expression in different tonsil-derived B-cell populations (n = 7) and in BM PCs (n = 9). The data are presented as the median (range). (B) Immunofluorescence staining of PIM2 (green) and CD138 (orange) on paraffin-embedded normal BM. 4′,6-Diamidino-2-phenylindole (blue) stains the nucleus. Scale bar: 20 µm. (C) PIM2 mRNA and PIM2 protein expression in CD23+ aBCs and PBs on D6 and ePCs on day 10 (D10). Data are presented as the median (range), n = 10. (D) On D10, ePCs were sorted, starved, and treated (or not) with an anti–IL6R monoclonal antibody 1 hour before stimulation. IL-6 and supernatants of BM mesenchymal stroma cells (s-MSC) were pre-incubated (or not) for 1 hour with an anti-IL6 monoclonal antibody. PIM2 mRNA expression (left) and protein expression (right) in ePCs 5 hours after the addition of IL-6 or s-MSC. Data are presented as the mean ± SD, n = 4. (E) Immunofluorescence staining of PIM2 (green), CD41 (red), and CD138 (orange) on paraffin-embedded normal BM. 4′,6-Diamidino-2-phenylindole (blue) stains the nucleus. Scale bar: 20 µm. (F) On day 9, cells were treated with PIMi. The proportion of active caspase-3–positive cells was assessed on D10 by using flow cytometry. Data are presented as the mean ± SD, n = 6. (G) On D10, live cells were treated for 2 hours with PIMi. Protein expression levels of caspase 9, XIAP, caspase 3, and p21Cip were assessed by immunoblotting. (H) p21Cip1 expression was assessed on D10 in nuclear and cytoplasmic fractions by immunoblotting and immunofluorescence. Sytox (blue) stains the nucleus. Scale bar: 5 µm. (I) FRET/FLIM data were analyzed for ePCs stained for (the donor) PIM2 (left) or caspase 3 (right) in the presence or absence of p21Cip1 (the acceptor). The graph shows the quantified ΔLifetime. Data are presented as the median (range), n = 20 cells per condition. Pseudocolor scale, pixel-by-pixel ΔLifetime. Scale bar: 10 µm. Statistical significance was evaluated by using the Mann-Whitney U test in panels A, C, D, F, and I. *P < .05, **P < .01, ***P < .001, ****P < .0001. DMSO, dimethyl sulfoxide; FRET/FLIM, förster resonance energy transfer (FRET) by fluorescence lifetime imaging (FLIM)FSC, forward scatter; GC, germinal center; MBC, memory B cells; NBC, naive B cells; ns, not significant; NT, no treatment. Further details are presented in supplemental Figure 6.
To characterize the regulation and functional contribution of PIM2 in mature PCs, we adapted our cell culture model so that it produced nonproliferating CD138+ PCs (supplemental Figure 6C-F), in line with reports on an early PC (ePC) phenotype.34,35 As was the case in BM PCs, high levels of PIM2 mRNA and protein expression were observed in ePCs (Figure 6C). This expression was driven by IL-6 via STAT3 signaling and by the supernatant from a mesenchymal stromal cell culture (Figure 6D). As expected, the addition of anti–IL-6 and anti–IL-6 receptor antibodies to the cell culture prevented the induction of PIM2. In this context, we observed clusters of CD138+/PIM2+ PCs in some areas on BM biopsy specimens, close to CD41+ megakaryocytes, cells known to produce large amounts of IL-6 and participating in PC BM niche (Figure 6E).33
Treatment of ePCs with PIMi induced an elevation of activated caspase 3 levels, and immunoblot experiments confirmed the increase in mitochondrial depolarization and the execution of apoptosis (Figure 6F-G). PIMi treatment also led to a significant decrease in p21Cip1 levels (Figure 6G). Interestingly, ePCs (as in some BM PCs) only expressed p21Cip1 in the cytoplasm (Figure 6H; supplemental Figure 6G), and FRET experiments revealed that PIM2 interacted with p21Cip1 as well as p21Cip1 with caspase 3 (Figure 6I).
Taken as a whole, our data show that PIM2 is still required in quiescent PCs to protect cells from caspase 3 activation; PIM2 acts at various levels and notably stabilizes cytoplasmic p21Cip1.
BH3 mimetics and PIM2 inhibitors have synergistic effects in MM
Although the involvement of PIM2 in MM has been recognized for more than a decade, our present findings prompted us to further investigate the status of PIM2 in malignant PCs. Data from the DepMap Project showed that mRNA expression of PIM2 (but not of PIM1) was elevated in MM cells compared with other tumor cells, whereas CRISPR screening revealed a specific high PIM2 dependency score for malignant PCs (Figure 7A-B; supplemental Figure 7A). BM biopsy results from patients with MM revealed intense, widespread expression of PIM2 (Figure 7C). Data from the University of Arkansas Total Therapy 2 (TT2) MM cohort showed the strongest PIM2 expression levels in the high-risk molecular subgroups (supplemental Figure 7B).36 An analysis of data from 765 patients in the multiple myeloma research fundation CoMMpass Study cohort showed that PIM2 expression was significantly elevated in high-risk cytogenetic subgroups and low in low-risk subgroups (supplemental Figure 7C).37,38 In addition, high PIM2 expression patients compared with the PIM2low group had a worse survival probability (Figure 7D). This is in line with small conditional RNA-seq data on malignant PCs from patients resistant to the carfilzomib-daratumumab combination therapy, which presented higher PIM2 expression (supplemental Figure 7D).39 Likewise, we observed a significant increase in PIM2 expression in cells from an in-house cohort of 14 patients with disease progression soon after first-line treatment (supplemental Figure 7E). Collectively, these data suggest that the severity of MM is associated with PIM2 expression levels.
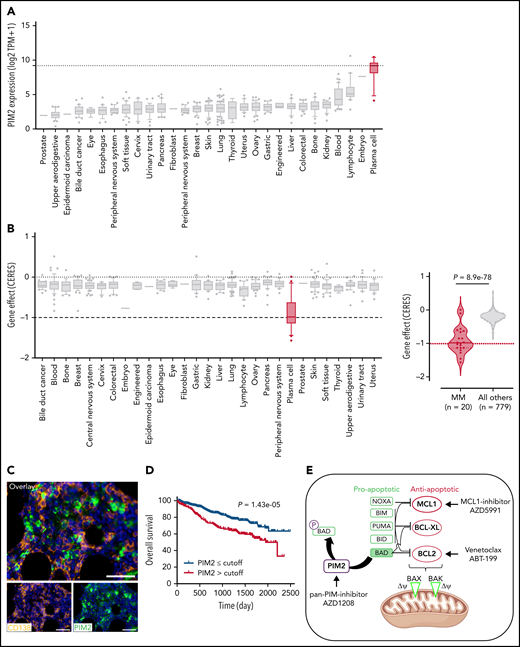
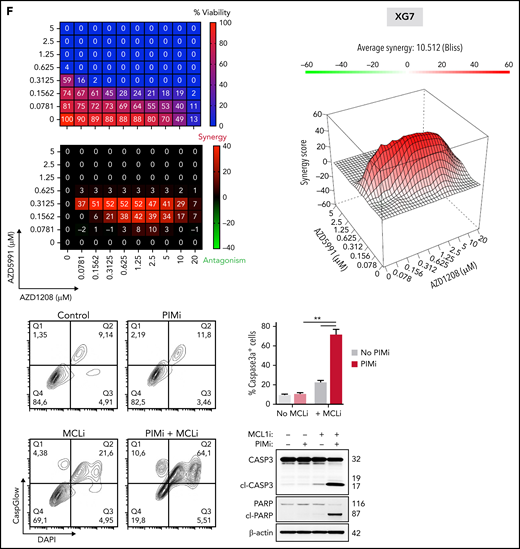
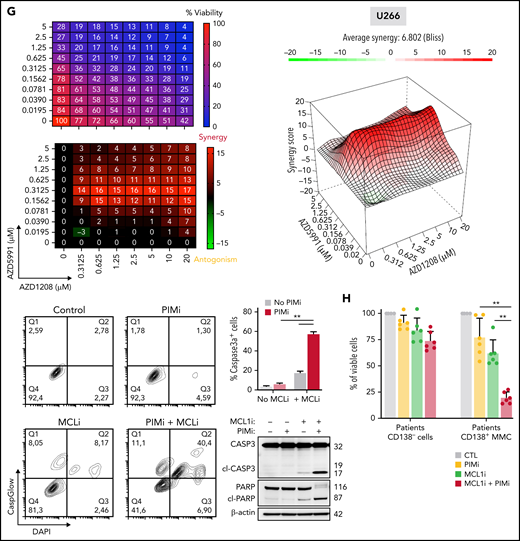
Reconsideration of PIM2 as an effective target in MM. (A) PIM2 gene expression in cell lines derived from various solid and blood cancers (https://depmap.org/portal/). (B) CRISPR screening data from the DepMap Project show that PIM2 presents the highest dependency score for the 20 tested MM cell lines, relative to other cell lines. (C) Immunohistofluorescence staining of PIM2 (green) and CD138 (orange) in paraffin-embedded BM from patients with MM. 4′,6-diamidino-2-phenylindole (blue) stains the nucleus. Scale bars: 20 µm (top); 50 µm (bottom). (D) Overall survival of patients from the CoMMpass cohort as a function of PIM2 expression (PIM-high group, n = 539; PIM-low group, n = 227). The expression cutoff was determined by applying the MaxStat package (cutoff = 313.02). (E) Effects of BH3 mimetics and PIMi on apoptosis. BH3 mimetics (eg, MCL1i, venetoclax) inhibit the binding of antiapoptotic molecules (MCL1 and BCL2, respectively) to the pro-apoptotic effectors BAK and BAX; this leads to mitochondrial depolarization and, ultimately, cell apoptosis. PIMi enhances the action of BAD: BAD binds to BCL2 and BCL-XL and therefore acts independently of MCL1i. The combination of these 2 compounds might result in greater activation of BAX and BAK and may increase the likelihood of cell death. (F-G) Left: The results of a cell viability assay and a synergy analysis after treatment with increasing concentrations of AZD1208 (PIMi) and AZD5991 (MCL1i) in XG7 cells (F) and U266 cells (G). Right: Flow cytometry assessment of apoptosis using 4′,6-diamidino-2-phenylindole (DAPI)/CaspGlow staining and immunoblotting for the detection of caspase 3 and PARP cleavage, after treatment of XG7 cells (panel F) and U266 cells (panel G) with selected doses of inhibitors. The bar plot shows the percentage of caspase 3–active positive cells. Data are presented as the mean ± SD, n = 5. (H) Flow cytometry assessment of viability for primary cells from 6 patients with MM. The bar plot shows the percentage of viable CD138+ MM cells and CD138– cells, relative to a control (set to 100%) after treatment with the selected doses of inhibitor. Statistical significance was evaluated by using the Mann-Whitney U test in panels F, G, and H. **P < .01. See also supplemental Figure 7.
Reconsideration of PIM2 as an effective target in MM. (A) PIM2 gene expression in cell lines derived from various solid and blood cancers (https://depmap.org/portal/). (B) CRISPR screening data from the DepMap Project show that PIM2 presents the highest dependency score for the 20 tested MM cell lines, relative to other cell lines. (C) Immunohistofluorescence staining of PIM2 (green) and CD138 (orange) in paraffin-embedded BM from patients with MM. 4′,6-diamidino-2-phenylindole (blue) stains the nucleus. Scale bars: 20 µm (top); 50 µm (bottom). (D) Overall survival of patients from the CoMMpass cohort as a function of PIM2 expression (PIM-high group, n = 539; PIM-low group, n = 227). The expression cutoff was determined by applying the MaxStat package (cutoff = 313.02). (E) Effects of BH3 mimetics and PIMi on apoptosis. BH3 mimetics (eg, MCL1i, venetoclax) inhibit the binding of antiapoptotic molecules (MCL1 and BCL2, respectively) to the pro-apoptotic effectors BAK and BAX; this leads to mitochondrial depolarization and, ultimately, cell apoptosis. PIMi enhances the action of BAD: BAD binds to BCL2 and BCL-XL and therefore acts independently of MCL1i. The combination of these 2 compounds might result in greater activation of BAX and BAK and may increase the likelihood of cell death. (F-G) Left: The results of a cell viability assay and a synergy analysis after treatment with increasing concentrations of AZD1208 (PIMi) and AZD5991 (MCL1i) in XG7 cells (F) and U266 cells (G). Right: Flow cytometry assessment of apoptosis using 4′,6-diamidino-2-phenylindole (DAPI)/CaspGlow staining and immunoblotting for the detection of caspase 3 and PARP cleavage, after treatment of XG7 cells (panel F) and U266 cells (panel G) with selected doses of inhibitors. The bar plot shows the percentage of caspase 3–active positive cells. Data are presented as the mean ± SD, n = 5. (H) Flow cytometry assessment of viability for primary cells from 6 patients with MM. The bar plot shows the percentage of viable CD138+ MM cells and CD138– cells, relative to a control (set to 100%) after treatment with the selected doses of inhibitor. Statistical significance was evaluated by using the Mann-Whitney U test in panels F, G, and H. **P < .01. See also supplemental Figure 7.
Drug resistance is the greatest challenge in MM. It might be possible to overcome this obstacle by acting at the mitochondrial level and lowering the threshold for triggering mitochondrial apoptosis.40 Venetoclax is reportedly effective in BCL2-translocated MM patients.41 Furthermore, myeloid cell leukemia-1 (MCL1) is also an attractive target in MM41,42 because of its essential effects on PC survival via inactivation of the pro-apoptotic multidomain of BAX and BAK effectors.43 However, in contrast to BCL2 and BCL-xL, MCL1 activity is not antagonized by BAD.44 Interestingly, data from the TT2 MM cohort showed that the expression levels of MCL1 and PIM2 are significantly correlated (supplemental Figure 7F). We hypothesized that targeting both PIM2 and MCL1 might have synergistic effects on mitochondria depolarization because the 2 proteins act at different levels (Figure 7E). To this end, we first evaluated the respective effects of PIMi,45 an MCL1 inhibitor (AZD5991, referred to hereafter as MCL1i)46 alone and then when combined. The XG7 and RPMI8226 cell lines were sensitive to MCL1i but the U266 cells were not (supplemental Figure 7G). Low-dose treatment with PIMi greatly enhanced the response to MCL1i in XG7 and RPMI8226 cells (Figure 7F; supplemental Figure 7H). Interestingly, U266 cells (resistant to PIMi alone and MCL1i alone) became sensitive when the drugs were combined (Figure 7G). Lastly, PIMi and MCL1i had synergistic effects on primary MM cells from 6 patients without effect on CD138– cells (Figure 7H).
Taken as a whole, these results confirmed that the mitochondrial control of PIM2 is similar in normal and malignant PCs; this finding opens up novel treatment options in MM.
Discussion
The processes by which committed B cells and nascent PBs switch from one molecular program to another had not previously been fully characterized. Here, our experiments with human primary B cells showed that PIM2 kinase is a pivotal factor for the generation and maintenance of PB and PC populations. In particular, our results show how committed B cells reenter the cell cycle after their proliferation burst and, under subsequently restricted culture conditions, express high levels of PIM2 and thus decrease mitochondrial apoptosis.
Our molecular characterization provided strong evidence of the regulation of PIM2 gene expression and illustrates the status of PIM2 as a true PC-identity gene recruited at the same time as PRDM1 and IRF4, once BACH2 repression has been released. In prePBs and PBs, both IL-10 and IL-21 cytokines drive PIM2 expression via pSTAT3 signaling and (in PCs) by IL-6, which establishes a direct link between growth factor–induced transcription and a kinase-dependent pathway that promotes survival and cell cycle reentry.
The cell cycle provides windows of opportunity for chromatin remodeling and thus gene activation.47 Committed B cells increase their expression of CDC25A, and in parallel PIM2 helps to stabilize the CDC25A protein and thus prompts cells to enter the S phase and progress to the PB state independently of effects on apoptosis.22 Interestingly, promotion of the cell cycle by PIM2 is accentuated by the degradation of cytoplasmic p27Kip1, which prevents the latter from accumulating or returning to the nucleus. Indeed, the effect of PIM2 on p27Kip1 is mediated by the phosphorylation of threonine 198 residue, consistent with the known cytoplasmic localization of p(Thr198)-p27Kip1 and its binding to 14-3-3 leading to its proteasomal degradation.48 In contrast, in PCs, p27Kip1 accumulated in the nucleus, independently of high PIM2 expression, to halt the cell cycle and so without being degraded by cytoplasmic PIM2.
Caspases 9 and 3 become resistant to activation by apoptotic stimuli when B cells differentiate into PBs, and the apoptosis of short-lived PCs in vitro and in vivo is largely independent of the key apoptotic caspases.49 Our present results provide insights into the mechanisms whereby B-cell death is avoided, despite intense expression of cell death–related genes in committed cells,4 allowing PB generation and survival. Production of pBAD helps to maintain the integrity of mitochondria, as evidenced by increased XIAP expression and the overall inhibition of caspase 3 self-activation. Knockdown and dose-dependent experiments have shown that this mitochondrial adaptation is mediated and made possible by high levels of PIM2 expression and its binding activity to BAD; this is in line with data from constitutive PIM2 expression models, with the detection of pBAD, its binding to 14-3-3, and inhibition of BAD/BCL-XL binding.10,50
One of the ways in which PIM2 regulates apoptosis during the differentiation of B cells into PBs involves restricting p21Cip1 to the cytoplasm. During this step, cells progress from G1 to S and proliferate; hence, the cytoplasmic expression of p21Cip1 makes sense because its presence in the nucleus blocks cells in G1.51 However, further investigations on quiescent PC populations show that p21Cip1 stays in the cytoplasm, which sheds light on its pleotropic functions. In PBs, PIM2 stabilizes cytoplasmic p21Cip1 by promoting the formation of a complex with heat shock protein 90β and thus reducing the proteasomal degradation of p21Cip1. Interestingly, p21Cip1 also binds to procaspase 3 in a PIM2-dependent manner, and FRET experiments showed that the addition of PIMi abrogated binding of p21Cip1 to procaspase 3. In PBs, PIM2 acts by promoting the formation of a multiprotein complex, which inhibits the caspase 3 activation. This effect complements the production of pBAD and the inhibition of mitochondrial depolarization and shows that PIM2 acts in several ways to ensure the survival of PBs.
Entry into cell cycle quiescence accompanies the final phenotypic maturation of PCs and requires CDK inhibitors regulated by IL-6.52 By modifying the culture conditions, we obtained fully mature PCs that strongly expressed PIM2 and absolutely required IL-6. At the cellular level, the antiapoptotic effects of PIM2 were characterized by maintenance of mitochondrial integrity and promotion of caspase 3/p21Cip1 binding. Although it is now accepted that viability is not an intrinsic property of BM PCs but is conferred on the cells by their immediate environment,53 our present observations of marked expression of PIM2 in BM PCs suggest that this kinase has a crucial role in long-term cell survival and might be involved in the functional activity of the PC niche through IL-6–dependent crosstalk between the cell and its microenvironment.54
Our results revealed a hitherto unexpected role of PIM2 kinase in terminal B-cell differentiation and, more generally, the biology of the PCs. The pleotropic effects of PIM2 kinase enable the cell to modify its regulation of apoptosis and to promote survival when faced with protein secretion overload. The data from the DepMap Project show that malignant PCs are “addicted” to PIM2, and elevated PIM2 expression in the most severe cases of MM suggests that PIM2 is linked to clinical severity. Small-molecule inhibitors of PIM have produced some encouraging results in preclinical models and recently in MM patients with relapsed and/or refractory disease.55 Indeed, and despite a relative low objective response rate (partial response or better), in patients who reached the recommended dose of treatment, PIM447 drug exhibited single-agent antitumor activity with a significant improvement of the median progression-free survival and the rate of clinical benefit. However, BM examination of patients failed to reveal a clinically significant reduction in malignant PCs, suggesting that PIM447 exerted antitumor responses via cytostatic rather than apoptotic mechanisms.55 Taking into account that MM tumor cells increase their dependence on MCL1 during the course of the disease,41 we could speculate that MCL1 could counteract the induction of cell death by PIMi. In the context of the PIM447 clinical trial,55 antiproliferative effects could appear at low doses, whereas cell death would require dose escalation, possibly with unacceptable toxicities, to counterbalance MCL1 dependency. Given that the action of MCL1 on the mitochondrial membrane is independent of BAD, dual pharmacologic inhibition of PIM2 and MCL1 is highly synergistic; low doses of PIMi significantly increased the efficacy of the anti-MCL1 drug. Interestingly, this drug combination can reverse the primary resistance of U266 cells to MCL1i and PIMi.
In conclusion, our present results showed that the final transcriptional modifications in B cells committed to differentiation into PBs are associated with the expression of a set of crucial genes, including PIM2. The newly established adaptive status of the generated PBs is maintained in mature PCs. Lastly, we showed that the antiapoptotic effects PIM2 kinase should be further investigated in the context of novel treatment strategies in MM.
Acknowledgments
Cell sorting was performed at the Biosit Flow Cytometry and the CytomeTRI cell-sorting facilities (UMS6480 Biosit). The authors are indebted to the Centre de Ressources Biologiques–Santé (BB-0033-00056; http://www.crbsante-rennes.com) at Rennes University Medical Center for its help with processing biological samples, and they also thank several clinicians and patients for providing samples for research purposes. The authors thank the MMRF (Multiple Myeloma Research Foundation) for sharing biological and clinical data for patients enrolled in the CoMMpass study via the MMRF genomics portal.
M.H. has received a doctoral fellowship from FHU CAMIn, Ligue Contre le Cancer/Comité d’Ile et Vilaine. A.P. received a fellowship from Région Bretagne and Ligue Nationale contre le Cancer. Immunofluorescence studies were performed at the Microscopy Rennes imaging center (MRic) and in the H2P2 facility, both of which are members of the UMS 6480 Biosit and the French national France-BioImaging infrastructure network funded by the French Research Agency (ANR-10-INBS-04). Funding support for this article was provided by the an internal grant from the Hematology Laboratory, university hospital of Rennes, and la Ligue contre le Cancer Région Grand Ouest.
Authorship
Contribution: M.H. designed and conducted the experiments and wrote the paper; G.C. designed the cell differentiation model and performed cytometry and cell sorting; F.C. performed genomic analysis; E.A. performed chromatin immunoprecipitation–quantitative PCR STAT3 experiments; J.D. performed drug combination experiments; A.P. performed single-cell quantitative PCRs; C.D. helped with BACH2 assays and discussed results; S.M. performed CDC25A immunoblotting; G.B. performed FRET experiments; R.V. performed immunostaining; F.L.-G. provided BM biopsy specimens; A.M. designed morpholino SSO; O.D. provided MM samples; K.T. discussed results; L.D. provided the antisense strategy; J.M. provided cell lines and original data; and T.F. designed and supervised the experiments and wrote the paper.
Conflict-of-interest disclosure: M.H., G.C., A.M., L.D., J.M., and T.F. have applied for a European patent on the use of an SSO to modulate PIM2 expression. The remaining authors declare no competing financial interests.
Correspondence: Thierry Fest, INSERM U1236, Faculté de Médecine, 2 avenue du Pr Léon Bernard, CS 34317, 35043 Rennes Cedex, France; e-mail: thierry.fest@univ-rennes1.fr.
Raw data are accessible in the Gene Expression Omnibus database (accession number GSE136990).
The online version of this article contains a data supplement.
The publication costs of this article were defrayed in part by page charge payment. Therefore, and solely to indicate this fact, this article is hereby marked “advertisement” in accordance with 18 USC section 1734.

This feature is available to Subscribers Only
Sign In or Create an Account Close Modal