

The authors identified several instances of duplicated or incorrect representative flow cytometry plots resulting from errors in figure preparation. Gate percentages and mean fluorescence intensities listed on each plot are correct for the experimental condition; only the images are in error. The numerical or graphical summary data and the interpretation of the findings are also unaffected.
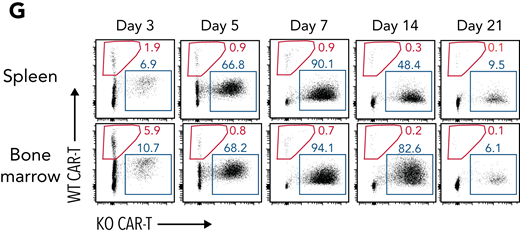
Page 124, Figure 1G: The spleen day 21 flow image is a duplicate of the spleen day 14 plot. The corrected Figure 1G is shown below.
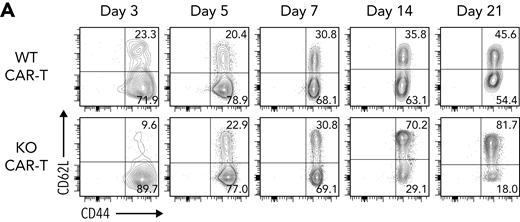
Page 126, Figure 2A: The KO CAR-T day 21 flow image is a duplicate of the WT CAR-T day 21 plot. The corrected Figure 2A is shown below.
Page 128, Figure 3B: The KO CAR-T with tumor flow image is incorrect. The corrected Figure 3B is shown below.

Supplemental Figure 1B: The CAR-Tg thymus flow image is a duplicate of the control thymus image, and the CD4 and CD8 axes are mislabeled. The CD8 SP flow image is also a duplicate of the CD4 SP image.
Supplemental Figure 1C: The ex vivo CD4+ flow image is a duplicate of the CD8+ image.
Supplemental Figure 2B: The KO CAR-T day 7 flow image is a duplicate of the WT CAR-T day 7 image.
The authors apologize for these errors, which have been corrected in the online version of the article and supplemental File 1.

This feature is available to Subscribers Only
Sign In or Create an Account Close Modal