

Key Points
Baseline cytopenia and inflammatory state are associated with prolonged neutropenia after CAR T-cell therapy in the real-world setting.
The CAR-HEMATOTOX represents an easy-to-use risk-stratification tool that is helpful in ruling out patients at risk of hematotoxicity.

Abstract
Hematotoxicity represents a frequent chimeric antigen receptor (CAR) T-cell–related adverse event and remains poorly understood. In this multicenter analysis, we studied patterns of hematopoietic reconstitution and evaluated potential predictive markers in 258 patients receiving axicabtagene ciloleucel (axi-cel) or tisagenlecleucel (tisa-cel) for relapsed/refractory large B-cell lymphoma. We observed profound (absolute neutrophil count [ANC] <100 cells per µL) neutropenia in 72% of patients and prolonged (21 days or longer) neutropenia in 64% of patients. The median duration of severe neutropenia (ANC < 500 cells per µL) was 9 days. We aimed to identify predictive biomarkers of hematotoxicity using the duration of severe neutropenia until day +60 as the primary end point. In the training cohort (n = 58), we observed a significant correlation with baseline thrombocytopenia (r = −0.43; P = .001) and hyperferritinemia (r = 0.54; P < .0001) on univariate and multivariate analysis. Incidence and severity of cytokine-release syndrome, immune effector cell–associated neurotoxicity syndrome, and peak cytokine levels were not associated with the primary end point. We created the CAR-HEMATOTOX model, which included markers associated with hematopoietic reserve (eg, platelet count, hemoglobin, and ANC) and baseline inflammation (eg, C-reactive protein and ferritin). This model was validated in independent cohorts, one from Europe (n = 91) and one from the United States (n = 109) and discriminated patients with severe neutropenia ≥14 days to <14 days (pooled validation: area under the curve, 0.89; sensitivity, 89%; specificity, 68%). A high CAR-HEMATOTOX score resulted in a longer duration of neutropenia (12 vs 5.5 days; P < .001) and a higher incidence of severe thrombocytopenia (87% vs 34%; P < .001) and anemia (96% vs 40%; P < .001). The score implicates bone marrow reserve and inflammation prior to CAR T-cell therapy as key features associated with delayed cytopenia and will be useful for risk-adapted management of hematotoxicity.
Introduction
Genetically engineered chimeric antigen receptor (CAR) T lymphocytes incorporate antigen-recognition moieties that specifically redirect the immune effector cells against a target antigen such as CD19.1-3 Although the emergence of this form of adoptive immunotherapy has dramatically improved response rates in relapsed/refractory (R/R) B-cell malignancies,4,5 its utility is hampered by a unique toxicity profile.6-8 Although much attention has been paid to cytokine-release syndrome (CRS) and immune effector cell–associated neurotoxicity syndrome (ICANS) as novel immune-related adverse events with distinctive management protocols,9 hematotoxicity has evolved as the most common long-term CAR T-cell–related adverse event in the real-world clinical setting.10 Importantly, the underlying pathophysiologic mechanism remains unclear.
Previous studies have reported a notably high incidence of cytopenia after CAR T-cell therapy.1,2,10-12 A unique aspect of hematotoxicity is its often-prolonged nature and biphasic temporal course.12,13 Although the definitions of prolongation and severity of cytopenia vary across studies, a high incidence of persistent grade ≥3 neutropenia (30% to 38%), thrombocytopenia (21%-29%), and anemia (5% to 17%) after day 21 has been reported, as defined by the Common Terminology Criteria of Adverse Events (CTCAE).11,12,14,15 In a long-term follow-up study of patients with ongoing complete response and absence of myelodysplasia, 16% of patients experienced prolonged significant cytopenia that lasted up to 22 months after CAR T-cell transfusion.16 Overall, these clinical observations strongly suggest that the phenomenon cannot be explained by the myelotoxic effect of fludarabine-cyclophosphamide lymphodepletion alone. Risk factors that have been implicated in hematotoxicity include the grade of CRS and ICANS, baseline cytopenia, previous allogeneic stem cell transplantation within the last year, and alterations of stromal cell–derived factor 1 (SDF-1) levels.12,17 Importantly, the prolonged nature of neutropenia can predispose for significant infectious complications,18,19 and infection represents the most frequent cause of nonrelapse mortality.20 Risk of infection is further compounded by B-cell aplasia and hypogammaglobulinema as on-target/off-tumor toxicities of CD19-directed CAR T-cell therapy.21
Of note, the study population analyzed in the key registration trials was subject to restrictive hematologic exclusion criteria, including an absolute neutrophil count (ANC) <1000 cells per µL, low platelet count (ZUMA-1 trial, <75 000/µL; JULIET trial, <50 000/µL), and hemoglobin <8 g/dL (JULIET).1,2 Thus, the frequency of cytopenia may have been underestimated in the pivotal clinical trials. Moreover, clinical tools to aid in risk stratifying CAR T-cell–mediated hematotoxicity are lacking. We aimed to characterize the influence of clinical and laboratory features on neutropenia and to develop a clinical score that discriminates between a high and a low risk for hematotoxicity.
Methods
Patients and data collection
In this multicenter retrospective observational study, hematotoxicity was studied in 258 patients receiving axicabtagene ciloleucel (axi-cel) or tisagenlecleucel (tisa-cel) in a real-world setting. This included 58 patients in the training cohort, 91 patients in a European validation cohort, and 109 patients in a second independent US validation cohort. For baseline values (eg, before lymphodepletion) a leniency period of up to 3 days for laboratory markers and 1 month for bone marrow (BM) infiltration was permitted. Patients received fludarabine-cyclophosphamide lymphodepletion according to the manufacturers’ instructions.1,2 Clinical metadata were collected with approval from the institutional review boards and informed consent from the patients. Patients were excluded from the analysis because of early death or progressive disease that necessitated systemic chemotherapy before day 30, with the exclusion of salvage therapies not thought to alter hematopoiesis or diminish CAR T-cell function (eg, immune checkpoint blockade).22,23 The temporal analysis of aggregated blood counts included all European patients until censoring or day 120 (n = 149). For analysis of the primary end point, the intervening days between outpatient follow-ups were added to the cumulative total days of severe neutropenia only if both values were below the ANC threshold of 500 cells per µL and the studied time frame was 60 days. CRS and ICANS were graded according to American Society for Transplantation and Cellular Therapy (ASTCT) consensus criteria.9
Defining CAR T-cell–mediated hematotoxicity
The complete blood count and differential were graded according to clinical trial criteria (CTCAE v4.03). On the basis of the joint American Society of Clinical Oncology/Infectious Diseases Society of America (ASCO/IDSA) consensus guidelines for cancer-related infection risk, we defined neutropenia as severe (ANC <500 cells per µL), profound (ANC <100 cells per µL), and protracted (lasting ≥7 days).24 We defined prolonged neutropenia as an ANC <1000 cells per µL measured ≥21 days after CAR T-cell transfusion, which was contingent on patients not receiving further myelosuppressive chemotherapy. Severe thrombocytopenia was defined as platelet counts <50 g/L. Severe anemia was defined as hemoglobin ≤8 g/dL or anemia requiring transfusion with packed red blood cells. The clinical phenotypes of neutrophil recovery were defined as (1) quick recovery: sustained neutrophil recovery without a second dip below an ANC <1000 cells per µL; (2) intermittent recovery: neutrophil recovery (ANC >1500 cells per µL) followed by a second dip with an ANC <1000 cells per µL after day 21; or (3) aplastic: continuous severe neutropenia (ANC <500 cells per µL) for ≥14 days.
CAR-HEMATOTOX modeling
Univariate analyses were performed via simple linear regression for variables on a continuous scale and by logarithmic regression for binary variables. To identify clinical features associated with a prolonged duration of neutropenia, we studied receiver operating characteristic (ROC) curves for the outcome of severe neutropenia lasting for ≥14 days. To reduce the number of predictor variables, only the baseline factors with an area under the curve (AUC) >0.6, concomitant P ≤ .1, and odds ratio (OR) ≥2.5 were used for statistical modeling. This yielded the following variables: ANC, hemoglobin, platelet count, C-reactive protein (CRP), and ferritin. Three models were tested.
In model 1, the discriminatory threshold for each variable was determined by optimizing the respective Youden J statistic (sensitivity + specificity – 1) using binary logistic regression analysis for the outcome of severe neutropenia ≥14 vs <14 days. A specificity cutoff of at least 0.75 was required. Model 2 employed a multivariate analysis with a stepwise backward elimination (probability for stepwise entry, 0.05; removal, 0.1). The retained factors, platelet count and ferritin, were additionally weighted. A first point was given according to a sensitivity cutoff of 0.8, and a second point was given according to a specificity cutoff of 0.85. The integrative third model termed CAR-HEMATOTOX featured the 5 baseline hematotoxicity biomarkers with additional weighting of both platelet count and ferritin, as in the second model. The optimal discriminatory threshold for each model was determined by optimizing the respective Youden J statistic. Model performance was assessed by calculating the AUC of the ROC curve and concomitant OR. The best model was tested in the independent validation cohorts.
Statistical analysis
Statistical significance (P < .05) between groups was determined by nonparametric Mann-Whitney U test for absolute values and Fisher’s exact test for comparison of percentages. Associations between continuous variables were analyzed by using the Spearman correlation coefficient (r). Kaplan-Meier curves were used to display progression-free survival (PFS) and overall survival (OS). GraphPad Prism v8.0 or SPSS was used for statistical analysis (see supplemental Methods, available on the Blood Web site).
Results
The incidence of CAR T-cell–mediated hematotoxicity in the real-world setting is high
Between May 2018 and June 2020, the incidence and clinical features of CAR T-cell–mediated hematotoxicity were assessed in 258 patients with R/R B-cell lymphoma treated with the commercial CD19-specific CAR T-cell products axi-cel (n = 170) and tisa-cel (n = 88). Of the 258 transfused patients, we excluded 17 patients from the final analysis because of early progressive disease or death, 5 patients because of incomplete or missing data points, and an additional patient because of loss to follow-up (Figure 1A). Thus, the remaining 235 patients were studied for the primary end point, which was the duration of clinically significant neutropenia (defined as ANC < 500 cells per µL between days 0 and 60). Patient characteristics are provided in Table 1 and supplemental Table 1. The indication for CAR T-cell therapy was R/R diffuse large B-cell lymphoma (n = 176), transformed B-cell lymphoma (n = 67), and primary mediastinal B-cell lymphoma (n = 15) and was balanced between the cohorts. The patients had received a median of 3 previous lines of treatment before apheresis, including 27% of patients with previous autologous stem cell transplantation, reflecting the heavily pretreated nature of this patient population. Of note, 71 patients (28%) who were treated within European Medicines Agency/US Food and Drug Administration (EMA/FDA) labeling would not have met the stringent hematologic exclusion criteria set in the key registration trials, which highlights differences between patients treated in the pivotal trials and after approval.20,25 Severe (grade ≥3) CRS and ICANS occurred in 11% and 17% of patients, respectively, consistent with previous reports (supplemental Table 2).6,20,26,27

Incidence and temporal course of CAR T-cell–mediated hematotoxicity. (A) Cohort description: the primary end point could not be evaluated because of early death (n = 17), incomplete data collection (n = 5), or loss to follow-up before neutrophil recovery and day 60 (n = 1). (B) Proportional incidence of severe anemia (hemoglobin ≤8 g/dL or requiring transfusion), severe thrombocytopenia (platelet count ≤50 g/L), and severe neutropenia (ANC <500 cells per µL; light green) in all patients in the study (n = 235). Neutropenia was further subdivided into protracted (≥7 days) and prolonged (ANC < 1000 cells per µL after day 21). The darker shade of green indicates profound (ANC < 100 cells per µL) neutropenia. (C) Aggregated median ANC over time for 149 patients from the European training and validation cohorts (longitudinal complete blood count sampling was not obtained for the US validation cohort). Measured events per time point are provided in supplemental Table 3. Light shading depicts the 95% confidence intervals (CIs) of the median for each time point. Fludarabine-cyclophosphamide lymphodepletion (LD) was administered on days −5 to −3, and CAR T-cells were transfused on day 0. (D) Aggregated median ANC curves by clinical phenotype of neutrophil recovery. The bar represents the relative distribution of phenotypes. (E-F) Aggregated median platelet count and hemoglobin over time (n = 149). Abs., absolute; LMU, Ludwig Maximilian University; PLT, platelet.
Incidence and temporal course of CAR T-cell–mediated hematotoxicity. (A) Cohort description: the primary end point could not be evaluated because of early death (n = 17), incomplete data collection (n = 5), or loss to follow-up before neutrophil recovery and day 60 (n = 1). (B) Proportional incidence of severe anemia (hemoglobin ≤8 g/dL or requiring transfusion), severe thrombocytopenia (platelet count ≤50 g/L), and severe neutropenia (ANC <500 cells per µL; light green) in all patients in the study (n = 235). Neutropenia was further subdivided into protracted (≥7 days) and prolonged (ANC < 1000 cells per µL after day 21). The darker shade of green indicates profound (ANC < 100 cells per µL) neutropenia. (C) Aggregated median ANC over time for 149 patients from the European training and validation cohorts (longitudinal complete blood count sampling was not obtained for the US validation cohort). Measured events per time point are provided in supplemental Table 3. Light shading depicts the 95% confidence intervals (CIs) of the median for each time point. Fludarabine-cyclophosphamide lymphodepletion (LD) was administered on days −5 to −3, and CAR T-cells were transfused on day 0. (D) Aggregated median ANC curves by clinical phenotype of neutrophil recovery. The bar represents the relative distribution of phenotypes. (E-F) Aggregated median platelet count and hemoglobin over time (n = 149). Abs., absolute; LMU, Ludwig Maximilian University; PLT, platelet.
Baseline demographic and clinical characteristics of patients treated with CAR T cells
| Characteristic | All patients (n = 258) | Training cohort (n = 58) | European validation cohort (n = 91) | United States validation cohort (n = 109) |
|---|---|---|---|---|
| Median age, y (range) | 63 (19-83) | 59.5 (19-74) | 62 (27-83) | 64 (19-79) |
| Median no. of previous lines of therapy (range) | 3 (2-11) | 4 (2-9) | 3 (2-9) | 3 (2-11) |
| Previous ASCT | 69 (27) | 22 (38) | 27 (30) | 20 (18) |
| CAR product | ||||
| 4-1BB (tisa-cel) | 88 (34) | 17 (29) | 51 (56) | 20 (18) |
| CD28z (axi-cel) | 170 (66) | 41 (71) | 40 (44) | 89 (82) |
| Disease entity | ||||
| DLBCL | 176 (68) | 38 (65) | 57 (63) | 81 (74) |
| PMBCL | 15 (6) | 5 (9) | 6 (6) | 4 (4) |
| Transformed lymphoma* | 67 (26) | 15 (26) | 28 (31) | 24 (22) |
| Complete blood count | ||||
| Median ANC cells per µL (95% CI) | 2540 (2310-2730) | 2005 (1620-2640) | 2320 (1840-2660) | 3050 (2540-3530) |
| Median platelet count, g/L (95% CI) | 164 (152-178) | 152.5 (118-180) | 171 (146-200) | 164 (152-178) |
| Median hemoglobin, g/dL (95% CI) | 10.1 (9.7-10.4) | 10.1 (9.5-10.3) | 10.0 (9.3-10.6) | 10.3 (9.6-11.0) |
| ANC <1000 cells per µL | 38 (15) | 12 (21) | 13 (14) | 13 (12) |
| Platelet count <75 g/L | 44 (17) | 14 (24) | 15 (16) | 15 (14) |
| Hemoglobin <8 g/dL | 32 (12) | 12 (21) | 6 (7) | 14 (13) |
| Hematologic exclusion criteria were met† | 71 (28) | 23 (40) | 24 (26) | 24 (22) |
| Median markers of tumor burden and inflammation (95% CI) | ||||
| Lactate dehydrogenase, U/L | 276 (260-302) | 271 (245-381) | 302 (273-328) | 258 (237-297) |
| C-reactive protein, mg/dL | 1.02 (0.80-1.40) | 1.55 (0.80-2.62) | 1.02 (0.76-1.50) | 0.81 (0.48-1.29) |
| Ferritin, ng/mL | 501 (378-647) | 821 (576-1203) | 454 (310-647) | 378 (289-573) |
All data represent n (%), unless otherwise specified.
ASCT, autologous stem cell transplantation; DLBCL, diffuse large B-cell lymphoma; PMBCL, primary mediastinal B-cell lymphoma.
The following types of lymphoma were transformed: chronic lymphocytic leukemia, follicular lymphoma, Hodgkin lymphoma, mucosa-associated lymphoid tissue lymphoma, and mantle cell lymphoma.
Hematologic exclusion criteria from the JULIET and ZUMA-1 trials were used for the study cohort at lymphodepletion.
In the pooled analysis, the incidence of severe CTCAE grade ≥3 neutropenia, anemia, and thrombocytopenia was 91%, 69%, and 62%, respectively (Table 2; Figure 1B). Approximately two-thirds of patients (68%) developed protracted courses of neutropenia, and 26% developed profound aplasia lasting longer than 7 days. Close to 2 out of 3 patients (64%) developed prolonged neutropenia, which persisted long after lymphodepletion and resolution of acute CRS. The median duration of severe neutropenia (ANC <500 cells per µL) was 9 days (95% confidence interval [CI], 8-10 days) and did not differ significantly by CAR T-cell product (supplemental Figure 1). The higher incidence of initial profound and protracted neutropenia with axi-cel patients likely reflects the higher doses of myelosuppressive chemotherapy used during lymphodepletion (Table 2; supplemental Figure 1).
Clinical features of CAR T-cell–mediated hematotoxicity
| Disease entity | Clinical features | Pooled (n = 235) | Training cohort (n = 55) | European validation cohort (n = 80) | P | United States validation cohort (n = 100) | P | Tisa-cel (n = 76) | Axi-cel (n = 159) | P |
|---|---|---|---|---|---|---|---|---|---|---|
| Severe thrombocytopenia | Platelet count <50 g/L | 145 (62) | 40 (73) | 52 (65) | .32 | 53 (53) | .02 | 42 (57) | 103 (64) | .31 |
| Anemia | Hemoglobin <8 g/dL or requiring transfusion | 162 (69) | 43 (78) | 54 (68) | .15 | 65 (65) | .10 | 46 (62) | 116 (72) | .13 |
| Neutropenia | ||||||||||
| Severe | ANC ≤500 cells per µL | 213 (91) | 54 (98) | 69 (86) | .009 | 90 (90) | .10 | 60 (81) | 153 (95) | .001 |
| Profound | ANC ≤100 cells per µL | 169 (72) | 47 (85) | 54 (68) | .03 | 68 (68) | .02 | 40 (54) | 129 (80) | <.001 |
| Protracted, severe | ANC ≤500 cells per µL for ≥7 days | 160 (68) | 42 (76) | 51 (64) | .11 | 67 (67) | .27 | 41 (55) | 119 (74) | .007 |
| Protracted, profound | ANC ≤100 cells per µL for ≥7 days | 60 (26) | 16 (29) | 25 (31) | .99 | 19 (19) | .16 | 11 (15) | 49 (30) | .01 |
| Prolonged | ANC ≤1000 cells per µL measured ≥21 days after CAR T-cell transfusion | 151 (64) | 43 (78) | 58 (73) | .52 | 50 (50) | <.001 | 42 (57) | 109 (68) | .11 |
| Primary end point: duration of severe neutropenia from day 0 to day 60 (95% CI) | 9 (8-10) | 12 (10-15) | 10.5 (8-14) | .14 | 8 (7-9) | <.001 | 9.5 (6-12) | 9 (8-10) | .27 | |
| Binary end point: severe neutropenia ≥14 days | 67 (29) | 22 (40) | 33 (41) | .99 | 12 (12) | <.001 | 22 (28) | 46 (29) | .99 |
The training cohort was compared with both the European and US validation cohorts. Grade 4 neutropenia, ANC <500 cells per µL; grade 3 to 4 anemia, hemoglobin <8 g/dL; grade 3 to 4 thrombocytopenia, platelet count <50 g/L. Statistical significance (P < .05) between groups was determined by Fisher’s exact two-sided t test for incidence rates and Mann-Whitney U test for the primary end point.
A biphasic temporal course with intermittent recovery represents the dominant phenotype of neutrophil recovery after CAR T-cell therapy
We next studied the dynamics of cytopenia over the first 4 months after CAR T-cell transfusion. The aggregated time course of neutropenia follows a biphasic curve with intermittent recovery upon stimulation with granulocyte colony-stimulating factor (G-CSF) around week 3 followed by a second trough in month 2 (Figure 1C; supplemental Table 3). Although the first period of neutropenia was strongly associated with the administered fludarabine-cyclophosphamide lymphodepletion (days −5 to −3) and temporally linked with the other CAR T-cell–associated immunotoxicities, the second phase was independent of any systemic myelotoxic therapy and often occurred after patients had been discharged from inpatient care. The majority of patients achieved normalization of neutrophil counts (ANC >1500 cells per µL) by the third month. Three clinical phenotypes of neutrophil recovery emerged (Figure 1D). Intermittent recovery represented the dominant phenotype (52%), whereas approximately one quarter of patients developed the quick recovery and aplastic phenotypes. At baseline, patients who developed aplasia presented with marked cytopenia, high tumor burden, and high levels of inflammation (supplemental Table 4). CAR T-cell–associated thrombocytopenia was characterized by an initial drop after lymphodepletion followed by a delayed nadir occurring in month 2 (Figure 1E). Anemia was closely linked to the myelotoxic lymphodepletion, reaching its peak in the first 2 weeks, and only a few patients remained transfusion dependent after day 30 (Figure 1F). Subgroup analyses comparing the temporal course of neutropenia and thrombocytopenia by CAR product (axi-cel vs tisa-cel) and patient cohort (training vs validation) are provided in supplemental Figure 1A-D.
Baseline cytopenia and elevated inflammatory markers are correlated with the duration of neutropenia, but CRS and ICANS severity and peak cytokine levels are not
To identify predictive biomarkers of CAR T-cell–associated hematotoxicity, we studied the association between baseline demographic, clinical, and laboratory findings and the duration of severe neutropenia. Baseline was defined as the time point before the administration of lymphodepletion. A follow-up period of 60 days was chosen to represent the phases of acute hematotoxicity and prolonged neutropenia. Baseline cytopenia was significantly linked to an increased duration of neutropenia (Figure 2A-C), which was particularly evident for the platelet count (r = −0.43; P = .001). Interestingly, the number of previous lines of treatment and age (a surrogate marker of clonal hematopoiesis28-30) were not associated with a longer duration of neutropenia (supplemental Figure 2A,E). In contrast, elevated baseline levels of the serum inflammatory markers CRP (r = 0.29; P = .03) and especially ferritin (r = 0.54; P < .001) exhibited a positive correlation with the primary end point (Figure 2D-E). Of note, serum lactate dehydrogenase levels were not associated with a longer duration of neutropenia (supplemental Figure 2H). In the 33 patients in whom the influence of BM involvement could be studied, a prolonged duration of neutropenia was observed that ranged from 12 to 61 days and reached statistical significance on logistic regression analysis (P = .009; Figure 2F). None of the other baseline factors, including baseline kidney function and fibrinogen, reached statistical significance (supplemental Figure 2).

Markers of impaired hematopoietic reserve, inflammation, and tumor microenvironment are significantly correlated with the duration of neutropenia. Univariate analysis of the influence of the baseline platelet count (A), hemoglobin (Hb) (B), ANC (C), C-reactive protein (CRP) (D), ferritin (E), and BM infiltration (F) on the duration of severe neutropenia (ANC <500 cells per µL) between days 0 and 60 in the training cohort (n = 55). The data concerning BM infiltration was studied via logistic regression analysis; P value is shown for the likelihood ratio test (G2); light shading indicates the 95% asymptotic confidence bands. (A-E) The Spearman correlation coefficient (r) and the respective P values are provided. A positive r value indicates a positive correlation and a negative r value indicates a negative correlation. Light shading indicates the 95% confidence bands of the best-fit line from the simple linear regression. B-NHL, B-cell non-Hodgkin lymphoma.
Markers of impaired hematopoietic reserve, inflammation, and tumor microenvironment are significantly correlated with the duration of neutropenia. Univariate analysis of the influence of the baseline platelet count (A), hemoglobin (Hb) (B), ANC (C), C-reactive protein (CRP) (D), ferritin (E), and BM infiltration (F) on the duration of severe neutropenia (ANC <500 cells per µL) between days 0 and 60 in the training cohort (n = 55). The data concerning BM infiltration was studied via logistic regression analysis; P value is shown for the likelihood ratio test (G2); light shading indicates the 95% asymptotic confidence bands. (A-E) The Spearman correlation coefficient (r) and the respective P values are provided. A positive r value indicates a positive correlation and a negative r value indicates a negative correlation. Light shading indicates the 95% confidence bands of the best-fit line from the simple linear regression. B-NHL, B-cell non-Hodgkin lymphoma.
The concurrent CRS and ICANS immunotoxicities exhibit a peak manifestation in the first to second week and are thus temporally linked with the first phase of acute hematologic toxicity.7,31 However, we did not find a correlation between the grade of CRS or ICANS and our primary end point (supplemental Figure 2M-N). Consistent with this observation, we did not find an association between peak interleukin-6 (IL-6) and CRP values and prolonged duration of neutropenia (supplemental Figure 2J-K). Although a positive correlation was observed for peak ferritin (r = 0.33; P = .01; supplemental Figure 2L), it was diminished compared with baseline hyperferritinemia (Figure 2E). The growth factor G-CSF was used in 74% of the patients in the training cohort and was initiated after a median of 15 days (supplemental Figure 3A). G-CSF was initiated after resolution of acute CRS or ICANS in most cases. No statistically significant correlation was observed between the use of G-CSF and higher grades of immunotoxicity, although a trend was observed for ICANS (supplemental Figure 3B-C). Severe neurotoxicity was associated with deferred initiation of G-CSF (supplemental Figure 3D), and patients with severe neurotoxicity received G-CSF after a median of 25 days compared with only 13 days for patients with low-grade neurotoxicity (P = .003; supplemental Figure 3E).
Development of the CAR-HEMATOTOX model based on the identified predictive biomarkers of hematotoxicity
We next sought to develop a risk-stratification tool for hematotoxicity by testing several models in our training cohort that combined the identified baseline clinical markers (see “Methods”; supplemental Tables 5-7). BM infiltration was excluded from modeling because it currently does not represent a standard-of-care diagnostic test before therapy initiation, and data were incomplete across the participating institutions in the training cohort.
For each laboratory parameter, we performed ROC analyses to identify and test the discriminatory capacity of varying thresholds according to measures of performance (supplemental Figure 4). The binary outcome of severe neutropenia ≥14 vs <14 days was chosen for modeling because it selected patients with aplastic features (Figure 1D) and represents a time frame associated with a significantly increased risk for infectious complications.24,32 Applying the optimal discriminatory threshold for each variable, we calculated the OR for the outcome of severe neutropenia of ≥14 days (supplemental Table 5). Compared with the other markers, both ferritin and the platelet count demonstrated the strongest impact on neutropenia. This was confirmed in a stepwise multivariate logistic regression analysis using a backward elimination (supplemental Table 6). As a result, we compared models that used simple weighting of all the identified factors with a model with additional weighting of only the 2 factors from the stepwise analysis (supplemental Figure 5), and finally with an integrative model that combined both features (Figure 3A-B). Although all 3 models demonstrated a significant correlation with the duration of severe neutropenia, the AUC and concomitant OR were largest for the integrative model (AUC, 0.82; P < .001; OR, 42.0 [95% CI, 6.0-452.1]; supplemental Table 7). This multivariable model was termed CAR-HEMATOTOX and is depicted in Figure 4.

The CAR-HEMATOTOX score identifies patients with pronounced myelosuppression after CAR T-cell therapy. (A) Univariate analysis comparing the CAR-HEMATOTOX score to the duration of severe neutropenia in the training cohort (n = 55). The calculated slope (β1) of the simple linear regression is shown. (B) ROC curve of the influence of the CAR-HEMATOTOX score on the outcome of severe neutropenia at ≥14 days. The AUC and P value are shown. (C) Median duration of severe neutropenia (days 0-60) by CAR-HEMATOTOX score with whiskers indicating the 95% CIs. (D) Relative distribution of clinical phenotypes of neutrophil recovery by CAR-HEMATOTOX score. (E-F) Aggregated median ANC (E) and platelet count (F) over time for patients with either a low or high score. The P value is provided for the comparison of the calculated AUC for high-risk vs low-risk patients (supplemental Figure 6). Mann-Whitney U test ****P < .0001.
The CAR-HEMATOTOX score identifies patients with pronounced myelosuppression after CAR T-cell therapy. (A) Univariate analysis comparing the CAR-HEMATOTOX score to the duration of severe neutropenia in the training cohort (n = 55). The calculated slope (β1) of the simple linear regression is shown. (B) ROC curve of the influence of the CAR-HEMATOTOX score on the outcome of severe neutropenia at ≥14 days. The AUC and P value are shown. (C) Median duration of severe neutropenia (days 0-60) by CAR-HEMATOTOX score with whiskers indicating the 95% CIs. (D) Relative distribution of clinical phenotypes of neutrophil recovery by CAR-HEMATOTOX score. (E-F) Aggregated median ANC (E) and platelet count (F) over time for patients with either a low or high score. The P value is provided for the comparison of the calculated AUC for high-risk vs low-risk patients (supplemental Figure 6). Mann-Whitney U test ****P < .0001.
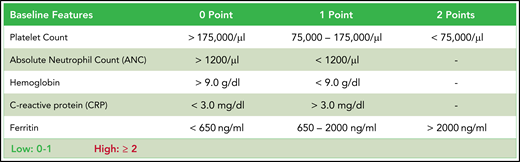
CAR-HEMATOTOX. Determined before lymphodepletion, the score comprises 5 markers of hematotoxicity with additional weighting of the baseline platelet count and ferritin levels. The score discriminates between a high (CAR-HEMATOTOX score ≥2) and low (CAR-HEMATOTOX score 0-1) risk for hematotoxicity.
CAR-HEMATOTOX. Determined before lymphodepletion, the score comprises 5 markers of hematotoxicity with additional weighting of the baseline platelet count and ferritin levels. The score discriminates between a high (CAR-HEMATOTOX score ≥2) and low (CAR-HEMATOTOX score 0-1) risk for hematotoxicity.
We tested multiple thresholds to distinguish between low and high risk for neutropenia (supplemental Table 8). We chose a threshold of 2 because of an attractive Youden Index, a high sensitivity of 95%, and a low negative likelihood ratio of 0.07. Applying this threshold, we find that patients with a high risk of neutropenia (ie, CAR-HEMATOTOX score ≥2) observed a median duration of neutropenia of 16.5 days (95% CI, 13-43 days) compared with 7 days (95% CI, 6-10 days) in patients with a low score (P < .001; Figure 3C). In low-risk patients, the quick recovery phenotype was far more frequent than the aplastic phenotype, whereas the inverse was true for high-risk patients (Figure 3D). In the training cohort, we observed a significantly higher incidence of trilineage cytopenia in patients with a high score (Table 3). High-risk patients developed more profound neutropenia, exhibited a longer neutropenic nadir, and displayed a more pronounced second dip in neutrophil counts (Figure 3E; supplemental Figure 6A). Similarly, more extensive and prolonged thrombocytopenia was observed in high-risk patients compared with their low-risk counterparts (Figure 3F; supplemental Figure 6B). A separation of curves by risk score was also observed for anemia (supplemental Figure 6E).
Incidence of CAR T-cell–associated hematotoxicity by CAR-HEMATOTOX score
| Disease entity | Clinical features | Training cohort (n = 55) | P | European validation cohort (n = 80) | P | United States validation cohort (n = 100) | P | Pooled validation (n = 180) | P | ||||
|---|---|---|---|---|---|---|---|---|---|---|---|---|---|
| High (n = 32) | Low (n = 23) | High (n = 42) | Low (n = 38) | High (n = 41) | Low (n = 59) | High (n = 83) | Low (n = 97) | ||||||
| Severe thrombocytopenia | Platelet count <50 g/L | 28 (88) | 12 (52) | .006 | 37 (88) | 15 (39) | <.001 | 35 (85) | 18 (31) | <.001 | 72 (87) | 33 (34) | <.001 |
| Anemia | Hb <8 g/dL or requiring transfusion | 29 (91) | 14 (61) | .02 | 40 (95) | 14 (37) | <.001 | 40 (98) | 25 (42) | <.001 | 80 (96) | 39 (40) | <.001 |
| Neutropenia | |||||||||||||
| Severe | ANC ≤500 cells per µL | 32 (100) | 22 (96) | .4 | 42 (100) | 27 (71) | <.001 | 40 (98) | 50 (85) | .04 | 82 (99) | 77 (79) | <.001 |
| Profound | ANC ≤100 cells per µL | 32 (100) | 15 (65) | <.001 | 37 (88) | 17 (45) | <.001 | 37 (90) | 31 (53) | <.001 | 74 (89) | 48 (49) | <.001 |
| Protracted, severe | ANC ≤500 cells per µL for ≥7 days | 31 (97) | 11 (48) | <.001 | 37 (88) | 14 (37) | <.001 | 36 (88) | 31 (53) | <.001 | 73 (88) | 45 (46) | <.001 |
| Protracted, profound | ANC ≤100 cells per µL for ≥7 days | 16 (50) | 0 (0) | <.001 | 21 (50) | 4 (11) | <.001 | 18 (44) | 1 (2) | <.001 | 39 (47) | 5 (5) | <.001 |
| Prolonged | ANC ≤1000 cells per µL measured at ≥21 days after CAR transfusion | 29 (91) | 14 (61) | .02 | 35 (83) | 23 (61) | .003 | 32 (78) | 18 (31) | <.001 | 67 (81) | 41 (42) | <.001 |
| Primary end point: duration of severe neutropenia from day 0 to day 60 (95% CI) | 16.5 (13-43) | 7 (6-10) | <.001 | 17 (13-19) | 5 (3-8) | <.001 | 10 (9-12) | 7 (5-8) | <.001 | 12 (10-16) | 5.5 (5-8) | <.001 | |
| Binary end point: severe neutropenia ≥14 days | 21 (66) | 1 (4) | <.001 | 28 (67) | 5 (13) | <.001 | 12 (29) | 0 (0) | <.001 | 40 (48) | 5 (5) | <.001 | |
Comparison of the incidence of clinically significant thrombocytopenia, anemia, and neutropenia in patients with a high risk for hematotoxicity (CAR-HEMATOTOX score ≥2) compared with patients with a low risk (CAR-HEMATOTOX score <2). Statistical significance (P < .05) between groups was determined by Fisher’s exact 2-sided t test for incidence rates and Mann-Whitney U test for the primary end point.
The CAR-HEMATOTOX model predicts hematotoxicity in an independent patient cohort
The discriminative capacity of the CAR-HEMATOTOX model was next studied in 2 independent patient cohorts. The European cohort included more tisa-cel patients, and the US cohort included more axi-cel patients. Compared with the training cohort, both validation cohorts presented to lymphodepletion with less pronounced cytopenia and lower levels of inflammatory markers (Table 1). This was reflected in the mean CAR-HEMATOTOX score, which was 2.6 in the training cohort compared with 2.1 in the European validation cohort (Δ, 0.57; P = .16) and 1.9 in the US validation cohort (Δ, 0.75; P = .03) (supplemental Figure 7A).
On univariate analysis, the CAR-HEMATOTOX model was significantly correlated with the duration of neutropenia in both cohorts (Figure 5A-B). For the pooled validation analysis, the calculated slope (β1) of the simple linear regression was 3.29, which corresponds to an average increase in the duration of neutropenia of 3.29 days for every increase of 1 in the score (supplemental Figure 6H). The discriminatory capacity of the score with respect to short vs long duration of neutropenia was confirmed (pooled analysis: AUC, 0.89; P < .001; sensitivity, 89%; specificity, 68%; positive:negative likelihood ratio, 2.74:0.17) (Figure 5C; supplemental Table 9). Patients with a high score had a median of 12 days (95% CI, 10-16 days) of severe neutropenia compared with 5.5 days (95% CI, 5-8 days) in patients with a low score (P < .001; Figure 5D; supplemental Figure 7G). The score identified patients with aplastic features (Figure 5E). The overall incidence of profound, protracted, or prolonged neutropenia was increased in patients with a high CAR-HEMATOTOX score (Table 3). For example, patients with a high score exhibited profound, protracted neutropenia in 47% of patients compared with 5% in patients with a low score (P < .05). Moreover, prolonged neutropenia was more common in high-risk patients (81% vs 42%; P < .001). Severe thrombocytopenia and anemia were frequent in high-risk patients (87% and 96%, respectively; Table 3). The aggregated platelet count and hemoglobin over time illustrate the separation of curves between patients with high or low scores (Figure 5F-G; supplemental Figure 6B,D,F). Together these findings highlight the utility of the CAR-HEMATOTOX model as a tool for identifying patients who are at high risk of developing clinically significant cytopenia.
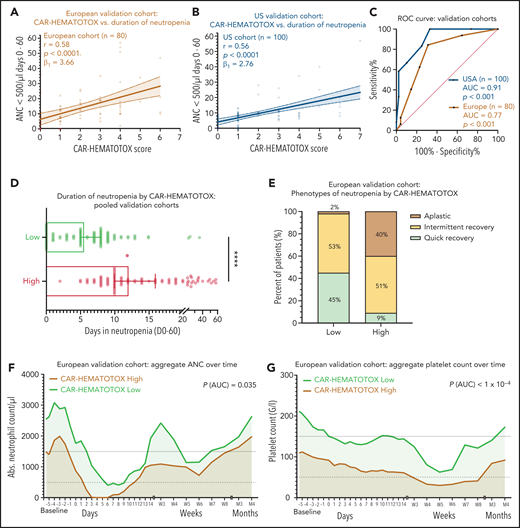
The CAR-HEMATOTOX score discriminates between a high risk and a low risk for hematotoxicity in 2 independent patient cohorts. (A-B) Univariate analysis comparing the CAR-HEMATOTOX score to the duration of severe neutropenia in the European (A) and (B) US validation cohorts. (C) ROC curves for the binary outcome of severe neutropenia between ≥4 and <14 days by CAR-HEMATOTOX score for the European and US validation cohorts. (D) Pooled analysis of the median duration of severe neutropenia (days 0-60) by CAR-HEMATOTOX score for both validation cohorts (n = 180); whiskers indicate the 95% CIs. (E) Relative distribution of clinical phenotypes of neutrophil recovery by CAR-HEMATOTOX score for the European validation cohort (n = 80). (F-G) Aggregated median ANC (F) and platelet count (G) over time for patients with a low or high score. The P value is provided for comparison of the calculated AUC for high-risk vs low-risk patients (supplemental Figure 6). Mann-Whitney U test ****P < .0001.
The CAR-HEMATOTOX score discriminates between a high risk and a low risk for hematotoxicity in 2 independent patient cohorts. (A-B) Univariate analysis comparing the CAR-HEMATOTOX score to the duration of severe neutropenia in the European (A) and (B) US validation cohorts. (C) ROC curves for the binary outcome of severe neutropenia between ≥4 and <14 days by CAR-HEMATOTOX score for the European and US validation cohorts. (D) Pooled analysis of the median duration of severe neutropenia (days 0-60) by CAR-HEMATOTOX score for both validation cohorts (n = 180); whiskers indicate the 95% CIs. (E) Relative distribution of clinical phenotypes of neutrophil recovery by CAR-HEMATOTOX score for the European validation cohort (n = 80). (F-G) Aggregated median ANC (F) and platelet count (G) over time for patients with a low or high score. The P value is provided for comparison of the calculated AUC for high-risk vs low-risk patients (supplemental Figure 6). Mann-Whitney U test ****P < .0001.
The CAR-HEMATOTOX model is not predictive of CRS and ICANS, but it is associated with adverse patient outcomes and prolonged hospitalization
The primary objective of this study was to develop a score that models hematotoxicity (Figures 3-5). However, several of the identified predictive biomarkers of hematotoxicity have been implicated in other immunotoxicities and are of prognostic interest.8,33-35 Across all studied patients, a high CAR-HEMATOTOX score did not result in a higher rate of clinically significant (grade ≥2) CRS or ICANS (Figure 6A-B; supplemental Figure 8A-B). Data concerning clinical outcomes, including response according to positron emission tomography/computed tomography imaging on day 90 and PFS and OS, were obtained for 40 patients from the training cohort. In these patients, a high CAR-HEMATOTOX score was associated with worse clinical outcomes on binary logistic regression analysis (supplemental Figure 8C). When studying the negative prognostic impact of the CAR-HEMATOTOX model, a trend toward significance was observed in terms of PFS (P = .07; Figure 6C) and OS (P = .09; Figure 6D). The overall response rate at 3 months was 66.6% in patients with a low CAR-HEMATOTOX score compared with 36% in patients with a high score (Δ, 30.6%; P = .1; Figure 6E). Both of the patients whose death was secondary to complications of CAR T-cell therapy (one as a result of severe neurotoxicity and one as a result of an infectious complication) had a high CAR-HEMATOTOX score before lymphodepletion. Of interest, applying a higher threshold ≥3 resulted in significantly worse PFS in patients with a high score (P = .019; supplemental Figure 8E), underlining the potential prognostic value of the studied score components. Severe neutropenia represented an important risk factor for prolonged hospitalization after CAR T-cell therapy. Patients who developed severe neutropenia that lasted for 14 or more days spent an average of 54 days in the hospital compared with only 29.5 days in patients who experienced a shorter period of severe neutropenia (P = .0028; Figure 6F). Importantly, the CAR-HEMATOTOX score correlated with a long hospital stay on univariate analysis (r = 0.47; P = .003; supplemental Figure 8D). These findings highlight that hematotoxicity results in long hospital stays, and also highlight that the CAR-HEMATOTOX model is useful for identifying patients who may have a higher risk of prolonged hospitalization.
![The impact of the CAR-HEMATOTOX score on concurrent immunotoxicity, clinical outcomes, and the duration of hospitalization. Comparison of (A) CRS and (B) ICANS severity according to American Society for Transplantation and Cellular Therapy (ASTCT) grading among patients with a low or high CAR-HEMATOTOX score. Kaplan-Meier estimates of (C) PFS and (D) OS according to CAR-HEMATOTOX score. (E) Comparison of the overall response rate (ORR) as assessed by positron emission tomography/computed tomography staging on day 90 according to Lugano criteria. In all, 10 of 15 patients with a low CAR-HEMATOTOX score showed evidence of response (complete response [CR], 8; partial response [PR], 2) compared with 9 of 25 patients with high CAR-HEMATOTOX score (CR, 6; PR, 3). (F) Duration of hospitalization from lymphodepletion until discharge or death by CAR-HEMATOTOX score and by severity of hematotoxicity. Severe hematotoxicity was defined as severe neutropenia for ≥14 days between days 0 and 60. Error bars indicate the standard error of the mean (SEM). P-values were determined by Mann-Whitney U test.](https://ash.silverchair-cdn.com/ash/content_public/journal/blood/138/24/10.1182_blood.2020010543/5/m_bloodbld2020010543f6.png?Expires=1764956920&Signature=o-fBBenkQP-1VaBGd5NzhCTPiEyfTxPefQuf6jvTvZ1eU2j1edhVwjksBU6xQKeF9DMsqcelIBc0UWSDvweXFqa3jdOXqVQTQQeaq5fIRURel~NRVd3XGCDPFMsrKv73NKdLckkDJEV~zx4mAgv0frIOT0F83l7j0COgeo5s3bJUauV-hTo1L5rhlx93tarrcjBplnX5U4Jha0isXlo1ALyZpV5uvmXF5jSmLWW991vA57XoyiYYMm1iUkV2iIrvqtCfKo6TFYf4he8bHISofRqRIbEjQvR3Gmqvgj2ywNTSzHRff1VY6DFo3qtM1pN9Z-IaaRCq1a9MZgu3IT2MrQ__&Key-Pair-Id=APKAIE5G5CRDK6RD3PGA)
The impact of the CAR-HEMATOTOX score on concurrent immunotoxicity, clinical outcomes, and the duration of hospitalization. Comparison of (A) CRS and (B) ICANS severity according to American Society for Transplantation and Cellular Therapy (ASTCT) grading among patients with a low or high CAR-HEMATOTOX score. Kaplan-Meier estimates of (C) PFS and (D) OS according to CAR-HEMATOTOX score. (E) Comparison of the overall response rate (ORR) as assessed by positron emission tomography/computed tomography staging on day 90 according to Lugano criteria. In all, 10 of 15 patients with a low CAR-HEMATOTOX score showed evidence of response (complete response [CR], 8; partial response [PR], 2) compared with 9 of 25 patients with high CAR-HEMATOTOX score (CR, 6; PR, 3). (F) Duration of hospitalization from lymphodepletion until discharge or death by CAR-HEMATOTOX score and by severity of hematotoxicity. Severe hematotoxicity was defined as severe neutropenia for ≥14 days between days 0 and 60. Error bars indicate the standard error of the mean (SEM). P-values were determined by Mann-Whitney U test.
The impact of the CAR-HEMATOTOX score on concurrent immunotoxicity, clinical outcomes, and the duration of hospitalization. Comparison of (A) CRS and (B) ICANS severity according to American Society for Transplantation and Cellular Therapy (ASTCT) grading among patients with a low or high CAR-HEMATOTOX score. Kaplan-Meier estimates of (C) PFS and (D) OS according to CAR-HEMATOTOX score. (E) Comparison of the overall response rate (ORR) as assessed by positron emission tomography/computed tomography staging on day 90 according to Lugano criteria. In all, 10 of 15 patients with a low CAR-HEMATOTOX score showed evidence of response (complete response [CR], 8; partial response [PR], 2) compared with 9 of 25 patients with high CAR-HEMATOTOX score (CR, 6; PR, 3). (F) Duration of hospitalization from lymphodepletion until discharge or death by CAR-HEMATOTOX score and by severity of hematotoxicity. Severe hematotoxicity was defined as severe neutropenia for ≥14 days between days 0 and 60. Error bars indicate the standard error of the mean (SEM). P-values were determined by Mann-Whitney U test.
Discussion
In this retrospective study, we observed a strikingly high incidence rate of hematologic toxicity after CAR T-cell therapy in the real-world setting. The identified predictive biomarkers provide mechanistic links that warrant further study. The fact that baseline cytopenia was associated with the duration of neutropenia illustrates that a state of impaired hematopoietic reserve likely contributes to hematotoxicity. This may reflect direct genotoxic stress to the hematopoietic stem and progenitor cell compartment that results from multiple cycles of cytotoxic chemotherapy.36 Interestingly, markers of baseline inflammation were strongly linked to hematotoxicity, but high peak cytokine levels and CRS grade were not. This would argue against the hypothesis that hematotoxicity results from direct inflammatory damage to the BM via high levels of circulating cytokines such as interferons, tumor necrosis factor alpha, and IL-6.37 However, previous studies have demonstrated delayed hematopoietic recovery in patients with grade ≥4 CRS,13 and pancytopenia represents a hallmark feature of hyperinflammatory diseases such as hemophagocytic lymphohistiocytosis/secondary macrophage activation syndrome38 and septic shock.39-41 Patients presenting to CAR T-cell therapy with a damaged hematopoietic stem and progenitor cell compartment may be sensitive to the effects of local inflammation. For example, IL-6 signaling has been implicated in the emergence of hematopoietic stem cells,42 and interferon-γ can reduce stem cell cycling.43,44
Tumor microenvironment may be especially critical in the pathogenesis of hematotoxicity in lymphoma patients with underlying extranodal BM involvement. Indeed, in the patients in which BM infiltration was assessed before therapy was initiated, we found a significant correlation with neutropenia. In future studies, acquiring a BM biopsy before lymphodepletion may be prudent and could be guided by risk-stratification tools such as CAR-HEMATOTOX. It remains unclear whether a pathomechanistic link can be established between a hyperinflammatory baseline state and compromised hematopoietic reserve or whether these processes function independently. One could postulate that CAR T-cell–induced cytolysis of CD19+ lymphoma cells facilitates antigenic spreading, a phenomenon that may be potentiated in patients with baseline hyperinflammation, which has been associated with severe CRS.26,45-49 Together, these mechanisms may promote indirect autoimmune processes that prevent healthy hematopoiesis (supplemental Figure 9). For example, expansion of regulatory T cells and oligoclonal T-cell populations have been described in other BM failure syndromes, including idiopathic aplastic anemia.50-52 Interestingly, the relative frequency of the intermittent recovery phenotype was independent of the patient-intrinsic features (eg, baseline laboratory markers) of CAR-HEMATOTOX (Figure 5D), suggesting an immune-related mechanism for the second dip.
Identifying the relationship between the above biomarkers and neutropenia resulted in the development of the multivariable CAR-HEMATOTOX score. A high score was associated with an increased rate of clinically significant cytopenia. We chose a lower cutoff score because of the higher sensitivity and negative predictive value. However, depending on the clinical context—for example, an interventional research study—a higher cutoff may be chosen to yield a higher specificity and positive predictive value. Because of the low positive predictive value, we do not recommend withholding CAR T-cell therapy to patients with a high CAR-HEMATOTOX score. Other limitations include the retrospective nature of the analysis, and the incomplete data for BM infiltration and the presence of dysplastic changes or clonal hematopoiesis. The primary end point may have been influenced by the day that G-CSF was initiated and the frequency and depth of follow-up. The burgeoning CAR T-cell field remains limited by small patient numbers. As a result, our model was based on a limited sample size, which raises concerns about overfitting. Calibration-in-the-large was suboptimal (supplemental Table 9), most likely the result of patient heterogeneity and cohort-specific differences in the respective score components. The calculated probabilities thus cannot be taken as an unbiased estimate for hematotoxicity in future patients. However, the discriminative ability of the score was validated in 2 independent patient cohorts, which underlines the external validity of the model. Additional prospective studies are therefore warranted.
An important advantage of CAR-HEMATOTOX is its easy-to-use nature: the laboratory values will be included in most initial workups, and the score can be calculated before therapy is initiated. The score invites several potential clinical applications. First and foremost, risk-stratification of both early and delayed hematotoxicity. High-risk patients may benefit from early and/or prophylactic growth factor support, as was recently demonstrated to be safe in lymphoma patients.53 With a median duration of severe neutropenia of 12 days, high-risk patients represent good candidates for evidence-based antifungal prophylaxis according to IDSA recommendations.24 The clinically pressing question in regard to hematotoxicity is the percentage of patients who develop severe BM aplasia, which necessitates high levels of supportive care and vigilant in-patient monitoring for potential infectious complications.18,19 These challenging patients fit the protracted and profound category of neutropenia and/or the aplastic phenotype (Figure 1D). The presence of an aplastic phenotype greatly impacted the length of neutropenia (35.5 vs 10.5 vs 5 days; supplemental Figure 7D). Aplastic patients presented with a high median CAR-HEMATOTOX score of 4 (supplemental Figure 7B) and high scores were associated with long-lasting neutropenia (supplemental Figure 7C). Importantly, the score identified all but 1 patient with aplastic features (33 of 34 patients; Figures 3D and 4D). It remains to be determined whether especially high-risk patients may be triaged for generation of an autologous stem cell backup.54-56 Finally, because hematotoxicity is still a major hurdle for early discharge (Figure 6F), the score may be useful for allocating resources and determining which future CAR T-cell patients may be managed in an outpatient setting.
In summary, our findings underline the importance of CAR T-cell–related hematotoxicity in the real-world setting. The CAR-HEMATOTOX score will allow clinicians to risk-stratify for this toxicity, anticipate patient needs, and potentially guide antimicrobial prophylactic strategies.
Acknowledgments
The authors thank all the patients who contributed to the results in this study.
This work was supported by grants from the German Research Council (provided within the Sonderforschungsbereich) (SFB 1243) and SU197/3-1 (M.S.), and by the Bavarian Elite Graduate Training Network (M.S.), the Wilhelm Sander Stiftung (to Project No. 2018.087.1), and the Else-Kröner Fresenius Stiftung (M.S.).
Authorship
Contribution; K.R., E.H., and M.S. conceptualized the study; K.R., A.P., P.S., C.B., L. Jentzsch, D.M., L.F., V. Bücklein, V. Blumenberg, C.S., L. Jallades, B.F., C.F., and M.S. conducted the research; K.R., E.H., J.A., and M.S. performed the formal data analysis and visualization; K.R., E.H., and P.K. devised the methodology; M.S. provided the resources and funding and supervised the study; K.R. and M.S. wrote the original draft; K.R., A.P., E.H., O.W., M.D., F.L.L., M.v.B.-B., A.M., W.B., F.A., E.B., G.S., M.D.J., and M.S. wrote, reviewed, and edited the manuscript; and all authors read and approved the final manuscript.
Conflict-of-interest disclosure: P.S. received research funding from Chugai, Novartis, and Kite Pharma/Gilead. V. Bücklein received research funding from Celgene, served as a consultant for Pfizer, and received honoraria from Kite Pharma/Gilead and Therakos/Mallinckrodt. V. Blumenberg received research funding from Novartis and Celgene and served as a consultant and received research funding from Gilead. C.S. served as a consultant and received honoraria from Celgene, Gilead, and Novartis. M.v.B.-B. served as a consultant and received research funding and honoraria from Merck Sharp & Dohme, Novartis, Roche, Kite Pharma/Gilead, Bristol Myers Squibb, Astellas, Mologen, and Miltenyi. F.A. received research funding from Neovii, received research funding and honoraria from Therakos/Mallinckrodt, received honoraria from Kite Pharma/Gilead and Novartis, and served as a consultant and received honoraria from Celgene. F.L.L. had a scientific advisory role with Kite Pharma, Novartis, Celgene/Bristol Myers Squibb, GammaDelta Therapeutics, Wugen, Amgen, Calibr, and Allogene, was a consultant with grant options for Cellular Biomedicine Group, received research funding from Kite Pharma, Novartis, and Allogene, and reports that his institution holds unlicensed patents in his name in the field of cellular immunotherapy. M.D.J. served as a consultant or advisor for Kite Pharma/Gilead, Novartis, Bristol Myers Squibb, and Takeda. M.S. received research funding from Morphosys and Seattle Genetics, served as a consultant for Janssen, received research funding and served as a consultant for Novartis and Roche AG, received research funding and honoraria from and served as a consultant for Amgen and Kite Pharma/Gilead, and served as a consultant and received honoraria from Celgene. The remaining authors declare no competing financial interests.
Correspondence: Marion Subklewe, Department of Medicine III, University Hospital, LMU Munich, Marchioninistraße 15, 81377 Munich, Germany; e-mail: marion.subklewe@med.uni-muenchen.de.
For original data, please contact Marion Subklewe via e-mail at marion.subklewe@med.uni-muenchen.de.
The online version of this article contains a data supplement.
There is a Blood Commentary on this article in this issue.
The publication costs of this article were defrayed in part by page charge payment. Therefore, and solely to indicate this fact, this article is hereby marked “advertisement” in accordance with 18 USC section 1734.

This feature is available to Subscribers Only
Sign In or Create an Account Close Modal