

Key Points
Increasing karyotypic complexity is independently associated with inferior survival for patients with CLL treated with ibrutinib.
Karyotype evolution at ibrutinib progression predicts inferior survival for patients with CLL.

Abstract
Complex karyotype, defined as ≥3 cytogenetic abnormalities, is prognostic of survival in patients treated with ibrutinib or venetoclax in relapsed/refractory (RR) chronic lymphocytic leukemia (CLL). Recent studies re-evaluating this dichotomous variable have shown that higher numbers of cytogenetic abnormalities (ie, ≥5) have a worse overall survival in patients treated with chemoimmunotherapy. We sought to determine if increasing karyotypic complexity, treated as a continuous variable, was prognostic of survival for patients treated with ibrutinib for CLL. We conducted a retrospective analysis of all patients with CLL treated with single-agent ibrutinib or in combination with an anti–CD20 antibody at our institution. We included 456 patients with both treatment-naive and RR disease. Median number of prior therapies was 2 (range, 0-13), 30% of patients had presence of del(17p), and 75% expressed unmutated IGHV. Fifty percent had ≥3 cytogenetic abnormalities, including 30% with ≥5. In a multivariable analysis, increasing karyotypic complexity was an independent predictor of shorter progression-free survival (hazard ratio, 1.07; 95% confidence interval, 1.04-1.10; P < .0001) and overall survival (hazard ratio, 1.09; 95% confidence interval, 1.05-1.12; P < .0001). Furthermore, we found that presence of clonal evolution determined by cytogenetic analysis at progression was prognostic of subsequent survival (P = .02). This solidifies karyotypic complexity as an important prognostic factor for patients with CLL treated with ibrutinib. Further research should consider sequential karyotypic analysis as a determination of risk of progression and death in patients with CLL.
Introduction
Survival of patients with chronic lymphocytic leukemia (CLL) continues to improve with the approval of small molecule inhibitors that have drastically changed the treatment landscape for this disease.1,2 As utilization of these new treatments becomes more ubiquitous, it is important to discern prognostic markers of survival to help inform patients and providers of individual risk. Genetic aberrations such as presence of deletion of 17p [del(17p)], TP53 mutations, and immunoglobulin variable heavy chain (IGHV) mutational status have long been prognostic markers of survival for CLL when chemoimmunotherapy is used, and they are currently recommended testing per the National Comprehensive Cancer Network and the International Workshop on CLL (iwCLL).3-6 However, it appears that the importance of these markers may be diminished when novel therapies are used, given their superior efficacy compared with chemoimmunotherapy.7-9 As such, continued evaluation of prior prognostic factors and the discovery of new variables are of upmost importance as the treatment of CLL evolves.
Fluorescence in situ hybridization (FISH) analysis in CLL to determine presence of del(17p), deletion of 11q, trisomy 12, and deletion of 13q has been a standard prognostic analysis for CLL since the landmark Dohner study.4 FISH testing has limitations, as it does not identify abnormalities that are not part of the probe set used. Over the last decade, conventional cytogenetics to determine karyotype has been more routinely incorporated into CLL work-up, as advances in stimulation allow normally dormant CLL cells to divide in culture.10,11 Complex karyotype (CK) in CLL is typically defined as having ≥3 unrelated chromosomal abnormalities.8,12-15 CK has been shown to be a prognostic marker for survival in patients treated with chemoimmunotherapy and patients treated with ibrutinib, a Bruton-tyrosine kinase inhibitor, or venetoclax, a B-cell lymphoma 2 inhibitor, in the relapsed/refractory (RR) setting.8,15-18 However, CK did not prove to be a statistically significant prognostic marker for patients treated with ibrutinib in the treatment-naive (TN) setting in a prospective clinical trial.13
A recent study suggested that CK defined as ≥5 abnormalities was of great prognostic significance, because it showed a poor prognosis independent of del(17p), TP53, or IGHV status in a large cohort of patients.19 However, investigators did not delineate outcomes according to treatment received, and the authors recognized that the majority of the patients were treated with chemoimmunotherapy. Furthermore, specific types of chromosomal abnormalities, not recognized by standard CLL FISH, such as contemporaneous occurrence of +12/+19, and structural chromosome abnormalities (ie, translocations) have been identified as potential prognostic features in CLL.19-21
Here we sought to characterize karyotype complexity for patients with CLL treated with ibrutinib. Although the number of karyotypic abnormalities is often dichotomized to form 2 groups, we tested whether increasing karyotype complexity defined as a continuous variable was an independent prognostic variable. We also explored the prognostic significance of major structural chromosome abnormalities at ibrutinib start. Lastly, karyotype evolution at progression was analyzed to determine if it has prognostic implications for survival.
Methods
Patient selection
We conducted a retrospective analysis of all patients with CLL treated with ibrutinib as a single agent or in combination with an anti-CD20 monoclonal antibody (moAB) from 2010 through 2019 at The Ohio State University after approval by the Institutional Review Board. To decrease the chance of karyotype evolution between cytogenetic analysis and treatment change, we only included patients who had cytogenetic analyses obtained within 2 months after the start of ibrutinib, within 6 months before the start of ibrutinib if previously treated, and at any time between CLL diagnosis and start of ibrutinib if previously untreated (supplemental Figure 1, available on the Blood Web site). Rai stage was calculated at CLL diagnosis. Among patients who had a progression event after receiving ibrutinib, we considered cytogenetic analyses if obtained within 1 month before or after the date of progression, and up to 12 months before or 6 months after the date of progression when there was no change in treatment received.
Assessment of cytogenetics
Conventional cytogenetics was performed on mitogen-stimulated cultures using cytosine guanine dinucleotide (CpG) oligonucleotides alone and in combination with pokeweed mitogen and phorbol 12-myristate 13-acetate.22 Karyotypes were described by using standard International System for Human Cytogenetic Nomenclature (ISCN) nomenclature.14 Single-cell abnormalities were described if consistent with FISH results from the sample or when matching a clone previously identified in the patient. Complexity was enumerated adopting the International Working Group on MDS Cytogenetics consensus guidelines using the simplest ISCN nomenclature.23 The karyotype at progression was considered evolved if there was one or more cytogenetic abnormalities seen, either as a new subclone or as an unrelated clone, in the progression sample that were not seen cytogenetically in the sample evaluated at the start of treatment in at least 2 cells (supplemental Table 1). Given this definition, it is possible to have karyotype evolution without an increase in overall number of abnormalities if, at progression, new abnormalities were acquired and baseline abnormalities were lost. Each karyotype was reviewed for the presence of major structural chromosomal abnormalities, including balanced rearrangements (reciprocal translocations, inversions, and balanced insertions) and unbalanced rearrangements (derivative chromosomes, adds, rings, dicentrics, and marker chromosomes). FISH analysis was performed by using the Vysis CLL FISH Probe Kit (Abbott Molecular) on nuclei from the CpG/pokeweed/phorbol 12-myristate 13-acetate–stimulated cultures, with hybridization according to the manufacturer’s directions. Two hundred cells per probe were analyzed, 100 each by 2 independent observers.
Statistical methods
Patient characteristics are presented with descriptive statistics and were compared among CK groups by using χ2 or Fisher’s exact test for categorical variables and Kruskal-Wallis tests for continuous variables. Time to ibrutinib discontinuation was measured from ibrutinib start date to ibrutinib end date. Progression-free survival (PFS) was calculated from the date of ibrutinib start to the date of progression per iwCLL criteria and/or death. Overall survival (OS) was calculated from the date of ibrutinib start to the date of death. Patients without an event were censored at the date of last follow-up. Time to ibrutinib discontinuation, PFS, and OS were estimated by using the method of Kaplan-Meier, and the differences in curves were detected by the log-rank test. Cox proportional hazards models estimated the association between karyotypic abnormalities and survival outcomes. First, univariable models were fit for number of karyotypic abnormalities as a continuous variable and each of the following potentially important covariates: age, sex, Rai stage, use of concomitant anti–CD20 moAB, previously treated status, Eastern Cooperative Oncology Group Performance Status (ECOG PS) score, hemoglobin, platelet count, white blood cell (WBC) count, lactate dehydrogenase (LDH), FISH abnormalities including del(17p), IGHV mutational status, and presence of structural abnormality. The proportional hazards assumption was checked for each variable, and if not met, then a time-dependent covariate model estimated hazard ratios (HRs) before and after a particular time point. A full model was fit including all variables with P < .2 in univariable analyses. Using backward selection, the variables with the largest P value from the corresponding Wald statistic were dropped from the model one at a time until all variables left in the final model were significant with P ≤ .05. A multiple imputation procedure estimated missing data and was applied to obtain combined results from 30 multiply imputed data sets.24 Notably, β2-microglobulin was not included in analyses due to a high proportion of missing data (42%). SAS version 9.4 (SAS Institute, Inc) was used for statistical analysis, all tests were two-sided, and statistical significance was declared at α = 0.05. No adjustment was made for multiple testing.
Results
Patient characteristics, treatment, and survival outcomes
Of the 559 patients treated with ibrutinib with or without an anti-CD20 moAB, 456 patients had cytogenetic analyses performed that met our inclusion criteria. Ninety-three percent of patients had cytogenetic analysis attained 6 months before or after ibrutinib start. Baseline patient characteristics, including cytogenetic and molecular features, are shown in Table 1. Median age was 65 years (range, 26-91 years). Sixteen percent of patients were concomitantly treated with obinutuzumab, rituximab, or ofatumumab. The median number of prior therapies was 2 (range, 0-13), and most patients were RR (78%). Ninety-five percent of patients had an ECOG PS score of 0 or 1. Median hemoglobin, platelet count, and WBC count were 11.1 g/dL, 115 K/µL, and 23.4 K/µL, respectively. The majority of patients (61%) had an elevated LDH level equal to or higher than the upper limit of normal. The patients were generally high risk, with 75% expressing unmutated IGHV and 30% having del(17p) according to FISH. At initiation of ibrutinib, there were varying degrees of karyotypic complexity. Median number of cytogenetic abnormalities was 2 (range, 0 to ≥20); 16%, 34%, 20%, 20%, 6%, and 4% of patients had 0, 1 to 2, 3 to 4, 5 to 9, 10 to 14, and ≥15 cytogenetic abnormalities, respectively. Most patients (63%) had a structural abnormality as part of the karyotype.
Patient characteristics at ibrutinib start
| All patients (N = 456) | CA = 0 (n = 74) | CA = 1-2 (n = 155) | CA = 3-4 (n = 90) | CA = 5-9 (n = 89) | CA = 10-14 (n = 29) | CA ≥15 (n = 19) | P | |
|---|---|---|---|---|---|---|---|---|
| Age, median (range), y | 65 (26-91) | 64 (32-83) | 66 (37-88) | 64 (41-85) | 67 (26-83) | 66 (37-91) | 62 (53-76) | .58 |
| Sex, no. (%) | .78 | |||||||
| Male | 319 (70) | 53 (72) | 104 (67) | 68 (76) | 60 (67) | 20 (69) | 14 (74) | |
| Female | 137 (30) | 21 (28) | 51 (33) | 22 (24) | 29 (33) | 9 (31) | 5 (26) | |
| Rai stage, no. (%)* | .08 | |||||||
| Low (0-1) | 101 (24) | 22 (33) | 38 (27) | 19 (22) | 18 (21) | 3 (11) | 1 (5) | |
| Intermediate (2) | 69 (16) | 13 (19) | 20 (14) | 18 (21) | 9 (10) | 4 (15) | 5 (26) | |
| High risk (3-4) | 254 (60) | 32 (48) | 81 (58) | 49 (57) | 59 (69) | 20 (74) | 13 (68) | |
| Unknown | 32 | 7 | 16 | 4 | 3 | 2 | 0 | |
| Concomitant moAB, no. (%) | .82 | |||||||
| No | 382 (84) | 63 (85) | 134 (86) | 72 (80) | 74 (83) | 24 (83) | 15 (79) | |
| Yes | 74 (16) | 11 (15) | 21 (14) | 18 (20) | 15 (17) | 5 (17) | 4 (21) | |
| Previously treated, no. (%) | <.0001 | |||||||
| No | 101 (22) | 22 (30) | 52 (34) | 13 (14) | 8 (9) | 4 (14) | 2 (11) | |
| Yes | 355 (78) | 52 (70) | 103 (66) | 77 (86) | 81 (91) | 25 (86) | 17 (89) | |
| TN or no prior chemotherapy | 150 (33) | 30 (41) | 72 (46) | 26 (29) | 11 (12) | 7 (24) | 4 (21) | <.0001 |
| Previously treated with chemotherapy | 306 (67) | 44 (59) | 83 (54) | 64 (71) | 78 (88) | 22 (76) | 15 (79) | |
| Baseline ECOG PS score, no. (%) | .05 | |||||||
| 0 | 173 (39) | 33 (46) | 63 (43) | 32 (37) | 26 (30) | 10 (34) | 9 (47) | |
| 1 | 248 (56) | 34 (48) | 81 (55) | 52 (60) | 58 (67) | 15 (52) | 8 (42) | |
| 2 | 18 (4) | 4 (6) | 3 (2) | 2 (2) | 3 (3) | 4 (14) | 2 (11) | |
| Unknown | 17 | 3 | 8 | 4 | 2 | 0 | 0 | |
| Hemoglobin, g/dL | .22 | |||||||
| Median (range) | 11.1 (6.5-17.9) | 11.7 (7-17.9) | 11.4 (6.5-15.7) | 11.6 (7-16) | 10.7 (6.5-15.5) | 10.9 (7.9-14) | 11.5 (8.2-14) | |
| Unknown | 1 | 0 | 1 | 0 | 0 | 0 | 0 | |
| Platelets, K/µL | .25 | |||||||
| Median (range) | 115 (7-528) | 112.5 (13-432) | 120.5 (0-528) | 121 (7-349) | 102 (8-429) | 97 (20-281) | 115 (35-313) | |
| Unknown | 1 | 0 | 1 | 0 | 0 | 0 | 0 | |
| WBC count, K/µL | .14 | |||||||
| Median (range) | 23.4 (0.7-547.5) | 24.1 (2.6-470.8) | 36.3 (1.2-547.5) | 22 (0.7-463.2) | 22.5 (0.9-345.8) | 18 (3.6-288.7) | 10.4 (2.4-195.6) | |
| Unknown | 1 | 0 | 1 | 0 | 0 | 0 | 0 | |
| LDH, no. (%) | .03 | |||||||
| ≤ULN | 171 (39) | 39 (55) | 57 (39) | 34 (38) | 29 (33) | 7 (25) | 5 (26) | |
| ≥ULN | 270 (61) | 32 (45) | 89 (61) | 55 (62) | 59 (67) | 21 (75) | 14 (74) | |
| Unknown | 15 | 3 | 9 | 1 | 1 | 1 | 0 | |
| FISH del(11q), no. (%) | <.0001 | |||||||
| No | 318 (70) | 69 (95) | 113 (73) | 49 (54) | 54 (61) | 21 (72) | 12 (63) | |
| Yes | 137 (30) | 4 (5) | 42 (27) | 41 (46) | 35 (39) | 8 (28) | 7 (37) | |
| Unknown | 1 | 1 | 0 | 0 | 0 | 0 | 0 | |
| FISH trisomy 12, no. (%) | <.0001 | |||||||
| No | 355 (78) | 72 (99) | 107 (69) | 69 (77) | 73 (82) | 21 (72) | 13 (68) | |
| Yes | 99 (22) | 1 (1) | 47 (31) | 21 (23) | 16 (18) | 8 (28) | 6 (32) | |
| Unknown | 2 | 1 | 1 | 0 | 0 | 0 | 0 | |
| FISH del(13q), no. (%) | .06 | |||||||
| No | 229 (50) | 39 (53) | 92 (59) | 40 (44) | 36 (40) | 14 (48) | 8 (42) | |
| Yes | 227 (50) | 35 (47) | 63 (41) | 50 (56) | 53 (60) | 15 (52) | 11 (58) | |
| FISH del(17p), no. (%) | <.0001 | |||||||
| No | 319 (70) | 72 (97) | 132 (85) | 70 (78) | 35 (39) | 6 (21) | 4 (21) | |
| Yes | 137 (30) | 2 (3) | 23 (15) | 20 (22) | 54 (61) | 23 (79) | 15 (79) | |
| IGHV, no. (%) | <.0001 | |||||||
| Mutated | 99 (25) | 29 (46) | 36 (27) | 19 (23) | 10 (14) | 5 (19) | 0 (0) | |
| Unmutated | 295 (75) | 34 (54) | 96 (73) | 64 (77) | 62 (86) | 21 (81) | 18 (100) | |
| Unknown or not tested | 62 | 11 | 23 | 7 | 17 | 3 | 1 | |
| Presence of structural abnormality, no. (%) | <.0001 | |||||||
| No | 169 (37) | 74 (100) | 85 (55) | 10 (11) | 0 (0) | 0 (0) | 0 (0) | |
| Yes | 287 (63) | 0 (0) | 70 (45) | 80 (89) | 89 (100) | 29 (100) | 19 (100) | |
| Balanced rearrangement only | 30 (7) | 0 (0) | 19 (12) | 11 (12) | 0 (0) | 0 (0) | 0 (0) | |
| Unbalanced rearrangement only | 184 (40) | 0 (0) | 49 (32) | 48 (53) | 57 (64) | 20 (69) | 10 (53) | |
| Both | 73 (16) | 0 (0) | 2 (1) | 21 (23) | 32 (36) | 9 (31) | 9 (47) |
CA, cytogenetic abnormalities; del(11q), deletion of 11q; del(13q), deletion of 13q; ULN, upper limit of normal.
Rai stage calculated at diagnosis.
With a median time on treatment of 44.8 months (range, 0.7-112.4 months), 153 (34%) patients were still on ibrutinib therapy. Among 303 patients who discontinued treatment, median time to discontinuation was 42.9 months (95% confidence interval [CI], 37.3-49.4). The most common reasons for discontinuation from therapy were adverse events (38%; 6% for atrial fibrillation), and disease progression (31%). Overall, with a median follow-up of >5 years among the 309 patients still alive, median PFS was 70 months (95% CI, 56.3-69.5), and median OS was 95.4 months (95% CI, 86-not reached) (Table 2).
Clinical outcomes
| Value (N = 456) | |
|---|---|
| Ibrutinib start date | 20 July 2010 to 4 December 2019 |
| Time on ibrutinib | |
| No. of discontinuations | 303 |
| Median (95% CI) | 42.9 (37.3-49.4) |
| Ibrutinib discontinuation, no. (%) | |
| No | 153 (34) |
| Yes | 303 (66) |
| Disease progression | 93 (31) |
| AE (not atrial fibrillation) | 96 (32) |
| AE (atrial fibrillation) | 19 (6) |
| Developed resistance | 11 (3) |
| Death | 39 (13) |
| Other, not specified | 45 (15) |
| PFS, mo | |
| Median (95% CI) | 70.0 (56.3-69.5) |
| OS, mo | |
| Median (95% CI) | 95.4 (86.0-not reached) |
AE, adverse event.
Karyotypic complexity, baseline clinical and genomic features, and outcome
On univariable analysis, karyotypic complexity as a continuous variable was highly prognostic for both PFS and OS. For each additional abnormality, the risk of progression or death increased by 7% (HR for PFS, 1.07; 95% CI, 1.04-1.10; P < .0001) and the risk of death increased by 9% (HR for OS, 1.09; 95% CI, 1.06-1.13; P < .0001). Using a standard cut point of 3 abnormalities to categorize patients with and without CK, there were significant differences in PFS (HR, 1.87; 95% CI, 1.42-2.46; P < .0001) and OS (HR, 2.09; 95% CI, 1.48-2.95; P < .0001, respectively). These differences in PFS and OS were more pronounced when using the cut point of 5 abnormalities (HR for PFS, 1.87 [95% CI, 1.43-2.45; P < .0001]; HR for OS, 2.81 [95% CI, 2.03-3.88; P < .0001]). When using >2 groups to characterize karyotypic complexity, PFS consistently decreased with each sequential group of patients with more abnormalities, supporting the analysis of karyotypic complexity as a continuous variable. Specifically, median PFS was not reached for those with no abnormalities and was reduced to 67 (95% CI, 57-82), 60 (95% CI, 47-73), 45 (95% CI, 36-61), 32 (95% CI, 18-70), and 19 (95% CI, 6-58) months for patients with 1 to 2, 3 to 4, 5 to 9, 10 to 14, and ≥15 abnormalities. The OS curves showed a similar pattern, which indicates the strong and accumulating impact of abnormalities on outcomes (Figure 1).
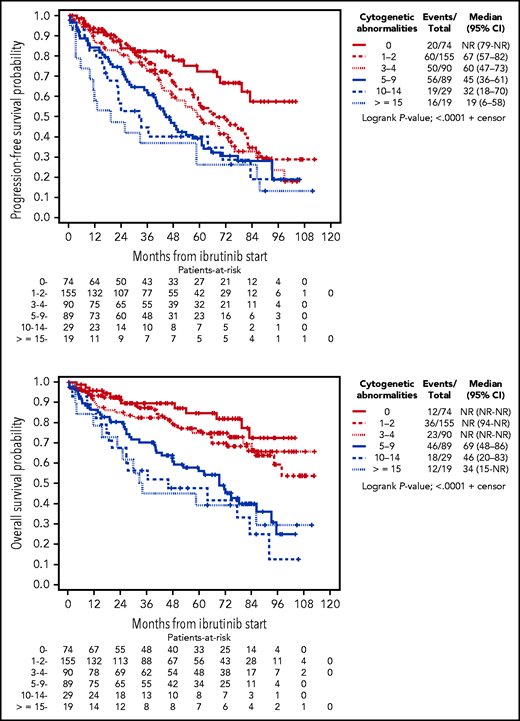
Kaplan-Meier curves depicting PFS and OS according to number of cytogenetic abnormalities.
Kaplan-Meier curves depicting PFS and OS according to number of cytogenetic abnormalities.
In addition to karyotypic complexity, a number of other demographic, clinical, and molecular variables were significantly associated with inferior outcomes in univariable analyses for PFS and OS (Tables 3 and 4). Notably, the presence of del(17p) as a sole variable was significant for inferior PFS (HR, 1.83; 95% CI, 1.40-2.38; P < .0001) (supplemental Figure 2A) and OS (HR, 1.97; 95% CI, 1.42-2.72; P < .0001) (supplemental Figure 2B). del(17p) was highly correlated with karyotypic complexity (P < .0001); the presence of del(17p) was 14% and 67% in patients with <5 or ≥5 cytogenetic abnormalities, respectively. To explore the relationship of del(17p) with karyotypic complexity and outcome, Kaplan-Meier curves were generated according to del(17p) status and cytogenetic abnormalities using presence of 5 abnormalities as a cut point. In patients with <5 cytogenetic abnormalities, the PFS curves for those with and without del(17p) initially overlapped, but the curve eventually worsened for those with del(17p). In contrast, in patients with ≥5 cytogenetic abnormalities, the curves were lower overall and did not differ between those with and without del(17p) (supplemental Figure 2C). With respect to OS, del(17p) status did not seem to provide additional prognostic information when CK was considered (supplemental Figure 2D). Interestingly, in patients with ≥3 cytogenetic abnormalities, those with del(17p) had significantly worse PFS and OS than those without (supplemental Figure 3), indicating that del(17p) might play a more important prognostic role when the number of abnormalities is low, but when the degree of complexity increases, the importance of del(17p) diminishes.
Univariable and multivariable analysis of progression-free survival
| Univariable model | Multivariable model | |||
|---|---|---|---|---|
| HR (95% CI) | P | HR (95% CI) | P | |
| Age, 5-y increase | 1.06 (0.98-1.14) | .14 | — | — |
| Female vs male | 0.96 (0.72-1.29) | .79 | — | — |
| Rai stage at diagnosis, 1 unit increase | 1.35 (1.19-1.53) | <.0001 | 1.16 (1.01-1.34) | .03 |
| Concomitant moAB vs none | 0.82 (0.58-1.16) | .26 | — | — |
| Previously treated vs TN | 3.09 (1.76-5.43) | <.0001 | 2.64 (1.49-4.67) | .0009 |
| ECOG PS score vs 0 | ||||
| 1 | 2.00 (1.47-2.71) | <.0001 | 1.64 (1.19-2.25) | .0023 |
| 2 | 6.73 (3.74-12.12) | <.0001 | 4.01 (2.16-7.42) | <.0001 |
| Hemoglobin, 1 unit increase | 0.85 (0.79-0.90) | <.0001 | 0.93 (0.86-1.00) | .05 |
| Platelets, 50 unit increase | 0.82 (0.74-0.91) | .0004 | — | — |
| WBC count, twofold increase | 1.02 (0.95-1.09) | .58 | — | — |
| LDH ≥ULN vs ≤ULN | 1.74 (1.31-2.31) | .0001 | 1.40 (1.04-1.88) | .03 |
| FISH del(11q) vs no del(11q) | 1.06 (0.80-1.41) | .68 | — | — |
| FISH trisomy 12 vs no trisomy 12 | 1.40 (1.03-1.90) | .03 | — | — |
| FISH del(13q) vs no del(13q) | 1.02 (0.79-1.33) | .87 | — | — |
| FISH del(17p) vs no del(17p) | 1.83 (1.40-2.38) | <.0001 | — | — |
| IGHV unmutated vs mutated | 1.63 (0.93-2.84) | .09 | — | — |
| Karyotypic complexity, 1 unit increase | 1.07 (1.04-1.10) | <.0001 | 1.07 (1.04-1.10) | <.0001 |
| Presence of structural abnormality vs none | 2.32 (1.68-3.20) | <.0001 | — | — |
del(11q), deletion of 11q; del(13q), deletion of 13q; ULN, upper limit of normal.
Univariable and multivariable analysis of OS
| Univariable model | Multivariable model | |||
|---|---|---|---|---|
| HR (95% CI) | P | HR (95% CI) | P | |
| Age, 5-y increase | 1.18 (1.07-1.29) | .0005 | 1.18 (1.07-1.30) | .0007 |
| Female vs male | 0.89 (0.62-1.28) | .53 | — | — |
| Rai stage at diagnosis, 1 unit increase | 1.50 (1.27-1.77) | <.0001 | 1.32 (1.11-1.57) | .0015 |
| Concomitant moAB vs none | 0.90 (0.60-1.37) | .63 | — | — |
| Previously treated vs TN | 4.40 (1.94-10.0) | .0004 | 3.47 (1.51-7.95) | .0033 |
| ECOG PS score vs 0 | ||||
| 1 | 2.66 (1.76-4.02) | <.0001 | 2.11 (1.38-3.22) | .0007 |
| 2 | 7.13 (3.63-14.02) | <.0001 | 5.03 (2.52-10.04) | <.0001 |
| Hemoglobin, 1 unit increase | 0.82 (0.76-0.89) | <.0001 | — | — |
| Platelets, 50 unit increase | 0.78 (0.68-0.90) | .0004 | — | — |
| WBC count, twofold increase | 0.94 (0.86-1.02) | .12 | 0.92 (0.85-1.00) | .05 |
| LDH ≥ULN vs ≤ULN | 1.86 (1.31-2.64) | .0005 | 1.59 (1.10-2.30) | .01 |
| FISH del(11q) vs no del(11q) | 0.98 (0.69-1.39) | .91 | — | — |
| FISH trisomy 12 vs no trisomy 12 | 1.42 (0.98-2.05) | .07 | — | — |
| FISH del(13q) vs no del(13q) | 1.14 (0.82-1.57) | .44 | — | — |
| FISH del(17p) vs no del(17p) | 1.97 (1.42-2.72) | <.0001 | — | — |
| IGHV unmutated vs mutated | 1.38 (0.70-2.73) | .35 | — | — |
| Karyotypic complexity, 1 unit increase | 1.09 (1.06-1.13) | <.0001 | 1.09 (1.05-1.12) | <.0001 |
| Presence of structural abnormality vs none | 2.01 (1.36-2.98) | .0005 | — | — |
del(11q), deletion of 11q; del(13q), deletion of 13q; ULN, upper limit of normal.
IGHV mutational status was also highly associated with karyotypic complexity (P = .0002), where the rate of unmutated IGHV was 70% and 87% in patients with <5 or ≥5 cytogenetic abnormalities, respectively. Among 394 patients with known IGHV status, IGHV unmutated disease was significant for inferior PFS (P = .02) (supplemental Figure 4A) but not OS (P = .22) (supplemental Figure 4B). Using multiple imputation to account for missing data and assuming proportional hazards, IGHV status was no longer significant for PFS (Table 3), but this was largely attributed to a lack of difference in the risk of progression or death between groups in the first 2 years (HR for PFS, 1.07; 95% CI, 0.47-2.42; P = .88) (supplemental Table 2). After 2 years, the risk of progression or death was higher for patients with unmutated disease (HR, 2.48; 95% CI, 1.40-4.41; P = .0020). This delayed impact of IGHV mutational status on PFS was observed in the PFS curves and was consistent among patients with <5 karyotypic abnormalities and in patients with ≥5 karyotypic abnormalities (supplemental Figure 4C). A similar but less striking pattern was observed for OS (supplemental Figure 4D).
Presence of a structural abnormality was also highly associated with karyotypic complexity (P < .0001), in which a structural abnormality was present in 47% of patients with <5 cytogenetic abnormalities but was present in all patients with ≥5 cytogenetic abnormalities. Presence of a structural abnormality as a sole variable was significant for both inferior PFS (HR, 2.32; 95% CI, 1.68-3.20; P < .0001) (supplemental Figure 5A) and OS (HR, 2.01; 95% CI, 1.36-2.98; P = .0005) (supplemental Figure 5B). In patients having <5 karyotypic abnormalities, those with a structural abnormality had a worse PFS than those without, and patients having ≥5 karyotypic abnormalities (all with structural abnormality) had even worse PFS (supplemental Figure 5C). For OS, the presence of a structural abnormality did not seem to add prognostic information in patients with <5 karyotypic abnormalities, and those with ≥5 karyotypic abnormalities (all with structural abnormality) had inferior OS (supplemental Figure 5D).
When comparing patients with only balanced rearrangements vs those with only unbalanced rearrangements, we found no differences in either PFS or OS but a trend toward inferior OS in those with unbalanced rearrangements (supplemental Figure 6). Among 103 patients with a balanced rearrangement, the median number of rearrangements was 1 (range, 1-4), and among 257 patients with unbalanced rearrangements, the median number of rearrangements was 2 (range, 1-16). In 287 patients with any rearrangement, increasing number of rearrangements was a significant prognostic variable for PFS (HR, 1.05; 95% CI, 1.00-1.09; P = .05) and OS (HR, 1.10; 95% CI, 1.05-1.16; P < .0001), which is concordant with our overall conclusions.
Due to sophisticated relationships among variables that can be difficult to capture using bivariable Kaplan-Meier analyses in which karyotypic complexity was dichotomized, multivariable models were constructed including karyotypic complexity as a continuous variable. The multivariable models largely reflected the bivariable Kaplan-Meier analyses. When controlling for other important variables, increasing karyotypic complexity was an independent prognostic factor for inferior PFS (HR, 1.07; 95% CI, 1.04-1.10; P < .0001). In addition to karyotypic complexity, the final model for PFS included Rai stage, RR status, ECOG PS score, hemoglobin, and LDH (Table 3). If we allowed the HR to change over time for IGHV status, then IGHV status remained in the final model (supplemental Table 2). With respect to OS, increasing karyotypic complexity was an independent prognostic factor (HR, 1.09; 95% CI, 1.05-1.12; P < .0001). In addition to karyotypic complexity, the final OS model included age, Rai stage, RR status, ECOG PS score, LDH, and WBC count (Table 4). The final OS model did not include other cytogenetic or molecular features considered. Of note, the interaction term between complexity and prior treatment status was not significant for PFS (P = .31) or for OS (P = .81), suggesting the prognostic effect of karyotypic complexity on PFS and OS did not differ between TN and RR patients (supplemental Figure 7).
Significance of karyotype evolution at progression
At progression, 75 patients had a cytogenetic analysis performed that met our inclusion criteria. Ninety-six percent of patients had cytogenetic analysis attained 6 months before or after the progression date. Of the 75 patients assessed, median number of cytogenetic abnormalities was 5 (range, 0 to ≥20); 4%, 20%, 16%, 36%, 8%, and 16% of patients had 0, 1 to 2, 3 to 4, 5 to 9, 10 to 14, and ≥15 cytogenetic abnormalities. Fifty-six percent had an increase in number of chromosomal abnormalities from baseline, and 80% of patients showed karyotype evolution at progression of disease (Table 5).
Genetic characteristics at progression of disease
| Value (n = 75) | |
|---|---|
| No. of cytogenetic abnormalities | |
| Median (range) | 5 (0 to ≥20) |
| No. (%) | |
| 0 | 3 (4) |
| 1-2 | 15 (20) |
| 3-4 | 12 (16) |
| 5-9 | 27 (36) |
| 10-14 | 6 (8) |
| ≥15 | 12 (16) |
| Change in number of cytogenetic abnormalities from ibrutinib start to progression | |
| Median (range) | 1 (–8 to 13) |
| No. (%) | |
| No change or decrease in abnormalities | 33 (44) |
| Increase in abnormalities | 42 (56) |
| Karyotype evolution | 60 (80) |
Using a landmark of progression, higher number of abnormalities continued to indicate worse survival after disease progression. Median survival from time of progression had not been reached for 30 patients with <5 cytogenetic abnormalities at time of progression. Twenty-seven patients with 5 to 9 abnormalities had a median survival of 25 months (95% CI, 15-42), 6 patients with 10 to 14 abnormalities had a median survival of 5 months (95% CI, 1-50), and 12 patients with ≥15 abnormalities had a median survival of 7 months (95% CI, 2-13) (Figure 2A). We found that patients who acquired a new clone, also referred to as karyotype evolution, at progression had significantly worse survival compared with those who did not acquire a new clone (median survival 23 months vs not reached; P = .02) (Figure 2B). Although the survival for patients who had a higher number of abnormalities at progression relative to baseline tended to be worse than those who did not, statistical significance was not reached (median survival 23 vs 34 months; P = .14) (Figure 2C). We generated Kaplan-Meier curves to examine the interaction between developing a new clone and having an increase in cytogenetic abnormalities from baseline to progression with outcome. As shown, regardless of an increase in number of abnormalities, presence of a new clone predisposed patients to inferior postprogression survival (supplemental Figure 8).
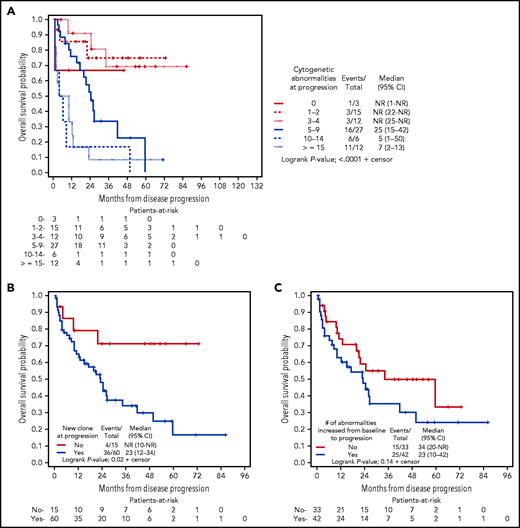
Kaplan-Meier curves depicting OS postprogression. OS was grouped according to presence of: (A) number of cytogenetic abnormalities at progression; (B) presence of karyotype evolution (new clone) at progression; and (C) increase in abnormalities present at progression.
Kaplan-Meier curves depicting OS postprogression. OS was grouped according to presence of: (A) number of cytogenetic abnormalities at progression; (B) presence of karyotype evolution (new clone) at progression; and (C) increase in abnormalities present at progression.
Discussion
In this large single-center retrospective analysis, we found that increasing karyotypic complexity is an independent predictor of survival for patients with CLL treated with ibrutinib. In addition, karyotype evolution is an important prognostic marker at progression after ibrutinib.
CK, defined as ≥3 abnormalities, has been recognized as a prognostic factor in CLL for many decades15 and continues to be evaluated in prospective clinical trials with small molecule inhibitors. Recently, Baliakas et al19 concluded that CK defined as ≥5 abnormalities may be of greater prognostic significance than ≥3 abnormalities in a large cohort study of patients with CLL primarily treated with chemoimmunotherapy, and that evaluation of complexity beyond 3 chromosome abnormalities should be validated in prospective trials. In addition, in a score that predicts outcomes for patients receiving a stem cell transplantation for CLL, ≥5 abnormalities was prognostic of PFS.25 Similarly, we also found that there was a substantial decrease in survival once 5 abnormalities are reached. Furthermore, the trend continues to worsen as complexity increases past 5 abnormalities, with patients having ≥10 or ≥15 abnormalities having particularly poor survival. To our knowledge, this study is the first to report outcomes on patients with these ultra-complex karyotypes.
Various models have been created to help predict outcomes in patients treated for CLL. While developing a 4-factor score that predicts outcomes for patients treated with ibrutinib, Ahn et al26 reported that CK was prognostic for both PFS and OS; however, CK was not included in the score developed due to missing data. We were unable to attempt validation of this 4-factor score in our data, as a large number of data points were missing for β2-microglobulin. Because real-world studies have shown that conventional chromosome analysis is underused,27 and can detect more abnormalities and refine risk categorization compared with standard FISH,28 our study reaffirms the importance of this testing for prognosis.
It seems that the interplay between karyotypic complexity, del(17p), and IGHV mutational status is complex. Prior studies have shown that del(17p) and IGHV unmutated status may not be as prognostically important when a Bruton-tyrosine kinase inhibitor is used.7,8,13 Here, we show that del(17p) is strongly associated with CK defined as ≥5 abnormalities. Although del(17p) was highly prognostic as a singular variable, it did not provide additional significant prognostic value when CK was accounted for. Thus, when karyotype is not available, del(17p) can be very helpful, but when a karyotype is available, complexity data may provide more valuable prognostic information. Although IGHV mutational status is also highly correlated with complexity and del(17p), it seems to be a less important variable on its own, particularly early in the course of therapy. In our data, after 2 years on therapy, IGHV unmutated status was a prognostically important independent variable for PFS. This interesting observation should be evaluated in other data sets.
Whether specific chromosomal abnormalities drive the significance of CK is a question that continues to be elucidated. Our group and others have shown that the presence of translocations may be prognostic of survival in TN disease and as a predictor for time to first treatment.20,21,29-31 Translocations have been evaluated previously in a smaller study in patients mostly treated with chemoimmunotherapy, in which they were not statistically significant when CK ≥3 was considered.32 In another previous study, unbalanced structural abnormalities had been identified as a potential independent prognostic feature for OS in CLL, but this study did not account for treatment received.20 We show that structural abnormalities (which includes translocations) portends a worse prognosis but was not an independent variable for PFS nor OS when increasing karyotypic complexity was considered. We did not observe a difference in survival between the presence of unbalanced vs balanced structural abnormalities.
Determining the presence of clonal evolution by using whole-exome and whole-genome sequencing has been well documented in CLL.33,34 Presence of subclonal driver mutations and clonal shifts occurring while on ibrutinib may also be prognostic of worse outcomes.35,36 Few studies have looked at sequential karyotype analysis in CLL, with one study showing clonal evolution by chromosome analysis occurring in 45.8% of patients untreated over 24 months, with patients who exhibited clonal evolution more likely to have disease progression.29 To our knowledge, this study is the largest to examine change in karyotype complexity over time and to evaluate the impact in the development of karyotype evolution on outcomes of patients treated for CLL. Patients with evolution of karyotype at progression, as evidenced by emergence of a new subclone at progression or unrelated clone compared with baseline, regardless of an increase in cytogenetic abnormalities, fared particularly poorly with significantly worse OS than those with no karyotype evolution. Our study suggests that future research could explore sequential chromosome analysis throughout treatment, to determine whether increasing karyotypic complexity can be identified during the course of therapy and may be a predictor of progression and survival.
This study is one of the largest trials with the longest follow-up reporting outcomes of patients with CLL treated with ibrutinib and is a particularly high-risk cohort of patients. Remarkably, the median OS was 95 months in a combined cohort of RR and TN patients. For TN patients, after a median follow-up of 32 months, our estimated 5-year OS was 93.1%, with only 6 deaths of 101 patients. Comparably, in the long-term follow-up of RESONATE-2 (Open-label, Phase 3 BTK Inhibitor Ibrutinib vs Chlorambucil Patients 65 Years or Older with Treatment-naive CLL or SLL), a phase 3 trial of ibrutinib vs chlorambucil for TN CLL, the estimated 5-year OS was reported as 83%.37 Furthermore, 66% of patients discontinued ibrutinib, with only 38% discontinuing due to an adverse event. This discontinuation due to an adverse event rate is lower than what has been previously reported in the literature,38 and it may represent our institute’s familiarity with management of ibrutinib toxicity and the inclusion of many of these patients in clinical trials in which discontinuation rates are lower. Although these results are from a single academic center, they are very promising and continue to show the impact of ibrutinib on the treatment of CLL.
As a limitation to our study, sequencing for gene-specific mutations was not performed in the majority of patients. Because our patient cohort spanned the past decade, many of our patients did not receive this testing as its use has only recently been adopted clinically. Presently, the only gene with sufficiently robust data for recommended testing per iwCLL criteria is TP53.3 Presence of del(17p) by FISH and TP53 mutation frequently cooccur33,39; therefore, we would anticipate the proportion of our cohort that would be recategorized, were this testing performed, to be small. More research is needed to determine the applicability of recurrent genetic mutations in CLL in the setting of increasing karyotypic complexity.
Standardized methodology for the analysis of karyotype complexity in CLL has historically been lacking. Given the increased abnormality detection rate, karyotype complexity should be assessed in cultures stimulated with CpG oligodeoxynucleotides.10-12 Importantly, the ISCN does not address how to assign complexity, which can be challenging in the setting of ultra-complex karyotypes. To limit variability between laboratories and promote consistency in laboratory practices across disease types, we and others advocate adapting the International Working Group on MDS Cytogenetics guidelines, originally developed for myelodysplastic syndrome, for assigning complexity in CLL.23,40
Our study highlights that total number of karyotypic abnormalities should be reported in prospective clinical trials. Furthermore, karyotypic complexity as a continuous variable should be considered in future models that predict outcomes for patients with CLL. Further research to determine if karyotypic complexity is prognostic in small molecule inhibitors other than Bruton-tyrosine kinase inhibitors is needed to further validate this variable.
Acknowledgments
The authors thank the patients and their families, as well as the nurses, pharmacists, advanced practitioners, and other support staff from The Ohio State University, James Comprehensive Cancer Center, who provided patient care.
K.A.R. is a Scholar in Clinical Research of The Leukemia & Lymphoma Society.
Authorship
Contribution: A.S.K., C.M., D.G., K.B., D.A.B., S.A.B., K.A.R., and J.A.W. collected and interpreted data; Y.H., L.V.A., N.A.H., and A.S.R. interpreted data; A.S.K., S.A.B., D.A.B., M.R.G., K.A.R, J.C.B., and J.A.W. provided patient care; A.S.K., C.M., D.G., Y.H., and J.A.W. were involved in the conception and design of the study; A.S.K., C.M., D.G., Y.H., and J.A.W. wrote the manuscript; and all authors analyzed the data, edited and revised the manuscript, provided critical intellectual content, and approved the revised manuscript.
Conflict-of-interest disclosure: A.S.K. consulted for Bristol Myers Squibb, AbbVie, and Janssen. S.A.B. consulted for Pharmacyclics, Janssen, BeiGene, and AstraZeneca; received honorarium from OncLive; and received a travel grant from ArQule. M.R.G. consults for Pharmacyclics and AstraZeneca; serves on the Data and Safety Monitoring Board for Acerta Pharma and Axios, Inc.; and receives research funding from the Hairy Cell Leukemia Foundation. K.A.R. consulted for Acerta Pharma, AstraZeneca, Pharmacyclics, Innate Pharma, Genentech, and AbbVie; receives research funding from Genentech, AbbVie, Novartis, and Janssen; and received travel funding from AstraZeneca. A.S.R. serves on an independent Data and Safety Monitoring Board for Telios Pharma. J.C.B. receives research support from Janssen, Genentech, Pharmacyclics, and Acerta; and is the founder of and has financial interest in Vincerx. J.A.W. consulted for Pharmacyclics, Janssen, AstraZeneca, AbbVie, BeiGene, and ArQule; and receives research laboratory support from Loxo and AbbVie. The remaining authors declare no competing financial interests.
Correspondence: Adam S. Kittai, 1140D Lincoln Tower, 1800 Cannon Dr, Columbus, OH 43210; e-mail: Adam.kittai@osumc.edu.
The online version of this article contains a data supplement.
There is a Blood Commentary on this article in this issue.
The publication costs of this article were defrayed in part by page charge payment. Therefore, and solely to indicate this fact, this article is hereby marked “advertisement” in accordance with 18 USC section 1734.

This feature is available to Subscribers Only
Sign In or Create an Account Close Modal