

Key Points
Deep RNA-sequencing reveals the global landscape of RNA editing in the mouse hematopoietic system.
Azin1 is an editable and functional gene in hematopoietic stem cells.

Abstract
Adenosine-to-inosine RNA editing and the catalyzing enzyme adenosine deaminase are both essential for hematopoietic development and differentiation. However, the RNA editome during hematopoiesis and the underlying mechanisms are poorly defined. Here, we sorted 12 murine adult hematopoietic cell populations at different stages and identified 30 796 editing sites through RNA sequencing. The dynamic landscape of the RNA editome comprises stage- and group-specific and stable editing patterns, but undergoes significant changes during lineage commitment. Notably, we found that antizyme inhibitor 1 (Azin1) was highly edited in hematopoietic stem and progenitor cells (HSPCs). Azin1 editing results in an amino acid change to induce Azin1 protein (AZI) translocation to the nucleus, enhanced AZI binding affinity for DEAD box polypeptide 1 to alter the chromatin distribution of the latter, and altered expression of multiple hematopoietic regulators that ultimately promote HSPC differentiation. Our findings have delineated an essential role for Azin1 RNA editing in hematopoietic cells, and our data set is a valuable resource for studying RNA editing on a more general basis.
Introduction
Hematopoietic stem and progenitor cell (HSPC) homeostasis requires the coordination of complex pathways that balance HSPC self-renewal with differentiation into mature blood cells.1 Genes involved in cell cycle regulation, apoptosis, and transcriptional regulation have essential roles in this process, as does epigenetics.2-8 For example, posttranscriptional modifications such as RNA editing, which alters sequence information at the RNA level, are also known to regulate HSPC function.9-12
Adenosine-to-inosine (A-to-I) RNA editing is the most prevalent form of RNA editing in mammals.13 Inosine is interpreted as guanosine in sequencing data, with A-to-I editing being identified as A-to-G mismatches.14 The process is catalyzed by adenosine deaminase acting on RNA (ADAR) proteins.15 Among members of the ADAR protein family, ADAR1 is widely expressed in various tissues and is involved in hematopoiesis. Adar1 knockout in mice causes embryonic lethality, potentially because of defective hematopoiesis in the fetal liver.10,16,17 Furthermore, in adult hematopoiesis, conditional deletion of Adar1 alleles impairs the ability of hematopoietic stem cells (HSCs) to replenish because of defective differentiation into progenitors and mature blood cells.9,12 However, the underlying mechanisms were formerly unknown.
Here, we performed comprehensive DNA-sequencing (DNA-seq) and RNA-sequencing (RNA-seq) analysis across 12 murine hematopoietic populations to identify A-to-I editing sites and map the RNA editing landscape during hematopoiesis. We identified several stage-specific editing sites, including 1 re-coding editing site in Azin1, which was highly edited in HSPCs. Edited Azin1 sustained HSPC differentiation by enhancing its protein binding affinity for DEAD box polypeptide 1 (DDX1) and by affecting various hematopoietic regulators. Our findings provide a valuable resource for future studies of RNA editing in hematopoiesis.
Materials and methods
Mice
All laboratory mice were maintained at the State Key Laboratory of Experimental Hematology (SKLEH; Tianjin, China). C57BL/6J and B6.SJL-PtprcaPepcb/BoyJ mice (8-12 weeks old) were used as a source for donors or recipients. Adar1fl/fl mice on a C57BL/6 background were generated during a previous study.12 Azin1fl/fl mice were purchased from Biocytogen. All animal procedures were performed in compliance with the animal care guidelines approved by the Institutional Animal Care and Use Committees of the SKLEH and the Institute of Hematology.
RNA extraction and RNA-seq library construction
For RNA-seq, bone marrow (BM) cells were isolated from 8- to 12-week-old female C57BL/6J (CD45.2+) mice, and 12 continuous hematopoietic populations were sorted by fluorescence-activated cell sorting based on cell surface markers (supplemental Table 1, available at the Blood Web site). RNA was purified using an RNeasy Plus Mini kit (QIAGEN, Hilden, Germany), and genomic DNA (gDNA) contamination was removed by using a specially designed gDNA Eliminator spin column (QIAGEN). A ribosomal RNA–removal, strand-specific RNA library was then constructed (Novogene, Beijing, China).
RNA-seq and gDNA sequencing
Total RNA from the 12 hematopoietic populations was sequenced with 150 bp paired-end reads, and raw sequencing data were deposited in the Gene Expression Omnibus (GEO) database under the accession number GSE142216. gDNA data were obtained from Lineage−Sca1+c-Kit+ (LSK+) HSPCs and sequenced with 150 bp paired-end reads.
Colony-forming unit (CFU) assay
Transduced green fluorescent protein (GFP+) cells were sorted and plated in 24-well plates in 0.5 mL methylcellulose medium (MethoCult GF M3434; STEMCELL Technologies) at a density of 2000 cells per mL with 5 to 6 replicate wells. The medium was supplemented with 1% penicillin/streptomycin (Gibco/Thermo Fisher Scientific) and 10 ng/mL murine interleukin-3. The cells were incubated at 37°C with 5% CO2 for 7 days, after which they underwent E (burst-forming unit erythroid [BFU-E]), GM (CFU-granulocyte-macrophage [CFU-GM], CFU-granulocyte [CFU-G], CFU-macrophage [CFU-M]), and mix (CFU-granulocyte, erythrocyte, megakaryocyte, macrophage [CFU-GEMM]) quantification.
BM transplantation
For competitive BM transplantation, donor BM cells were isolated from the ilium, tibiae, and femurs of 8-week-old female wild-type (WT) mice (CD45.1+) or Azin1fl/fl;ER-Cre mice (CD45.2+) by flushing the cells out of the bone by using a syringe. The c-Kit+ cells were enriched using CD117 microbeads (Miltenyi Biotec) and then transduced with a GFP-tagged lentivirus (overexpression or knockdown) after pre-stimulation. After 48 hours, transduction efficiency was determined by flow cytometry, and 5 × 10⁵ c-Kit+ cells were transplanted into 8-week-old CD45.2+ or CD45.1+ mice that had been lethally irradiated with a split dose totaling 9.0 Gy of X-ray irradiation. Secondary transplantation was performed by transplanting 3 × 10⁶ BM cells from the primary recipients into the lethally irradiated secondary recipients.
The supplemental Methods provide detailed information concerning human BM and cord blood processing, cell culture, vector and lentiviral production and transduction, quantitative reverse transcriptase polymerase chain reaction analysis, nuclear-cytoplasmic fractionation, co-immunoprecipitation, western blot analysis, immunofluorescence assays, proximity ligation assays, chromatin immunoprecipitation (ChIP) sequencing.
Statistics and reproducibility
Two-tailed unpaired Student t tests were used to compare parametric data. When more than 2 groups were compared, a 1-way analysis of variance (ANOVA) using Bonferroni post hoc analysis was used. All statistics were calculated using Prism 7 software (GraphPad Software, La Jolla, CA). The level of statistical significance and the number of technical or biological replicates are reported in the respective Figure legends. P < .05 indicates a statistically significant difference.
Results
A-to-I RNA editing is prevalent across 12 hematopoietic cell populations
Aiming to comprehensively analyze the hematopoietic editome, we obtained 2927 million 150-bp paired-end DNA-seq reads from HSPCs and 4440 million 150-bp paired-end RNA-seq reads from 12 murine hematopoietic cellular populations. These included long-term HSCs (LT-HSCs) and short-term HSCs (ST-HSCs), multipotent progenitor (MPP) cells, common myeloid progenitor (CMP) cells, megakaryocyte-erythroid progenitor (MEP) cells, granulocyte-monocyte progenitor (GMP) cells, megakaryocytes (MKs), 2 erythrocyte subsets (Ery-A and Ery-B), granulocytes, monocytes, and macrophages18-20 (Figure 1A; supplemental Figure 1A; supplemental Table 1). A total of 30 796 RNA editing sites were identified in 12 hematopoietic populations (Figure 1B; supplemental Figure 1B; supplemental Table 2). To control detection bias and remove false nonedited sites, sites were defined as not detected in a given population when read coverage was <10. Consistent with previous findings that A-to-I RNA editing is the most prevalent type of RNA editing in animal cells,13,21 A-to-I (A-to-G) base substitution accounted for 93.39% of the 12 possible base substitutions (supplemental Table 3). The A-to-I editing motif was similar to that reported in previous studies21 (Figure 1B). We also verified 70 of 79 randomly selected editing sites via polymerase chain reaction amplification and Sanger sequencing (supplemental Figure 1C-D; supplemental Table 4), further confirming the validity of our RNA editing profiles in hematopoietic cells.
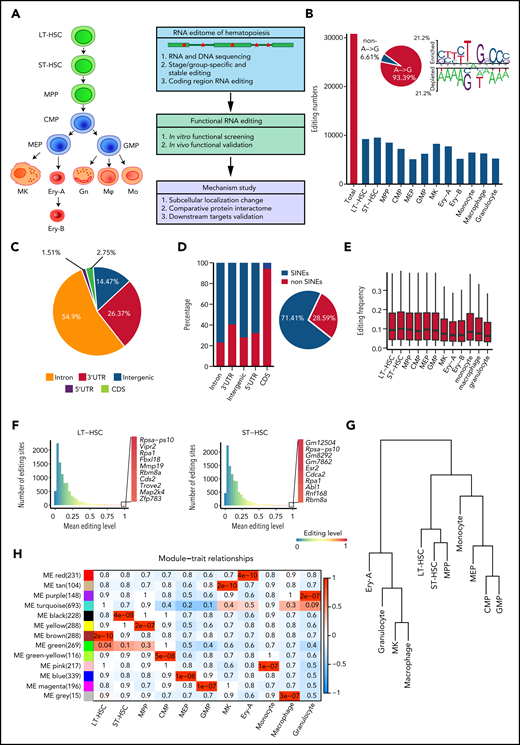
RNA editome during hematopoiesis. (A) Schematic of the experimental procedure. Briefly, we outlined the RNA editome during hematopoiesis, identified numerous editing events involved in regulating hematopoietic stem and progenitor cells, and explored the underlying mechanisms. (B) The number of editing sites in each population. The A-to-G nucleotide substitution, indicating A-to-I editing, is disproportionately enriched (pie chart) and RNA editing motif. (C) The distribution of editing sites across different genomic elements. (D) The proportion of editing sites within and outside SINEs across different genomic elements; pie chart shows the proportion of editing sites within and outside SINEs. (E) The distribution of RNA editing frequency within each hematopoietic population. (F) The distribution of RNA editing frequency within LT-HSCs (left) and ST-HSCs (right). The color (from blue to red) indicates the editing frequency (from 0 to 1). (G) A dendrogram of hierarchical clustering of editing sites within each population. (H) A co-editing network analysis of 3132 sites detected 13 regulatory modules. The heat map shows the correspondence between cell types and editing modules, which is color-coded as the correlation coefficient (–1 to 1). The tiles are labeled with the P value. Gn, granulocytes; Mφ, macrophages; Mo, monocytes.
RNA editome during hematopoiesis. (A) Schematic of the experimental procedure. Briefly, we outlined the RNA editome during hematopoiesis, identified numerous editing events involved in regulating hematopoietic stem and progenitor cells, and explored the underlying mechanisms. (B) The number of editing sites in each population. The A-to-G nucleotide substitution, indicating A-to-I editing, is disproportionately enriched (pie chart) and RNA editing motif. (C) The distribution of editing sites across different genomic elements. (D) The proportion of editing sites within and outside SINEs across different genomic elements; pie chart shows the proportion of editing sites within and outside SINEs. (E) The distribution of RNA editing frequency within each hematopoietic population. (F) The distribution of RNA editing frequency within LT-HSCs (left) and ST-HSCs (right). The color (from blue to red) indicates the editing frequency (from 0 to 1). (G) A dendrogram of hierarchical clustering of editing sites within each population. (H) A co-editing network analysis of 3132 sites detected 13 regulatory modules. The heat map shows the correspondence between cell types and editing modules, which is color-coded as the correlation coefficient (–1 to 1). The tiles are labeled with the P value. Gn, granulocytes; Mφ, macrophages; Mo, monocytes.
A-to-I RNA editing events predominantly occurred in noncoding regions
To characterize the RNA editome, we investigated the distribution of RNA editing across the genome. Most RNA editing sites were located in introns (54.9%) and 3'-untranslated regions (3' UTRs; 26.37%); only 1.51% of sites were located in coding sequence (CDS) regions (Figure 1C). Higher levels of RNA editing were found in intergenic regions compared with other regions (supplemental Figure 2A). Moreover, 71.41% of RNA editing occurred within short interspersed nuclear elements (SINEs), with introns comprising a higher percentage of editing sites within SINEs than in non-SINEs. However, most editing sites in the CDS regions were in non-SINEs (Figure 1D).
Global RNA editing frequency was stable across the 12 hematopoietic populations (Figure 1E), but Adar1 and Adar2 expression profiles varied (supplemental Figure 2B). Notably, Adar1 expression was higher than that of Adar2. The editing frequencies of most editing sites in Adar1 knockout c-Kit+ cells were decreased, suggesting that ADAR1 was involved in RNA editing in hematopoietic cells (supplemental Figure 2C). Furthermore, the correlation coefficient of Adar1 and overall editing levels was 0.41; for Adar2 and overall editing levels, this coefficient was just 0.19. This indicated that Adar1 and Adar2 contributed differently to RNA editing (supplemental Figure 2D), although both contributed more to the editing of repetitive coding sites than to non-repetitive coding sites (supplemental Figure 2E-F). Although per-site editing frequency was generally <0.1 for each population, each population possessed certain editing sites that underwent particularly high levels of editing (Figure 1F; supplemental Figure 2G).
The RNA editome during hematopoiesis is dynamic
Although the global editing frequency of each population was stable (Figure 1E), the RNA editome was dynamic across hematopoietic cell differentiation. Cell types were classified according to the similarity of their editomes by using unsupervised hierarchical clustering of editing sites. Monocytes were closer to committed progenitors than granulocytes and macrophages (Figure 1G). Further co-editing network analysis revealed 13 distinct modules: 11 population-specific modules and 2 relatively broad modules (Figure 1H; supplemental Figure 2H), indicating that the RNA editomes of different hematopoietic populations are markedly different.
To build a comprehensive map of editing patterns among 12 populations, we analyzed 14 233 editing sites with editing frequencies >0.1 in at least 1 population. We identified 7857 sites that were cell type–specific and were termed “stage-specific editing sites.” We also classified the hematopoietic cell populations into 3 groups on the basis of their differentiation potential: (1) multipotent stem and progenitor cells, including LT-HSCs, ST-HSCs and MPP cells; (2) committed progenitors, including CMP cells, MEP cells, and GMP cells; and (3) mature cells, including MKs, Ery-A and Ery-B subsets, monocytes, macrophages, and granulocytes.20 These were termed “group-specific editing sites” (Figure 2A). In addition, 298 sites were always edited, and these were termed “stable editing sites.” The dynamic landscape of the RNA editome suggests that RNA editing may represent an additional regulatory layer for hematopoiesis.
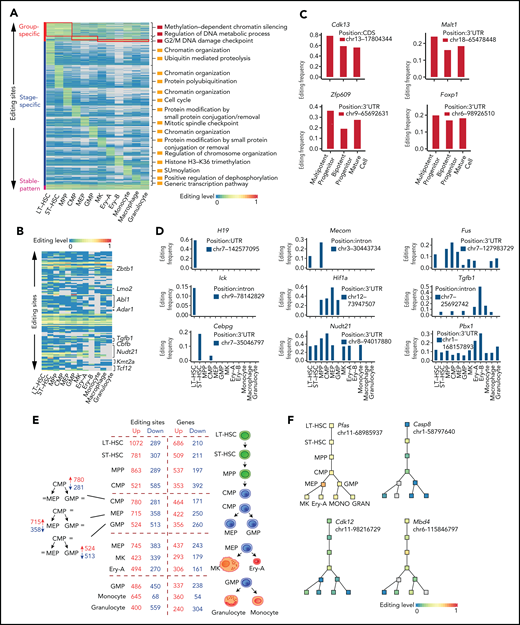
Functional relevance of RNA editing in hematopoiesis. (A) A heat map of the editing frequency from 9186 sites that are specially edited in a single population or group or stably edited across 12 populations. The color (from blue to red) indicates the editing frequency (from 0 to 1) for a given site (row) in a population (column) (G2/M indicates cell cycle G2 phase to M phase; SUMOylation indicates that Small Ubiquitin-like Modifier (or SUMO) proteins covalently attached to and detached from other proteins in cells to modify their function). Gray indicates a nondetected editing site. The top 1/2 enriched GO terms are displayed on the right of a given population. (B) A heat map of the RNA editing events within HPC differentiation-related genes. The color (from blue to red) indicates the editing frequency (from 0 to 1) for a given site (row) in a population (column). Gray indicates a missing editing value. (C) Representative examples of group-specific RNA editing sites within hematopoiesis related genes. (D) Representative examples of stage-specific RNA editing sites within hematopoiesis related genes. (E) A summary of the number of editing sites and genes changing at each lineage commitment point. (F) Representative examples of specific editing events within the hematopoietic hierarchy. chr, chromosome; GRAN, granulocyte; MONO, monocyte.
Functional relevance of RNA editing in hematopoiesis. (A) A heat map of the editing frequency from 9186 sites that are specially edited in a single population or group or stably edited across 12 populations. The color (from blue to red) indicates the editing frequency (from 0 to 1) for a given site (row) in a population (column) (G2/M indicates cell cycle G2 phase to M phase; SUMOylation indicates that Small Ubiquitin-like Modifier (or SUMO) proteins covalently attached to and detached from other proteins in cells to modify their function). Gray indicates a nondetected editing site. The top 1/2 enriched GO terms are displayed on the right of a given population. (B) A heat map of the RNA editing events within HPC differentiation-related genes. The color (from blue to red) indicates the editing frequency (from 0 to 1) for a given site (row) in a population (column). Gray indicates a missing editing value. (C) Representative examples of group-specific RNA editing sites within hematopoiesis related genes. (D) Representative examples of stage-specific RNA editing sites within hematopoiesis related genes. (E) A summary of the number of editing sites and genes changing at each lineage commitment point. (F) Representative examples of specific editing events within the hematopoietic hierarchy. chr, chromosome; GRAN, granulocyte; MONO, monocyte.
RNA editing has functional relevance to hematopoiesis at different stages
We next explored the functional relevance of RNA editing and found that different groups or stages of editing had different biological functions (Figure 2A; supplemental Figure 3A-B), implying that RNA editing regulates hematopoiesis in a multidimensional manner. Previous studies have reported that RNA editing is essential for both embryonic erythropoiesis10 and adult HSPC differentiation.9,12 Furthermore, the cell cycle transition is also involved in HSPC differentiation.2,4 We found 3 patterns of RNA editing events (stage-specific editing, group-specific editing, and stable editing) occurring in either hematopoietic progenitor cell (HPC) differentiation-related genes or cell cycle–related genes: 117 editing sites were identified within 40 HPC differentiation–related genes (Figure 2B), and 149 editing sites were identified within 40 cell cycle–related genes (supplemental Figure 4A). These results imply that RNA editing might participate in hematopoiesis by editing HPC differentiation– or cell cycle–related genes.
An additional 99 group-specific editing sites were identified within 53 hematopoietic genes (supplemental Figure 4B). For example, Cdk13, which is involved in the maintenance of murine stem cell self-renewal,22 had similar expression levels among the 3 hematopoietic populations (supplemental Table 5) but was highly edited in MPP cells. Likewise, Malt1,23,Zfp609, and Foxp1 were specifically edited in different groups (Figure 2C; supplemental Figure 4C). These findings suggest that group-specific editing might participate in the regulation of MPP cells. In addition, 269 genes exhibited hematopoietic stage-specific editing patterns (supplemental Figure 4D). One such gene was H19, which is involved in HSC development and function24,25 and was expressed in LT-HSCs, ST-HSCs, MPP cells, and CMP cells (supplemental Figure 4E; supplemental Table 5) but was edited only in LT-HSCs. This finding suggests that edited H19 is involved in LT-HSC maintenance (Figure 2D). Furthermore, Mecom,26,Fus, Ick,27 Hif1a,28 Tgfb1, Cebpg, Nudt21, and Pbx1 were also specifically edited during hematopoiesis (Figure 2D; supplemental Figure 4E).
As hematopoietic differentiation progresses, RNA editing might regulate lineage commitment at branch points. Therefore, we summarized the alterations in dynamic editing frequencies at every branch point of differentiation to characterize the relationship between RNA editing and hematopoietic lineage commitment. RNA editing frequency was substantially altered at the lineage commitment point. For example, when CMP cells differentiated into MEP cells, the editing frequencies of 715 editing sites (mapping to 422 genes) increased, but the editing frequencies of 358 editing sites (mapping to 250 genes) decreased. Thus, RNA editing may contribute to cell fate decisions (Figure 2E). Specifically, RNA editing on Pfas messenger RNA (mRNA) increased when CMP cells differentiated to MEP cells but remained stable at other branch points, suggesting a specific role in MEP commitment. Changes in editing frequency also occurred in Casp8, Cdk12, Mbd4, Cdk7, Bmpr2, Oip5, Adar1, Tet3, and Dnmt1 across the hematopoietic hierarchy tree (Figure 2F; supplemental Figure 4F). Taken together, these results suggest that RNA editing may participate in hematopoietic differentiation.
RNA editing may regulate gene expression and protein function during hematopoiesis
RNA editing sites within 3' UTRs may participate in the regulation of gene expression.29 We initially focused on the editing sites within 3' UTRs in c-Kit+ cells, where editing frequencies in the control were at least 0.1 higher than those in Adar1 knockout c-Kit+ cells (Figure 3A). We assigned these sites to 285 genes and analyzed gene expression changes. Among these genes, RNA editing was positively correlated with the expression of 44 genes and negatively correlated with the expression of 14 genes (Figure 3B).
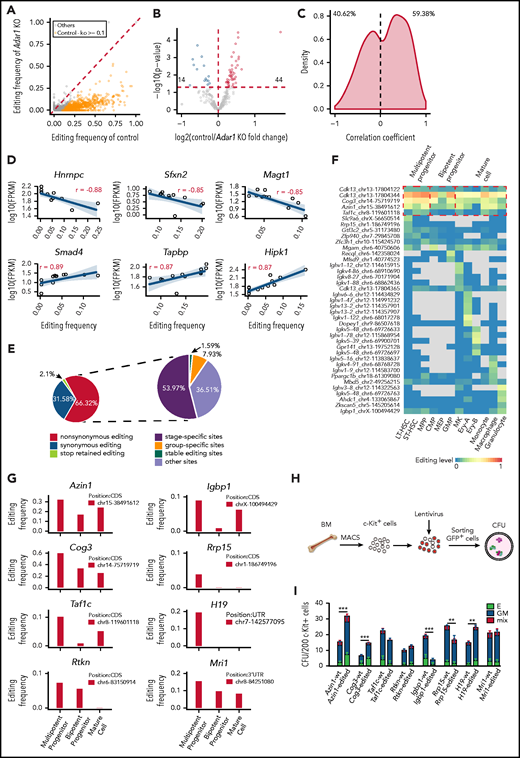
Functional implications of specific RNA editing. (A) Scatter plot showing the frequency of editing sites within 3' UTRs between control and Adar1 knockout (KO) in c-Kit+ cells. (B) A volcano plot showing that expression of selected genes with 3' UTR editing frequencies in control group were greater than that in Adar1 KO group by at least 0.1. Genes with significantly increased or decreased expression in the control group compared with the Adar1 KO group are indicated with red and blue dots, respectively. P < .05 indicates a statistically significant difference. (C) Spearman correlation coefficients between the frequencies of stage-specific editing events within 3' UTRs and mRNA expression levels. (D) Representative examples of the Spearman correlation analysis between the frequencies of editing sites within 3' UTRs and mRNA expression levels. (E) The proportion of the nonsynonymous shift in coding region affected by editing sites (left) and the proportion of types of RNA editing events that cause nonsynonymous shifts in the CDS region. (F) A heat map showing group-specific/stage-specific editing events that cause nonsynonymous shift in the CDS region. (G) The editing frequency of 8 candidate genes among 3 hematopoietic groups. (H) The CFU experimental procedure. Lentivirus containing individual candidate genes expressing the WT transcript or the corresponding edited transcript was transduced into c-Kit+ cells. The transduced c-Kit+ BM cells were then sorted for CFU assays. (I) Colony formation of c-Kit+ BM cells after transduction with the indicated lentivirus expressing the WT or edited gene (referring to Figurepanel G). The number of colonies in the different groups were counted after 7 days of incubation, including E (BFU-E), GM (CFU-GM, CFU-G, CFU-M), and mix (CFU-GEMM) (n = 6 per group, 2 independent experiments, Error bars represent SD). **P < .01; ***P < .001.
Functional implications of specific RNA editing. (A) Scatter plot showing the frequency of editing sites within 3' UTRs between control and Adar1 knockout (KO) in c-Kit+ cells. (B) A volcano plot showing that expression of selected genes with 3' UTR editing frequencies in control group were greater than that in Adar1 KO group by at least 0.1. Genes with significantly increased or decreased expression in the control group compared with the Adar1 KO group are indicated with red and blue dots, respectively. P < .05 indicates a statistically significant difference. (C) Spearman correlation coefficients between the frequencies of stage-specific editing events within 3' UTRs and mRNA expression levels. (D) Representative examples of the Spearman correlation analysis between the frequencies of editing sites within 3' UTRs and mRNA expression levels. (E) The proportion of the nonsynonymous shift in coding region affected by editing sites (left) and the proportion of types of RNA editing events that cause nonsynonymous shifts in the CDS region. (F) A heat map showing group-specific/stage-specific editing events that cause nonsynonymous shift in the CDS region. (G) The editing frequency of 8 candidate genes among 3 hematopoietic groups. (H) The CFU experimental procedure. Lentivirus containing individual candidate genes expressing the WT transcript or the corresponding edited transcript was transduced into c-Kit+ cells. The transduced c-Kit+ BM cells were then sorted for CFU assays. (I) Colony formation of c-Kit+ BM cells after transduction with the indicated lentivirus expressing the WT or edited gene (referring to Figurepanel G). The number of colonies in the different groups were counted after 7 days of incubation, including E (BFU-E), GM (CFU-GM, CFU-G, CFU-M), and mix (CFU-GEMM) (n = 6 per group, 2 independent experiments, Error bars represent SD). **P < .01; ***P < .001.
We also selected editing sites within 3' UTRs in the 12 hematopoietic populations and calculated correlations between RNA editing frequency and mRNA expression. The distribution of the correlation coefficients was either negative (40.62%) or positive (59.38%), suggesting that editing sites within 3' UTRs might regulate mRNA expression levels (Figure 3C). For example, editing events within the Hnrnpc, Sfxn2, and Magt1 3' UTRs were negatively correlated with mRNA expression levels, whereas editing events within Smad4, Tapbp, and Hipk1 3' UTRs were positively correlated with mRNA expression levels (Figure 3D). In addition, RNA editing also altered microRNA binding to target mRNAs (supplemental Figure 4G), although the difference was not significant.
RNA editing in coding regions can cause nonsynonymous shifts.30 In total, 63 editing sites located in CDS regions resulted in nonsynonymous shifts (Figure 3E; supplemental Table 6). Of these sites, 53.97% were stage-specific editing sites and 7.93% were group-specific editing sites (Figure 3E). Of the affected genes, Cdk1322 and Igbp131 regulate hematopoiesis, but nonsynonymous shift in their CDS as a result of RNA editing has not been previously reported (Figure 3F).
RNA editing of Azin1 is important for HSPC function in vitro
Next, we identified 8 genes that were specifically edited in MPP cells and carried only 1 editing site for functional evaluation: Azin1, Cog3, Taf1c, Rtkn, Igbp1, Rrp15, H19, and Mri1 (Figure 3G). RNA editing caused an amino acid substitution in Azin1, Cog3, Taf1c, Rtkn, Igbp1, and Rrp15, whereas the editing events in H19 and Mri1 occurred in noncoding regions. We constructed lentiviral expression vectors containing full-length complementary DNAs encoding WT (vector A) or the RNA-edited transcript for each of these 8 genes (supplemental Figure 5A-B). We then transduced c-Kit+ BM cells with the lentivirus, sorted the infected cells, and performed a CFU assay (Figure 3H). Overexpression of 5 of 8 edited genes (Azin1, Cog3, Igbp1, Rrp15, and H19) led to differential colony formation efficiencies compared with overexpression of the respective WT transcripts, suggesting that RNA editing affected the function of these genes (Figure 3I). Notably, edited Azin1 resulted in the highest colony number (Figure 3I). In addition, although 158 RNA editing sites within the AZIN1 transcript were identified in human CD34+ HSPCs, only 2 sites were located in the CDS region: 1 caused a synonymous shift in the 366th amino acid, and the other caused a nonsynonymous shift in the 367th amino acid (Ser→Gly) (supplemental Figure 5C). The 2 editing sites located in the CDS region were also identified in mouse hematopoietic cells and were conserved between humans and mice.
Our analyses of Azin1 had been based on a WT vector termed Azin1-A (WT; -AGC- coding serine) and an edited vector termed Azin1-G (fully edited; -GGC- coding glycine). To further validate the role of Azin1 RNA editing in modulating HSPC differentiation, we constructed another vector termed Azin1-TC (non-edited; -UCC- coding serine), which coded the same amino acid as WT but could not be edited. c-Kit+ BM cells were transduced with lentivirus carrying either GFP-tagged Azin1-TC, Azin1-A, or Azin1-G (Figure 4A; supplemental Figure 6A-B). GFP+ cells were sorted 48 hours after transduction, and Azin1 (-TC, -A, or -G) overexpression was confirmed at the mRNA and protein levels (supplemental Figure 6C-D). Compared with WT (Azin1-A), the fully edited Azin1 (Azin1-G)–overexpressing cells generated more colonies, whereas non-edited Azin1 (Azin1-TC) cells exhibited defective colony formation (Figure 4B). In addition, Azin1-A–overexpressing GFP+ cells had colony-forming ability comparable to that of the empty vector control cells (supplemental Figure 6E).
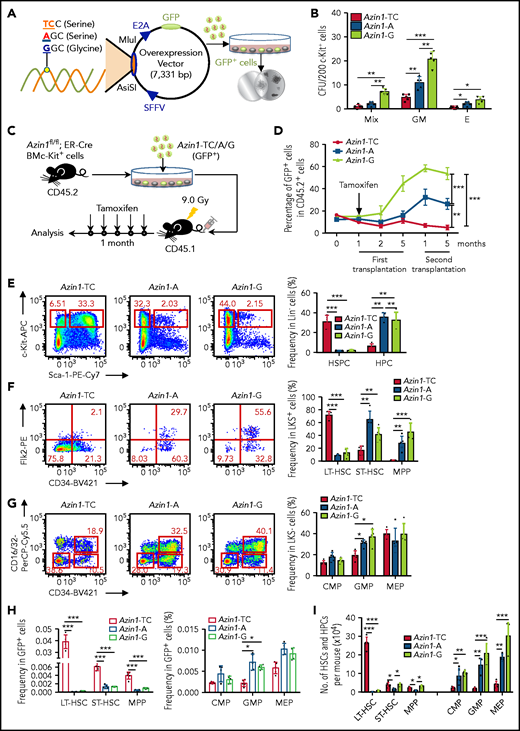
RNA editing of Azin1 sustains the differentiation of HSCs. (A) A schematic of the experimental procedure. Briefly, c-Kit+ cells were transduced with a GFP-tagged WT (A), non-edited (TC) or edited Azin1 (G) overexpression lentivirus. The GFP+ cells were sorted for CFU assay 48 hours after transduction (SFFV and E2A, promoters; AsiSI and MIul, restriction sites). (B) Colony formation of c-Kit+ BM cells after transduction with the indicated lentivirus, The number of colonies in the different groups were counted after 7 days of incubation, including Mix, GM, and E (n = 5 per group, 2 independent experiments; Error bars represent SD). (C) Schematic of the transplantation experimental procedure. Briefly, the c-Kit+ cells were sorted from the BM of Azin1fl/fl;ER-Cre mice (CD45.2+) and transduced with the 3 different overexpression lentivirus vectors. The infection efficiency was assessed by flow cytometry 48 hours after transduction, and 5 × 10⁵ infected c-Kit+ cells were injected into lethally irradiated (9.0 Gy) recipient mice (CD45.1+). One month after transplantation, the recipient mice were treated with tamoxifen (1 mg for 5 days) to induce deletion of endogenous Azin1. Then, the reconstitution of donor cells in the peripheral blood was monitored for another 4 months. (D) The relative percentage of GFP+ cells in CD45.2+ cells in the peripheral blood of recipient mice after first and secondary transplantation (n = 6-8 per group; 3 independent experiments; Error bars represent SEM from 3 replicates). (E-G) Flow cytometry analysis of BM cells from recipient mice 5 months after first transplantation. Flow plots and histograms display the frequencies of HSPCs and HPCs in lineage– cells (E), stem cell subpopulations (LT-HSC, ST-HSC, and MPP cells) in LSK+ cells (F), and progenitor subpopulations (CMP, GMP, and MEP) in LSK– cells (G) (n = 5-6 per group; 2 independent experiments; Error bars represent SD). (H) The frequencies of stem and progenitor cells in GFP+ cells of recipient mice, 5 months after first transplantation (n = 5-6 per group; 2 independent experiments; Error bars represent SD). (I) Stem and progenitor BM cell counts, 5 months after first transplantation (n = 5-6 per group; 2 independent experiments; Error bars represent SD). *P < .05; **P < .01; ***P < .001.
RNA editing of Azin1 sustains the differentiation of HSCs. (A) A schematic of the experimental procedure. Briefly, c-Kit+ cells were transduced with a GFP-tagged WT (A), non-edited (TC) or edited Azin1 (G) overexpression lentivirus. The GFP+ cells were sorted for CFU assay 48 hours after transduction (SFFV and E2A, promoters; AsiSI and MIul, restriction sites). (B) Colony formation of c-Kit+ BM cells after transduction with the indicated lentivirus, The number of colonies in the different groups were counted after 7 days of incubation, including Mix, GM, and E (n = 5 per group, 2 independent experiments; Error bars represent SD). (C) Schematic of the transplantation experimental procedure. Briefly, the c-Kit+ cells were sorted from the BM of Azin1fl/fl;ER-Cre mice (CD45.2+) and transduced with the 3 different overexpression lentivirus vectors. The infection efficiency was assessed by flow cytometry 48 hours after transduction, and 5 × 10⁵ infected c-Kit+ cells were injected into lethally irradiated (9.0 Gy) recipient mice (CD45.1+). One month after transplantation, the recipient mice were treated with tamoxifen (1 mg for 5 days) to induce deletion of endogenous Azin1. Then, the reconstitution of donor cells in the peripheral blood was monitored for another 4 months. (D) The relative percentage of GFP+ cells in CD45.2+ cells in the peripheral blood of recipient mice after first and secondary transplantation (n = 6-8 per group; 3 independent experiments; Error bars represent SEM from 3 replicates). (E-G) Flow cytometry analysis of BM cells from recipient mice 5 months after first transplantation. Flow plots and histograms display the frequencies of HSPCs and HPCs in lineage– cells (E), stem cell subpopulations (LT-HSC, ST-HSC, and MPP cells) in LSK+ cells (F), and progenitor subpopulations (CMP, GMP, and MEP) in LSK– cells (G) (n = 5-6 per group; 2 independent experiments; Error bars represent SD). (H) The frequencies of stem and progenitor cells in GFP+ cells of recipient mice, 5 months after first transplantation (n = 5-6 per group; 2 independent experiments; Error bars represent SD). (I) Stem and progenitor BM cell counts, 5 months after first transplantation (n = 5-6 per group; 2 independent experiments; Error bars represent SD). *P < .05; **P < .01; ***P < .001.
Loss of Azin1 RNA editing blocks HSC differentiation in vivo
To investigate the impact of RNA editing of Azin1 on HSCs, c-Kit+ cells were sorted from the BM of Azin1fl/fl; ER-Cre mice (CD45.2+) and transduced with a lentivirus carrying GFP-tagged Azin1-TC, Azin1-A, or Azin1-G. After transduction for 48 hours, we assessed their infection efficiency using flow cytometry and injected 5 × 10⁵ infected c-Kit+ cells into lethally irradiated recipient mice (CD45.1+). One month after transplantation, recipient mice were treated with tamoxifen to induce deletion of endogenous Azin1 (Figure 4C), and the reconstitution of donor cells in the peripheral blood was monitored for 4 months. The reconstitution proportion of CD45.2+ cells was >90%. Overexpression of fully edited Azin1 (Azin1-G) significantly improved the repopulation capacity of c-Kit+ cells, whereas overexpression of nonedited Azin1 (Azin1-TC) slightly decreased this capacity compared with overexpression of WT Azin1 (Figure 4D; supplemental Figure 6F). Furthermore, in the lethally irradiated secondary recipients (CD45.1+), edited Azin1 improved the self-renewal of HSCs (Figure 4D; supplemental Figure 6F), and there was no significant difference in the frequency of apoptosis between differentially edited groups (supplemental Figure 7A). The homing capacity of transduced cells was comparable in differentially edited groups (supplemental Figure 7B). These data suggest that only edited Azin1 enhances HSC function, and the loss of Azin1 RNA editing impairs HSC reconstitution in vivo.
We also examined the hierarchical components of HSPCs in the BM of the recipients 5 months after initial transplantation. Overexpression of WT and fully edited Azin1 sustained normal HSPC differentiation (Figure 4E-I), whereas overexpression of nonedited Azin1 blocked HSC differentiation. Compared with the WT and fully edited groups, the frequency of LSK+ HSPCs in the nonedited group increased 15-fold, and the frequency of LSK– HPCs decreased fivefold to sevenfold (Figure 4E). In the LSK+ population, the frequency of LT-HSCs in the nonedited group increased eightfold to ninefold, the frequency of ST-HSCs decreased twofold to threefold, and the frequency of MPP cells decreased 15-fold to 25-fold compared with that in the WT and fully edited groups (Figure 4F). In LSK– populations, the frequency of GMP cells decreased by twofold to threefold in the nonedited group compared with that in WT group (Figure 4G). In the GFP+ cell population, the frequencies of LT-HSCs, ST-HSCs, and MPP cells significantly increased in the nonedited group compared with those in the WT and edited groups (Figure 4H). Intriguingly, we detected an almost 30-fold increase in the absolute number of LT-HSCs in the nonedited group, but HPC subpopulation numbers were dramatically reduced (Figure 4I). However, differentially edited Azin1 had little effect on the percentage of mature cells (supplemental Figure 7C). These data suggest a crucial role for Azin1 RNA editing in mediating the choice between HSC differentiation and proliferation.
Edited AZI protein has a high binding affinity for DDX1 in the nucleus
Next, we examined the subcellular localization of edited AZI (Azin1 protein) in murine 32D cells. Consistent with a previous study,32 edited AZI protein (AZI-G) was predominantly localized in the nucleus, but most of the nonedited protein (AZI-TC) was accumulated in the cytoplasm (Figure 5A). Because changes in protein subcellular localization can affect protein interactions, we used immunoprecipitation (IP) and mass spectrometry to identify the differentially interacting proteins between edited and nonedited AZI (Figure 5B; supplemental Figure 8A; supplemental Table 7). A total of 100 proteins specifically bound to edited AZI, and 14 proteins bound to nonedited AZI (Figure 5C; supplemental Figure 8B-C). Among the top 10 specific interacting proteins in the edited group (Figure 5D), we selected DDX1 for further analysis because this protein is known to activate gene transcription in the nucleus.33,34 More DDX1 protein interacted with edited AZI when IP of AZI was performed (Figure 5E-F). Consistently, when DDX1 was immunoprecipitated, more edited AZI (AZI-G) was enriched (supplemental Figure 8D-E). This indicated clear interaction between DDX1 and AZI in 32D cells, and the proximity signal was much stronger in the presence of edited than in nonedited AZI (Figure 5G). Proximity ligation assays confirmed that proximity between AZI and DDX1 was more likely in the nucleus in the edited AZI group but was more likely in the cytoplasm in the nonedited AZI group (Figure 5H-I). Furthermore, IP using nuclear and cytoplasmic proteins revealed that more DDX1 protein interacted with the edited AZI in the nucleus than with the nonedited AZI (Figure 5J, upper panel; supplemental Figure 8F). However, in the cytoplasm, the interaction between DDX1 protein and AZI was weak, regardless of whether AZI was edited or not, with the bands visible only after a long exposure period (Figure 5J, lower panel). Similar results were obtained when DDX1 IP was performed (supplemental Figure 8G). These findings suggest that edited AZI has a higher binding affinity with DDX1 in the nucleus compared with the nonedited AZI.
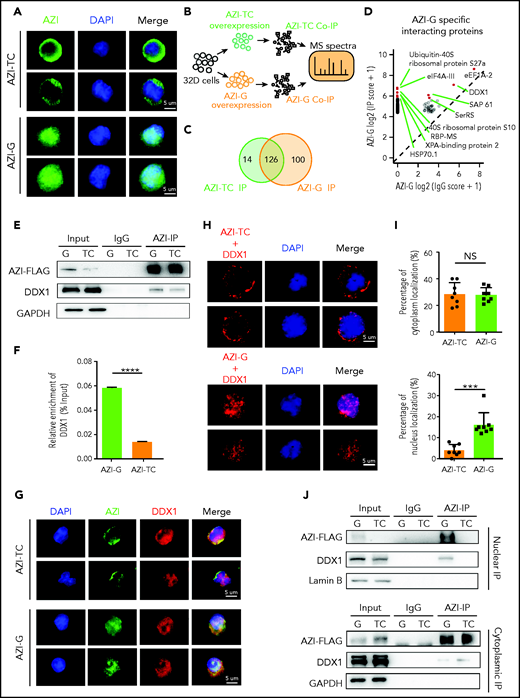
Edited AZI has a high binding affinity with DDX1 in the nucleus. (A) Immunofluorescence of FLAG-tagged AZI-TC or AZI-G proteins in 32D cells. Nonedited AZI protein (AZI-TC) was accumulated in the cytoplasm, whereas edited AZI protein (AZI-G) was predominantly localized in the nucleus. (B) Schematic of experimental procedure. Briefly, 32D cells were transduced with nonedited (AZI-TC) or edited (AZI-G) overexpression lentivirus vectors. The transduced cells were then sorted for IP and mass spectrometry (MS). (C) IP of AZI from 32D cells transduced with nonedited (AZI-TC) or edited (AZI-G) lentivirus vectors. (D) The differential AZI interacting proteins identified by mass spectrometry in 32D cells transduced with the nonedited (AZI-TC) or edited (AZI-G) constructs. (E) Western blot analysis of AZI-FLAG co-immunoprecipitated (Co-IP). (F) The relative enrichment of DDX1 (referring to Figurepanel E) normalized to IP efficiency. (G) Proximity of AZI and DDX1, determined by immunofluorescence. (H) Proximity of AZI and DDX1, determined by proximity ligation assay. (I) The ratio of cytoplasmic and nuclear subcellular localization of AZI (edited and nonedited) with DDX1. (J) The binding affinities between AZI (edited and nonedited) and DDX1 in the nucleus and cytoplasm, as determined by western blot analysis after AZI-FLAG IP. ***P < .001; ****P < .0001; Error bars represent SD. DAPI, 4′,6-diamidino-2-phenylindole; GAPDH, glyceraldehyde-3-phosphate dehydrogenase; NS, not significant.
Edited AZI has a high binding affinity with DDX1 in the nucleus. (A) Immunofluorescence of FLAG-tagged AZI-TC or AZI-G proteins in 32D cells. Nonedited AZI protein (AZI-TC) was accumulated in the cytoplasm, whereas edited AZI protein (AZI-G) was predominantly localized in the nucleus. (B) Schematic of experimental procedure. Briefly, 32D cells were transduced with nonedited (AZI-TC) or edited (AZI-G) overexpression lentivirus vectors. The transduced cells were then sorted for IP and mass spectrometry (MS). (C) IP of AZI from 32D cells transduced with nonedited (AZI-TC) or edited (AZI-G) lentivirus vectors. (D) The differential AZI interacting proteins identified by mass spectrometry in 32D cells transduced with the nonedited (AZI-TC) or edited (AZI-G) constructs. (E) Western blot analysis of AZI-FLAG co-immunoprecipitated (Co-IP). (F) The relative enrichment of DDX1 (referring to Figurepanel E) normalized to IP efficiency. (G) Proximity of AZI and DDX1, determined by immunofluorescence. (H) Proximity of AZI and DDX1, determined by proximity ligation assay. (I) The ratio of cytoplasmic and nuclear subcellular localization of AZI (edited and nonedited) with DDX1. (J) The binding affinities between AZI (edited and nonedited) and DDX1 in the nucleus and cytoplasm, as determined by western blot analysis after AZI-FLAG IP. ***P < .001; ****P < .0001; Error bars represent SD. DAPI, 4′,6-diamidino-2-phenylindole; GAPDH, glyceraldehyde-3-phosphate dehydrogenase; NS, not significant.
Edited Azin1 cooperates with Ddx1 to regulate hematopoiesis
Although Ddx1 has been implicated in multiple cellular processes,33-35 its role in hematopoiesis is unknown. To investigate this, we performed knockdown assays (supplemental Figure 9A). Ddx1 depletion inhibited the colony-forming ability of c-Kit+ cells (Figure 6A; supplemental Figure 9B) and increased the apoptotic ratio (Figure 6B; supplemental Figure 9C), indicating that Ddx1 depletion impairs HSPC function in vitro.
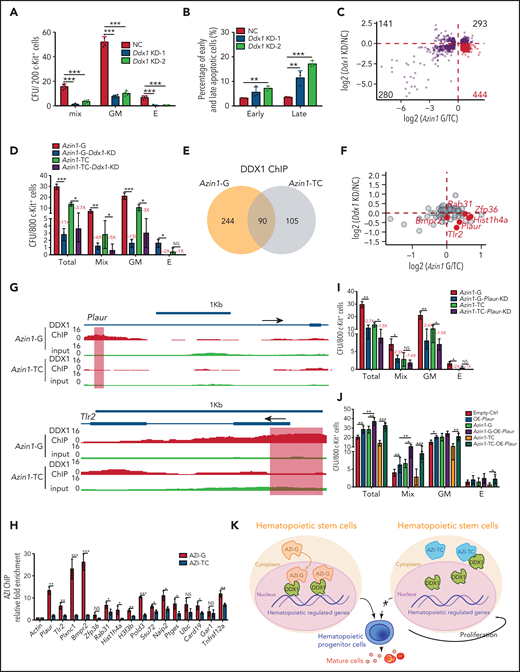
Edited Azin1 cooperates with Ddx1 to regulate hematopoiesis. (A) Colony formation of c-Kit+ BM cells after transduction with Ddx1 knockdown (KD) vectors. Colonies were counted in the different groups after 7 days of incubation, including the mix, GM, and E groups (n = 5 per group; 3 independent experiments; Error bars represent SD; NC, negative control). (B) The percentage of early and late apoptotic c-Kit+ BM cells after transduction with Ddx1 knockdown vectors (n = 3 per group; 3 independent experiments; Error bars represent SEM from 3 replicates). (C) The co-varying genes in the context of Ddx1 knockdown and edited Azin1 overexpression. The most prevalent 444 genes that decreased with Ddx1 knockdown but increased with Azin1-G overexpression are indicated in red. (D) Colony-forming ability of transduced cells. Colonies in the different groups were counted after 7 days of incubation. C omparison between the Azin1-G and Azin1-TC groups is shown in Figure 4B (n = 5 per group; two independent experiments; Error bars represent SD). (E) The change in genomic distribution of DDX1 after nonedited (Azin1-TC) or edited (Azin1-G) overexpression. (F) The expression of hematopoietic-related genes bound by DDX1 selectively in the edited Azin1 group. (G) The extent of DDX1 binding on Plaur and Tlr2 in the edited (Azin1-G) vs the nonedited (Azin1-TC) group. (H) AZI ChIP-quantitative polymerase chain reaction on the target gene loci in Azin1-G/Azin1-TC–overexpressing cells (n = 3 per group; 2 independent experiments; Error bars represent SD). (I) Colony forming ability of transduced cells. c-Kit+ BM cells were transduced with GFP-tagged edited (Azin1-G) or nonedited (Azin1-TC) overexpression lentiviruses; 48 hours after transduction, GFP+ cells were sorted and transduced with mCherry-tagged Plaur knockdown lentivirus. GFP+ mCherry+ cells were sorted for CFU assay 48 hours after transduction with Plaur knockdown lentivirus. Depletion of Plaur had a stronger effect on edited Azin1 (Azin1-G) than unedited Azin1 (Azin1-TC) cells (2.7-fold vs 1.5-fold decrease) (n = 5 per group; 2 independent experiments; Error bars represent SD). (J) Colony-forming ability of transduced cells. FigureCompared with the Empty-Ctrl, the Plaur-overexpressing cells generated more colonies. Overexpression of Plaur in the fully edited Azin1 (Azin1-G) and nonedited Azin1 (Azin1-TC) cells increased their colony-forming abilities. Overexpression of Plaur rescued the colony-forming abilities of nonedited Azin1 c-Kit+ cells, making these comparable to the edited group (n = 5 per group; 3 independent experiments; Error bars represent SD). (K) Schematic showing how AZI might interact with DDX1 to regulate hematopoiesis. Edited AZI is translocated from the cytoplasm to the nucleus where it interacts with DDX1 with high affinity to increase DDX1 binding on hematopoietic-regulated genes. DDX1 then activates target gene expression and sustains normal HSC differentiation. However, nonedited AZI preferentially localizes to the cytoplasm, forcing HSCs to proliferate and leading to failed HSC reconstitution in recipients. *P < .05; **P < .01; ***P < .001.
Edited Azin1 cooperates with Ddx1 to regulate hematopoiesis. (A) Colony formation of c-Kit+ BM cells after transduction with Ddx1 knockdown (KD) vectors. Colonies were counted in the different groups after 7 days of incubation, including the mix, GM, and E groups (n = 5 per group; 3 independent experiments; Error bars represent SD; NC, negative control). (B) The percentage of early and late apoptotic c-Kit+ BM cells after transduction with Ddx1 knockdown vectors (n = 3 per group; 3 independent experiments; Error bars represent SEM from 3 replicates). (C) The co-varying genes in the context of Ddx1 knockdown and edited Azin1 overexpression. The most prevalent 444 genes that decreased with Ddx1 knockdown but increased with Azin1-G overexpression are indicated in red. (D) Colony-forming ability of transduced cells. Colonies in the different groups were counted after 7 days of incubation. C omparison between the Azin1-G and Azin1-TC groups is shown in Figure 4B (n = 5 per group; two independent experiments; Error bars represent SD). (E) The change in genomic distribution of DDX1 after nonedited (Azin1-TC) or edited (Azin1-G) overexpression. (F) The expression of hematopoietic-related genes bound by DDX1 selectively in the edited Azin1 group. (G) The extent of DDX1 binding on Plaur and Tlr2 in the edited (Azin1-G) vs the nonedited (Azin1-TC) group. (H) AZI ChIP-quantitative polymerase chain reaction on the target gene loci in Azin1-G/Azin1-TC–overexpressing cells (n = 3 per group; 2 independent experiments; Error bars represent SD). (I) Colony forming ability of transduced cells. c-Kit+ BM cells were transduced with GFP-tagged edited (Azin1-G) or nonedited (Azin1-TC) overexpression lentiviruses; 48 hours after transduction, GFP+ cells were sorted and transduced with mCherry-tagged Plaur knockdown lentivirus. GFP+ mCherry+ cells were sorted for CFU assay 48 hours after transduction with Plaur knockdown lentivirus. Depletion of Plaur had a stronger effect on edited Azin1 (Azin1-G) than unedited Azin1 (Azin1-TC) cells (2.7-fold vs 1.5-fold decrease) (n = 5 per group; 2 independent experiments; Error bars represent SD). (J) Colony-forming ability of transduced cells. FigureCompared with the Empty-Ctrl, the Plaur-overexpressing cells generated more colonies. Overexpression of Plaur in the fully edited Azin1 (Azin1-G) and nonedited Azin1 (Azin1-TC) cells increased their colony-forming abilities. Overexpression of Plaur rescued the colony-forming abilities of nonedited Azin1 c-Kit+ cells, making these comparable to the edited group (n = 5 per group; 3 independent experiments; Error bars represent SD). (K) Schematic showing how AZI might interact with DDX1 to regulate hematopoiesis. Edited AZI is translocated from the cytoplasm to the nucleus where it interacts with DDX1 with high affinity to increase DDX1 binding on hematopoietic-regulated genes. DDX1 then activates target gene expression and sustains normal HSC differentiation. However, nonedited AZI preferentially localizes to the cytoplasm, forcing HSCs to proliferate and leading to failed HSC reconstitution in recipients. *P < .05; **P < .01; ***P < .001.
To understand how the interaction between edited Azin1 and Ddx1 regulates hematopoiesis, we performed RNA-seq of c-Kit+ cells when Ddx1 was knocked down and when differentially edited Azin1 (Azin1-TC or Azin1-G) was overexpressed. The expression levels of 444 genes (>25% of 1158) were decreased upon Ddx1 knockdown but were increased upon edited Azin1 (Azin1-G) overexpression, suggesting a synergistic effect of Ddx1 and Azin1-G on these genes during hematopoiesis (Figure 6C; supplemental Figure 9D; supplemental Table 8). Gene Ontology (GO) enrichment analysis showed that these 444 genes were involved in processes relevant to hematopoiesis, including cytokine production, hematopoiesis regulation, and myeloid differentiation (supplemental Figure 9E). To functionally illustrate the involvement of the Azin1-Ddx1 interaction in the regulation of hematopoiesis, we inhibited Ddx1 expression in edited or nonedited Azin1 (Azin1-G or Azin1-TC) overexpressed c-Kit+ BM cells (supplemental Figure 9F). Ddx1 knockdown significantly reduced colony numbers in both Azin1-G and Azin1-TC overexpressing cells. However, the effect of Ddx1 knockdown on colony numbers was greater in the Azin1-G group compared with the Azin1-TC group (11-fold vs 3.7-fold decrease), indicating the selective Ddx1 dependency of edited Azin1 (Figure 6D). Ddx1 overexpression partially rescued colony formation in nonedited Azin1 c-Kit+ cells (supplemental Figure 9G).
Because DDX1 activates gene transcription by binding DNA,33 we performed DDX1 ChIP sequencing in 32D cells transfected with nonedited or edited Azin1 and found that the genomic distribution of DDX1 was significantly altered between these groups. Specifically, DDX1 was enriched in 244 chromatin regions in the edited Azin1 group compared with the nonedited group, whereas 105 regions were depleted (Figure 6E). Of the 244 chromatin binding regions enriched in the edited Azin1 group, the majority were located in the promoter transcription start sites (40.57%) and intergenic regions (31.56%). However, the 105 depleted chromatin binding regions were primarily located in the intron (36.19%) and intergenic regions (30.48%; supplemental Figure 9H; supplemental Table 8). The enrichment of DDX1 in promoter-transcription start site regions after AZI-G overexpression suggested that the AZI-DDX1 interaction was involved in transcriptional regulation in hematopoietic cells. We also assessed the effects of disturbing Ddx1 or Azin1 (Azin1-G) expression on DDX1-binding target genes (Figure 6F). Genes associated with hematopoiesis, including Plaur,36,Zfp36,37,38Tlr2,39-41 Rab31, and Hist1h4a, were downregulated in Ddx1 knockdown c-Kit+ cells and upregulated in edited Azin1 (Azin1-G) overexpressing cells (Figure 6F; supplemental Table 8); increased DDX1 binding on these genes in edited Azin1 cells was observed (Figure 6G; supplemental Figure 10A). To investigate whether DDX1 interacted with AZI at the genomic regions of these target genes, we performed AZI ChIP in cells transfected with nonedited or edited Azin1 and examined the enrichment of DDX1 binding regions in these target genes (Figure 6H). AZI enriched the DDX1-binding regions on these genes, and enrichment in the edited AZI group was higher compared with the nonedited AZI group for 81.3% of the genes, which indicates that it was edited AZI that mediated the DDX1 interaction at these regulatory regions (Figure 6H; supplemental Table 4). Of the 13 genes bound by edited AZI and DDX1 simultaneously, we identified Plaur, Tlr2, and Plxnc1 as important functional genes in HSPC differentiation (Figure 6I-J; supplemental Figure 10B-C). These results indicate that edited AZI cooperates with DDX1 to control hematopoietic differentiation by regulating the expression of several hematopoietic regulators.
Discussion
In this study, we outlined the landscape of the RNA editome in hematopoiesis and revealed the previously unknown role of RNA editing in mediating HSPC function. We identified 3 patterns of RNA editing —stage-specific, group-specific, and stable RNA editing—and found that multiple well-known hematopoietic regulators were dynamically edited. Previous studies have shown that Adar1 and A-to-I editing is required by HSPCs, erythroid cells, and early T cells.9,12,16,42,43 Mechanistically, Adar1-mediated RNA editing is thought to prevent innate immune system activation by cytosolic double-stranded RNA via Ifih1.9,10 Deletion of the innate immune receptor Ifih1 or Mavs in mice with RNA editing-deficient Adar1 enzymes rescues embryonic viability10,44; however, hematopoietic progenitor populations remain abnormal compared with WT mice.45 In addition, these mice were underweight, exhibited high interferon-stimulated gene activation, and lacked a stress response. These findings suggest that the lethality observed in Adar1−/− mice is mainly a result of innate immune system activation by nonedited endogenous double-stranded RNAs. However, other targets edited by ADAR1 may also be important for hematopoietic homeostasis. We systematically identified RNA editing sites across hematopoietic cell populations, producing a resource for comprehensively investigating A-to-I editing in different hematopoietic lineages. Through in vitro colony-formation assays, we identified several RNA editing events related to HSPC function, including Azin1 RNA editing. In follow-up investigations, we found that edited Azin1 maintained the normal differentiation process of HSCs, whereas loss of Azin1 RNA editing forced HSCs to proliferate rather than differentiate. This resulted in failed BM reconstitution.
Accumulating data suggest that A-to-I editing of Azin1 is involved in tumor development, and the underlying mechanisms have predominantly been explored in hepatocellular carcinoma. In hepatocellular carcinoma, edited AZI neutralizes antizyme-mediated degradation of ornithine decarboxylase and cyclin D1 (CCND1) through its stronger binding activity with OAZ1 compared with WT AZI.32 However, this mechanism does not apply to normal hematopoiesis in our study. Our AZI interactome in hematopoietic cells demonstrated that AZI interacts with numerous proteins with greater affinity than this interaction with OAZ1. Indeed, we found that edited AZI selectively interacts with DDX1 in the nucleus to regulate DDX1-mediated transcription, providing the first characterization of the differential roles of cytoplasmic vs nuclear AZI. Moreover, our constructed AZI interactome in hematopoiesis provides useful clues for uncovering its role throughout this process.
In conclusion, we have provided the first comprehensive delineation of the RNA editome in the hematopoietic cascade. We show that a novel regulator, Azin1, mediates the differentiation of HSPCs, likely via its interaction with DDX1. Edited AZI translocates from the cytoplasm to the nucleus, enabling its interaction with DDX1, and this binding enables DDX1 to regulate the expression of several hematopoietic regulators, such as Plaur. This sustains normal differentiation during hematopoiesis. However, nonedited AZI remains localized in the cytoplasm, forcing HSCs to undergo proliferation without differentiation and thus reconstitution fails (Figure 6K). Our results will facilitate further studies into RNA editing in hematopoietic cells under physiological and pathophysiological conditions.
Acknowledgments
The authors thank the laboratory members for their assistance with the experiments.
This work was supported by grants from the Ministry of Science and Technology of China (2016YFA0100600, 2017YFA0103400, and 2020YFE0203000), the National Natural Science Foundation of China (81421002, 81922002, 81890990, 81730006, 81861148029, 81870086, 81670106, 81530007, 31725013, 31771444, and 81970101), the Chinese Academy of Medical Sciences (CAMS) Initiative for Innovative Medicine (2017-I2M-3-009, 2016-I2M-1-017, 2017-I2M-1-015, and 2019-I2M-2-001), the CAMS Fundamental Research Funds for Central Research Institutes (2019RC310003), the State Key Laboratory of Experimental Hematology Pilot Research Grant (Z20-04), and Distinguished Young Scholars of Tianjin (19JCJQJC63400).
Authorship
Contribution: F.W. designed and performed the experiments, analyzed the data, and wrote the article; J.H. performed bioinformatics analyses and wrote the article with help from W.D., C.-Y.L., and P.Z.; S.L. performed IP and ChIP assays with help from F.W., X.W., and M.H.; A.G. and S.H. performed the mouse experiments and flow cytometry; L.Y., G.S., X.Z., and F.G. helped with overexpression and short hairpin RNA knockdown experiments; and Y.M., H.C., J.Y., and T.C. proposed the study, designed the experiments, interpreted the results, wrote the article, and oversaw the research project.
Conflict-of-interest disclosure: The authors declare no competing financial interests.
Correspondence: Tao Cheng, Institute of Hematology and Blood Diseases Hospital, Chinese Academy of Medical Sciences and Peking Union Medical College, 288 Nanjing Rd, Heping District, Tianjin 300020, China; e-mail: chengtao@ihcams.ac.cn; Jia Yu, Institute of Basic Medical Sciences, School of Basic Medicine, Chinese Academy of Medical Sciences and Peking Union Medical College, No. 5 Dong Dan San Tiao, Dongcheng District, Beijing, China; e-mail: j-yu@ibms.pumc.edu.cn; Hui Cheng, Institute of Hematology and Blood Diseases Hospital, Chinese Academy of Medical Sciences and Peking Union Medical College, 288 Nanjing Rd, Heping District, Tianjin 300020, China; e-mail: chenghui@ihcams.ac.cn; and Yanni Ma, Institute of Basic Medical Sciences, School of Basic Medicine, Chinese Academy of Medical Sciences and Peking Union Medical College, No. 5 Dong Dan San Tiao, Dongcheng District, Beijing, China. e-mail: yanni_ma@126.com.
Raw sequencing data were deposited in the Gene Expression Omnibus database (accession number GSE142216).
The online version of this article contains a data supplement.
There is a Blood Commentary on this article in this issue.
The publication costs of this article were defrayed in part by page charge payment. Therefore, and solely to indicate this fact, this article is hereby marked “advertisement” in accordance with 18 USC section 1734.

This feature is available to Subscribers Only
Sign In or Create an Account Close Modal