

Key Points
CD63 is involved in EV secretion from cells and is shown herein to be regulated by iron via the IRE-IRP system.
Iron-loading increased secretion of CD63+ EVs containing iron-loaded ferritin.

Abstract
Extracellular vesicles (EVs) transfer functional molecules between cells. CD63 is a widely recognized EV marker that contributes to EV secretion from cells. However, the regulation of its expression remains largely unknown. Ferritin is a cellular iron storage protein that can also be secreted by the exosome pathway, and serum ferritin levels classically reflect body iron stores. Iron metabolism–associated proteins such as ferritin are intricately regulated by cellular iron levels via the iron responsive element-iron regulatory protein (IRE-IRP) system. Herein, we present a novel mechanism demonstrating that the expression of the EV-associated protein CD63 is under the regulation of the IRE-IRP system. We discovered a canonical IRE in the 5′ untranslated region of CD63 messenger RNA that is responsible for regulating its expression in response to increased iron. Cellular iron loading caused a marked increase in CD63 expression and the secretion of CD63+ EVs from cells, which were shown to contain ferritin-H and ferritin-L. Our results demonstrate that under iron loading, intracellular ferritin is transferred via nuclear receptor coactivator 4 (NCOA4) to CD63+ EVs that are then secreted. Such iron-regulated secretion of the major iron storage protein ferritin via CD63+ EVs, is significant for understanding the local cell-to-cell exchange of ferritin and iron.
Introduction
Extracellular vesicles (EVs) are released by cells and are found in most biological fluids.1 EVs can be produced by fusion of endosomal multivesicular bodies within the plasma membrane, which releases intraluminal vesicles in the form of exosomes.2 CD63 and CD81 are tetraspanin superfamily members and are highly expressed in EVs.3 CD63 is localized to intraluminal vesicles of late endosomes and multivesicular bodies and is enriched in EVs.4,5 Intriguingly, CD63 contributes to EV secretion.6 CD63 has also been suggested to play a variety of roles in, for instance, platelet activation and cell signaling,7 as well as after viral infection and may have a role in increasing EV biogenesis.8 Ferritin is the major intracellular iron storage protein9,10 and is also found extracellularly in EVs.11,12
However, mammalian ferritin lacks the signal peptide for endoplasmic reticulum-Golgi secretion in spite of its presence in serum.11 A range of cell types secrete ferritin, including hepatocytes,13 hepatoma cells,14-16 endothelial cells,17 erythroid leukemia cells,18 macrophages,19-22 fibroblasts,23 neuroblastoma cells,24,25 oligodendrocytes,26 and astrocytes.27 Ferritin secretion occurs by poorly defined processes with iron-rich ferritin being released via the multivesicular body-EV (exosome) pathway.12 Serum ferritin reflects body iron stores and is a hematologic index used to monitor iron-associated diseases.28
The mechanism for regulating ferritin secretion by cellular iron remains unknown.12 Considering the regulation of intracellular ferritin by iron, when iron levels increase, ferritin is rapidly induced by halting posttranscriptional inhibition through the iron-responsive element–iron-regulatory protein (IRE-IRP) system.29,30 This avoids free unbound iron, which is toxic.31 The iron regulatory proteins IRP1 and IRP2 bind to IREs (Figure 1A-B) in the 3′ or 5′ untranslated regions (UTRs) of messenger RNAs (mRNAs).32 The IREs form hairpin structures composed of a stem and a loop, with the canonical apical IRE loop sequence consisting of 6 nucleotides (CAG(U/A)GN) (Figure 1A-B).33-35
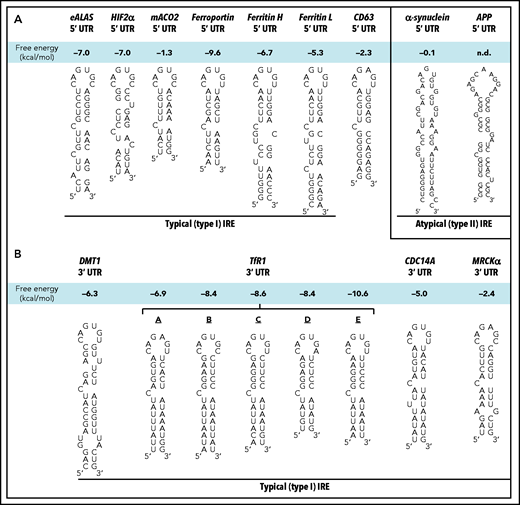
Schematic illustration of the sequences/structures of IREs. (A) Schematic illustration of the structures of typical (type I) IRE stem loops in the 5′ UTRs of the mRNAs of erythroid delta aminolevulinic acid synthase (eALAS), hypoxia inducible factor-2α (HIF-2α), mitochondrial aconitase 2 (mACO2), ferroportin, FTH, FTL, and CD63 relative to the atypical (type II) IREs in the 5′ UTR of α-synuclein and amyloid precursor protein (APP). (B) Schematic illustration of the structures of typical (type I) IRE stem loops in the 3′ UTR regions of the mRNAs of divalent metal ion transporter 1 (DMT1), transferrin receptor 1 (TfR1; 5 TfR1 IREs are denoted: A-E), cell division cycle 14A (CDC14A) and myotonic dystrophy kinase–related CDC42-binding kinase-α (MRCKα). n.d., not determined.
Schematic illustration of the sequences/structures of IREs. (A) Schematic illustration of the structures of typical (type I) IRE stem loops in the 5′ UTRs of the mRNAs of erythroid delta aminolevulinic acid synthase (eALAS), hypoxia inducible factor-2α (HIF-2α), mitochondrial aconitase 2 (mACO2), ferroportin, FTH, FTL, and CD63 relative to the atypical (type II) IREs in the 5′ UTR of α-synuclein and amyloid precursor protein (APP). (B) Schematic illustration of the structures of typical (type I) IRE stem loops in the 3′ UTR regions of the mRNAs of divalent metal ion transporter 1 (DMT1), transferrin receptor 1 (TfR1; 5 TfR1 IREs are denoted: A-E), cell division cycle 14A (CDC14A) and myotonic dystrophy kinase–related CDC42-binding kinase-α (MRCKα). n.d., not determined.
Herein, we demonstrate for the first time that CD63 plays a role in EV secretion6 and is posttranscriptionally regulated by iron via the IRE-IRP system, and excess iron induces CD63 expression. Under iron loading, intracellular ferritin is transferred via nuclear receptor coactivator 4 (NCOA4)/ferritin vesicles to CD63+ EVs that are secreted. Such iron-regulated secretion of ferritin via CD63+ EVs helps us understand how iron metabolism is regulated at the local cell-to-cell level.
Methods
All protocols are described in detail in the supplemental Methods available on the Blood Web site.
Collection of EVs from cellular supernatants
IMR90SV cells were incubated with 0, 5, or 20 µg/mL ferric ammonium citrate (FAC) for 48 hours at 37°C supplemented with 0.5% fetal bovine serum (FBS) depleted of bovine EVs. EVs were collected from cellular supernatants by a well-characterized protocol.36
RNA pulldown
The IRE region of CD63 mRNA (NM_001257389.2 on National Center for Biotechnology Information) was analyzed by using the Search for Iron-Responsive Elements (SIREs) Web Server 2.0 (http://ccbg.imppc.org/sires/).37 The predicted IRE of CD63 5′ UTR RNA (5′-GAGGGGGCUUGCACAGAGUUGGAGCCAGAGG-3′) was synthesized by Eurofins Scientific. The RNA 3′ end was biotinylated using a Pierce RNA 3′ End Biotinylation Kit. Biotinylated RNA was mixed with precleared total protein extracts from IMR90SV cells (recombinant glutathione S-transferase [GST]-IRP1, or GST-IRP2) and magnetic streptavidin R280 beads were then added to the mixture. Samples were analyzed by immunoblotting.
Electrophoretic mobility shift assay (EMSA)
The reactions included 62.5 nM biotinylated RNA and 0.5 µg purified GST-IRP1 or GST-IRP2 with unlabeled RNA competitors. The binding reactions for RNAs and GST-IRP1 or GST-IRP2 were electrophoresed and transferred to a nylon membrane. The biotinylated RNA was detected with streptavidin-horseradish peroxidase (#P0397; Dako, Santa Clara, CA).
Results
CD63 expression is upregulated by iron loading
The EV pathway is involved in ferritin secretion,12 although its regulation by iron levels has not been investigated. Both CD63 and CD81 are key to EV production38 and are important to examine in terms of their regulation by iron. Because ferritin is secreted by a range of cells,13-27 initial studies used fibroblasts, which secrete ferritin in exosomes.23
In these experiments, human IMR90SV fibroblasts were incubated for 16 hours at 37°C in the absence of FBS (hereafter –FBS) with FAC (0, 5, or 20 µg/mL), which increases functional iron pools.14,15,39 CD63 and CD81 expression in cell lysates was then examined by immunoblotting (Figure 2A-B). The levels of CD63 showed significant (P < .001 to P < .05) upregulation upon incubation of cells with increasing FAC concentration compared with the control (Figure 2A-B). The immunoblots revealed that CD63 expression consisted of a laddered banding pattern at ∼30 to 60 kDa, with a major band being identified at ∼40 kDa (Figure 2A). These CD63 bands are the result of differential glycosylation40,41 and were included in the densitometric analysis. Similar to CD63, ferritin-H (FTH) chain was also significantly (P < .0001) upregulated by FAC compared with the control.10,14 In contrast to CD63 and FTH, no significant change in CD81 or the lysosomal marker Lamp2 was observed after incubation with FAC (Figure 2A-B).
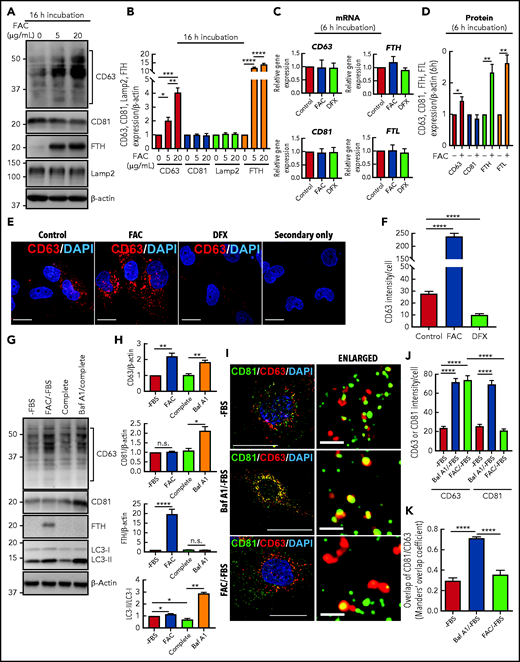
CD63 expression is increased by cellular iron loading and decreased by iron depletion. (A) IMR90SV cells were incubated for 16 hours at 37°C with either control medium or medium containing FAC (5 or 20 µg/mL) without FBS (–FBS). Cells were then lysed in lysis buffer, and 20 µg of protein from each sample was analyzed with anti-CD63, anti-CD81, anti-FTH, anti-Lamp2, and anti–β-actin antibodies using immunoblotting. (B) Quantification of CD63, CD81, and Lamp2 intensity from panel A. (C) IMR90SV cells were incubated with 10 µg/mL FAC or 50 µM DFX for 6 hours at 37°C in media (–FBS). The relative mRNA levels of CD63, CD81, FTH, and FTL were calculated using the 2-ΔΔCq method and normalized to glyceraldehyde-3-phosphate dehydrogenase (GAPDH). (D) IMR90SV cells were incubated with 10 µg/mL FAC for 6 hours at 37°C in media (–FBS). Cells were then lysed in lysis buffer, and 20 µg of each sample was analyzed with anti-CD63, anti-CD81, anti-FTH, anti-FTL, and anti–β-actin antibodies using immunoblotting. (E) IMR90SV cells were incubated with either control medium (–FBS) or medium containing 10 µg/mL FAC or 5 µM DFX for 16 hours at 37°C. Cells were fixed and stained with anti-CD63 antibodies (red) and 4′,6-diamidino-2-phenylindole (DAPI; blue). As a negative control, IMR90SV cells were incubated with 10 µg/mL FAC for 16 hours at 37°C and were treated with secondary antibody without primary antibody. Scale bar, 10 µm. (F) Quantification of CD63 intensity per cell was performed with >60 cells examined per condition from 3 experiments. (G) IMR90SV cells were incubated with medium (–FBS) (control), with 10 µg/mL FAC (–FBS), 10% FBS complete medium (complete), or complete medium containing 2 nM bafilomycin A1 (Baf A1/complete) for 12 hours at 37°C. Then, 20 µg of protein per sample was examined using immunoblotting analysis. (H) Quantification of CD63, CD81, FTH, and LC3-II intensity of entities in panel G. (I) Confocal immunofluorescence microscopy of IMR90SV cells. Cells were cultured with medium (–FBS), medium containing 2 nM Baf A1 (–FBS), or medium containing 10 µg/mL FAC (–FBS) for 12 hours at 37°C. Cells were then fixed and stained with anti-CD81 (green), anti-CD63 (red), and DAPI (blue). Thin scale bar, 10 µm; thick scale bar (for enlarged photos), 2.5 µm. (J) Quantification of CD63 or CD81 intensity per cell. (K) Calculation of the Manders’ overlap coefficient assessing CD63 and CD81 overlap. For panels J and K, data are from examining >60 cells per condition over 3 experiments. Quantification of CD81 and CD63 colocalization was determined via the Manders’ overlap coefficient. All results are mean ± standard error of the mean (SEM) from 3 representative experiments. Significance was determined using the Student t test. *P < .05; **P < .01; ***P < .001; ****P < .0001. n.s., not significant.
CD63 expression is increased by cellular iron loading and decreased by iron depletion. (A) IMR90SV cells were incubated for 16 hours at 37°C with either control medium or medium containing FAC (5 or 20 µg/mL) without FBS (–FBS). Cells were then lysed in lysis buffer, and 20 µg of protein from each sample was analyzed with anti-CD63, anti-CD81, anti-FTH, anti-Lamp2, and anti–β-actin antibodies using immunoblotting. (B) Quantification of CD63, CD81, and Lamp2 intensity from panel A. (C) IMR90SV cells were incubated with 10 µg/mL FAC or 50 µM DFX for 6 hours at 37°C in media (–FBS). The relative mRNA levels of CD63, CD81, FTH, and FTL were calculated using the 2-ΔΔCq method and normalized to glyceraldehyde-3-phosphate dehydrogenase (GAPDH). (D) IMR90SV cells were incubated with 10 µg/mL FAC for 6 hours at 37°C in media (–FBS). Cells were then lysed in lysis buffer, and 20 µg of each sample was analyzed with anti-CD63, anti-CD81, anti-FTH, anti-FTL, and anti–β-actin antibodies using immunoblotting. (E) IMR90SV cells were incubated with either control medium (–FBS) or medium containing 10 µg/mL FAC or 5 µM DFX for 16 hours at 37°C. Cells were fixed and stained with anti-CD63 antibodies (red) and 4′,6-diamidino-2-phenylindole (DAPI; blue). As a negative control, IMR90SV cells were incubated with 10 µg/mL FAC for 16 hours at 37°C and were treated with secondary antibody without primary antibody. Scale bar, 10 µm. (F) Quantification of CD63 intensity per cell was performed with >60 cells examined per condition from 3 experiments. (G) IMR90SV cells were incubated with medium (–FBS) (control), with 10 µg/mL FAC (–FBS), 10% FBS complete medium (complete), or complete medium containing 2 nM bafilomycin A1 (Baf A1/complete) for 12 hours at 37°C. Then, 20 µg of protein per sample was examined using immunoblotting analysis. (H) Quantification of CD63, CD81, FTH, and LC3-II intensity of entities in panel G. (I) Confocal immunofluorescence microscopy of IMR90SV cells. Cells were cultured with medium (–FBS), medium containing 2 nM Baf A1 (–FBS), or medium containing 10 µg/mL FAC (–FBS) for 12 hours at 37°C. Cells were then fixed and stained with anti-CD81 (green), anti-CD63 (red), and DAPI (blue). Thin scale bar, 10 µm; thick scale bar (for enlarged photos), 2.5 µm. (J) Quantification of CD63 or CD81 intensity per cell. (K) Calculation of the Manders’ overlap coefficient assessing CD63 and CD81 overlap. For panels J and K, data are from examining >60 cells per condition over 3 experiments. Quantification of CD81 and CD63 colocalization was determined via the Manders’ overlap coefficient. All results are mean ± standard error of the mean (SEM) from 3 representative experiments. Significance was determined using the Student t test. *P < .05; **P < .01; ***P < .001; ****P < .0001. n.s., not significant.
After a 6-hour incubation with FAC (10 µg/mL) or deferasirox (DFX; 50 µM), CD63, CD81, FTH, or FTL mRNA levels were not changed (Figure 2C), whereas the protein expression of CD63, FTH, and FTL was significantly (P < .01 to P < .05) enhanced by a 6-hour incubation with FAC (10 µg/mL; Figure 2D). These data suggest posttranscriptional regulation, as previously observed for ferritin.42,43
In agreement with the immunoblotting shown in Figure 2A-B, immunostaining of CD63 in IMR90SV cells treated with FAC under the same conditions (16 hours at 37°C [–FBS]) revealed a significant (P < .0001) eightfold increase in CD63 compared with the respective control (Figure 2E-F). In contrast, iron depletion induced by incubation (16 hours [–FBS]) with the well-characterized iron chelator DFX (5 µM)44,45 significantly (P < .0001) decreased CD63 by >50% compared with the control (Figure 2E-F). Comparable results demonstrating iron-regulated expression of CD63, but not CD81, were also obtained after incubating HeLa and HepG2 cells with FAC or DFX for 16 hours at 37°C (supplemental Figure 1A-H). Collectively, CD63 was regulated by iron in multiple cell types.
Iron-induced CD63 expression occurs by a different mechanism than CD63 induction by autophagic inhibition
Inhibition of autophagy after bafilomycin A1 (Baf A1) results in inhibition of autophagosome-lysosome fusion and increases CD63 and CD81.46 Autophagy is a catabolic process, and in terms of iron metabolism, iron loading (an anabolic effect) may inhibit autophagy. So, we considered whether the effect of iron (as FAC) at increasing CD63 expression (Figure 2A-F) was a result of autophagic inhibition. Autophagy is often modulated by 2 methods: (1) FBS depletion that can initiate autophagy, and (2) the late-stage inhibitor of autophagy, Baf A1, inhibits autophagosome-lysosome fusion.47,48 Thus, IMR90SV cells were incubated for 12 hours at 37°C with medium (–FBS) (the control), medium containing FAC (10 µg/mL) (–FBS), complete media (ie, with FBS), or Baf A1 (2 nM) in complete media (Figure 2G-H). The addition of FAC to media (–FBS) led to the same results as those shown in Figure 2A-B, with a significant (P < .0001 to P < .01) increase in CD63 and FTH expression, whereas there was no significant (P > .05) change in CD81 expression (Figure 2G-H).
To examine alterations in autophagy, expression of microtubule-associated protein 1 light chain 3 (LC3) was assessed.49 Autophagic initiation is examined by assessing conversion of LC3-I (cytosolic form) to LC3-II (autophagosome membrane-bound form), with LC3-II being a classical autophagosome marker that correlates with autophagosome number.47 During autophagy, proteins are targeted to autophagosomes, which fuse with lysosomes to generate autolysosomes.50 Supplementation of media (–FBS) with FAC resulted in a slight increase (P < .05) in LC3-II compared with the control (–FBS) (Figure 2G-H). This is consistent with mild inhibition of autophagy by iron loading.
Inhibition of autophagosome-lysosomal fusion by incubation with Baf A1 in complete media increased CD63 (P < .01) and CD81 (P < .05) compared with the complete media control, as demonstrated previously.46 In contrast, Baf A1 did not alter the low FTH expression compared with the complete medium control. The addition of Baf A1 also resulted in an increase in LC3-II (P < .01) compared with the control, which is expected based on the failure of autophagosomes to fuse with lysosomes, which prevents the degradation of LC3-II (Figure 2G-H). Treatment with Baf A1 and its effect on LC3-II acted as a positive control for its activity. Collectively, these studies (Figure 2G-H) demonstrated that upregulation of CD63 and CD81 via the inhibition of autophagy by Baf A1 was distinct from the effect of FAC, which upregulated ferritin and CD63 expression but not CD81 expression.
Further studies analyzed the subcellular localization of CD81 and CD63 by using confocal microscopy. In these experiments, IMR90SV cells were incubated for 12 hours with control medium (–FBS) (control) or this medium containing either Baf A1 or FAC. Under control conditions (–FBS), CD63 (red) and CD81 (green) demonstrated weak colocalization, whereas incubation with Baf A1 (–FBS) induced a significant (P < .0001) increase in colocalization between CD63 and CD81 (yellow; Figure 2I-K). Baf A1 prevents fusion of lysosomes and autophagosomes and results in autophagosome accumulation,47,48 which suggests that the colocalization of CD63 and CD81 is occurring in autophagosomes. In contrast, when cells were incubated with FAC (–FBS), there was no significant (P > .05) difference in colocalization between CD63 and CD81 compared with the control (–FBS) (Figure 2I-K). In agreement with the immunoblotting (Figure 2A-B,G-H), incubation with FAC (–FBS) increased CD63 expression but had no effect on CD81 expression (Figure 2I-K).
To assess whether other metals induce CD63 expression, its mRNA and protein levels were measured after loading IMR90SV fibroblasts with ZnSO4 (40 µM; supplemental Figure 2A-E). After loading cells with Zn(II), levels of zinc were significantly (P < .0001) increased (supplemental Figure 2A-B), whereas neither CD63, CD81, FTH, and FTL mRNA levels (supplemental Figure 2C) nor their protein levels (supplemental Figure 2D-E) were significantly altered compared with the control.
In summary, Figure 2 and supplemental Figure 2 show that the major EV components CD63 and CD81 are upregulated by Baf A1, whereas only CD63 is upregulated by cellular iron loading with FAC.
Iron induces secretion of CD63 and ferritin in EVs
Next, we analyzed loading cells with iron using FAC and examining CD63, CD81, and FTH and FTL expression in secreted EVs (Figure 3). In these studies, IMR90SV fibroblasts (Figure 3) and the human THP1 monocytic cell line (supplemental Figure 3) were cultured for 48 hours at 37°C with FAC at 0, 5, or 20 µg/mL. This medium contained 0.5% FBS that had already been depleted of bovine EVs,51 and this low FBS level was used to maintain cellular viability. After the 48-hour incubation of cells with and without FAC, the culture supernatant was decanted and examined for CD63, CD81, FTH, and FTL (Figure 3A-B; supplemental Figure 3).
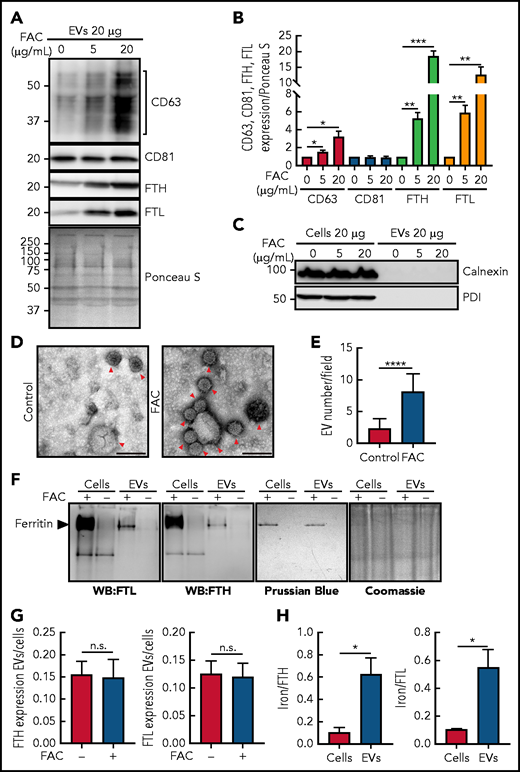
Increasing cellular iron after incubation with FAC upregulates CD63, FTH, and FTL expression in isolated EVs with the ferritin in EVs containing iron. (A) IMR90SV cells were incubated with medium containing 0 (control), 5, or 20 µg/mL FAC for 48 hours at 37°C. (A) EVs and (C) EVs or cells were prepared in lysis buffer, the protein concentration was measured by a bicinchoninic acid (BCA) protein assay, and 20 µg of protein from each sample was analyzed using anti-CD63, anti-CD81, anti-FTH, anti-FTL, anti-calnexin, and anti-protein disulphide-isomerase (PDI) antibodies. (B) Quantification of CD63, CD81, FTH and FTL shown in panel A using Fiji software. Expression was normalized by Ponceau S staining as in panel A. (D) Representative transmission electron microscope images of isolated EVs from IMR90SV cells with negative staining by uranyl acetate. Red arrowheads show EVs. Scale bar, 100 nm. (E) Quantification of EV number per field in panel D. Thirty transmission electron micrograph fields over 3 experiments (>90 fields) at an original magnification of 20 000× were randomly chosen, and EVs were counted by a blinded investigator (up to 500 to 1000 vesicles were counted per experiment). (F) IMR90SV cells incubated with FAC (10 µg/mL) for 48 hours at 37°C express high levels of FTH and FTL in cells and EVs, as demonstrated by native polyacrylamide gel electrophoresis (PAGE) and immunoblotting (20 µg protein per well; western blotting (WB), left-hand membranes). The same samples were simultaneously run under native PAGE conditions and stained with Prussian blue (60 µg of protein/lane) to identify Fe+3. Coomassie blue staining of the gel was used to verify equal protein loading; full-lane densitometry of staining showed no difference with or without FAC treatment. (G) Ratios of FTH and FTL expression in EVs and cells after densitometric analysis of the results in panel F. (H) Iron:FTH or iron:FTL ratios in cells or EVs after densitometric analysis of the results in panel F. Results are mean ± SEM (3 experiments). Significance was determined using the Student t test. *P < .05; **P < .01; ***P < .001; ****P < .0001.
Increasing cellular iron after incubation with FAC upregulates CD63, FTH, and FTL expression in isolated EVs with the ferritin in EVs containing iron. (A) IMR90SV cells were incubated with medium containing 0 (control), 5, or 20 µg/mL FAC for 48 hours at 37°C. (A) EVs and (C) EVs or cells were prepared in lysis buffer, the protein concentration was measured by a bicinchoninic acid (BCA) protein assay, and 20 µg of protein from each sample was analyzed using anti-CD63, anti-CD81, anti-FTH, anti-FTL, anti-calnexin, and anti-protein disulphide-isomerase (PDI) antibodies. (B) Quantification of CD63, CD81, FTH and FTL shown in panel A using Fiji software. Expression was normalized by Ponceau S staining as in panel A. (D) Representative transmission electron microscope images of isolated EVs from IMR90SV cells with negative staining by uranyl acetate. Red arrowheads show EVs. Scale bar, 100 nm. (E) Quantification of EV number per field in panel D. Thirty transmission electron micrograph fields over 3 experiments (>90 fields) at an original magnification of 20 000× were randomly chosen, and EVs were counted by a blinded investigator (up to 500 to 1000 vesicles were counted per experiment). (F) IMR90SV cells incubated with FAC (10 µg/mL) for 48 hours at 37°C express high levels of FTH and FTL in cells and EVs, as demonstrated by native polyacrylamide gel electrophoresis (PAGE) and immunoblotting (20 µg protein per well; western blotting (WB), left-hand membranes). The same samples were simultaneously run under native PAGE conditions and stained with Prussian blue (60 µg of protein/lane) to identify Fe+3. Coomassie blue staining of the gel was used to verify equal protein loading; full-lane densitometry of staining showed no difference with or without FAC treatment. (G) Ratios of FTH and FTL expression in EVs and cells after densitometric analysis of the results in panel F. (H) Iron:FTH or iron:FTL ratios in cells or EVs after densitometric analysis of the results in panel F. Results are mean ± SEM (3 experiments). Significance was determined using the Student t test. *P < .05; **P < .01; ***P < .001; ****P < .0001.
The expression of CD63 in EVs obtained from supernatants from IMR90SV fibroblasts demonstrated a pronounced and significant (P < .05) increase upon incubation of cells with increasing FAC (Figure 3A-B). In contrast, there was no change in CD81 expression in EVs upon iron loading (Figure 3A-B), which was in agreement with the absence of any alteration in cellular CD81 after incubation with FAC (Figure 2A-B). Of note, there was a marked and significant (P < .001 to P < .0001) increase in the expression of FTH and FTL in EVs from IMR90SV fibroblasts as a function of FAC concentration (Figure 3A-B). Results analogous to those found in IMR90SV cells (Figure 3A-B) were also observed for THP1 cells, with iron loading markedly and significantly increasing the expression of CD63, FTH, and FTL, but not CD81, in cells and EVs (supplemental Figure 3A-E).
Under these conditions of iron loading, the cells were fully viable, as judged by their morphology and Trypan blue staining (>95%). As a control for generalized cell protein release into the medium as a result of cell death, we examined the expression of the intracellular proteins calnexin and protein disulphide isomerase (PDI; Figure 3C). These were robustly expressed in IMR90SV fibroblasts but were absent from their secreted EVs (Figure 3C).
To further assess EV secretion from cells upon iron loading, we used transmission electron microscopy of EVs from cellular supernatants, which revealed smaller EVs at 48 to 58 nm and larger EVs at 100 to 200 nm (Figure 3D-E). This examination also revealed a significant (P < .0001) increase in the number of EVs released upon cellular iron loading using FAC (Figure 3D-E). Collectively, the number of EVs secreted from cells upon iron loading with FAC was increased ∼3 times (Figure 3D-E), and CD63 expression in secreted EVs was increased 3 to 4 times (Figure 3A). Thus, the number of CD63+ EVs secreted that contained FTH and FTL was increased by cellular iron loading.
Next, we determined whether ferritin in EVs contains iron because serum ferritin contains little iron.52,53 After loading IMR90SV fibroblasts with FAC (10 µg/mL) for 48 hours at 37°C compared with control medium, native polyacrylamide gel electrophoresis (PAGE) and immunoblotting confirmed the upregulation of FTH and FTL in cells and EVs (Figure 3F). Assessing whether these same samples contained iron-loaded ferritin, native PAGE was simultaneously performed and stained with Prussian blue to detect Fe+3. A single Prussian blue stained band was detected in both cells and EVs that migrated at the same level as ferritin and was evident only in FAC-treated samples (Figure 3F), indicating that cells and EVs contain Fe.
Examining the ratio of FTH or FTL protein between EVs and cells after FAC and comparing it with the control (Figure 3F; supplemental Figure 3A-D) demonstrated no alteration (Figure 3G; supplemental Figure 3E), indicating similar relative increases in FTH and/or FTL levels in cells and EVs upon iron loading. However, examining Figure 3F in which ferritin expression and iron levels were simultaneously assessed in cells and EVs under native conditions, a marked and significant (P < .0001) increase in FTH and FTL in EVs occurred after iron loading. Furthermore, there was an ∼10-fold greater increase in FTH or FTL in cells compared with that in EVs after incubating cells with FAC (Figure 3F), whereas there was only 2 to 3 times more iron in intracellular ferritin compared with EV ferritin. Thus, when the iron:FTL or iron:FTH ratios were calculated, this demonstrated that a significantly (P < .05) greater proportion of ferritin in EVs is iron loaded compared with that in intracellular ferritin (Figure 3H).
The IRE-IRP system posttranscriptionally regulates CD63
Noting that CD63 was upregulated by iron loading (Figures 2 and 3), we then aimed to dissect the mechanism involved. To examine the role of the IRE-IRP mechanism in regulating CD63 by iron, we examined the presence of IREs in 5′ and 3′ UTR regions of CD63 mRNA by using the IRE prediction software SIREs Web Server 2.0.37 In the 5′ UTR region of CD63 mRNA, a 31-nucleotide long mRNA sequence was predicted as a consensus IRE (Figure 1A).32-3437 The consensus features of typical (type I) IRE stem loops include (1) an apical pseudotriloop of 6 nucleotides (CAG(U/A)GN; Figure 1A-B)33-35, (2) a midstem cytosine bulge (C8; Figure 1A-B), (3) a 5-bp upper helix (Figure 1A-B), and (4) a variable lower helix, and they are ∼30 nucleotides in length.54-56
A number of IREs have been characterized in the 5′ UTRs of mRNAs that are very similar to the consensus IRE observed in CD63 mRNA (Figure 1A).32,57-61 Functional IREs that bind IRPs are also found in the 3′ UTR (Figure 1B).62-66 The stability of the IRP1-IRE mRNA complex is dictated by the free energy change (Figure 1A-B; Table 1),67 with the CD63 IRE (–2.3 kcal/mol) being within the range of consensus type I IREs (ie, −1.3 to −10.6 kcal/mol; Figure 1A-B), whereas atypical type II IREs demonstrate very minimal stability (Figure 1A).37
Conserved sequences of CD63 IREs in various species
| Conserved CD63 IREs species | Common name | Predicted sequences | Free energy (kcal/mol) | IRE motif classification |
|---|---|---|---|---|
| Homo sapiens | Human | GAGGGGGCUUGCACAGAGUUGGAGCCAGAGG | −2.3 | Typical |
| Pan paniscus | Bonobo; pygmy chimpanzee | GAGGGGGCTTGCACAGAGTTGGAGCCAGAGG | −2.3 | Typical |
| Pan troglodytes | Chimpanzee | GAGGGGGCUUGCACAGAGUUGGAGCCAGAGG | −2.3 | Typical |
| Gorilla gorilla | Western gorilla | GACGGGGCUUGCACAGAGUUGGAGCCAGAGG | −2.3 | Typical |
| Theropithecus gelada | Gelada; gelada baboon | UUUCCGGGUGGGAGGGGCCGGGAAUCG | −4.3 | SELEX |
| Bos taurus | Cattle | CCCCCCUCAUCCGGGGAGGGGGGUAAUAUAC | −3.4 | SELEX |
| Sus scrofa | Pig | CCUGAGCCGCGGCGGGAGUGCAGCGCACAGC | −8.4 | SELEX |
| Peromyscus leucopus | White-footed mouse | CCUGAGCCGCGGCGGGAGUGCAGCGCACAGC | −8.4 | SELEX |
| Ovis aries | Sheep | CAGCCCCCUCAUCCAGGGGAGUGGGGUAAUA | −2.3 | SELEX |
| Capra hircus | Goat | CAGCCCCCUCAUCCAGGGGAGUGGGGUAAUA | −2.3 | SELEX |
| Camelus dromedarius | Arabian camel | CCUGAGCCGCAGCGGGAGAGCAGCGCACAGC | −8.8 | SELEX |
| Mesocricetus auratus | Golden hamster | CGGCGCCGGGUUCCAGUGAGGGCCCCGGGAA | −6.4 | SELEX |
| Physeter catodon | Sperm whale | CCUGAGCCGCGGCGGGAGAGCAGCGCACAGC | −9.2 | SELEX |
Characters in bold indicate loop structure in the CD63 IRE; characters not shown in bold type indicate the predicted stem sequences. Typical (type I) canonical IRE motifs: 5′-CAG(U/A)GN-3′. The systematic evolution of ligands by exponential enrichment motif (SELEX) has been demonstrated to bind IRP1 and/or IRP2 in vitro.32,37
The human CD63 IRE was conserved in the 5′ UTR in 4 of 25 primates assessed (Table 1). Sixty organisms were also examined for IREs in the 5′ UTR using SIREs,37 with the identification of high and medium stringency systematic evolution of ligands by exponential enrichment motif (SELEX) IRE motifs in the 5′ UTR of CD63 in 9 mammals (Table 1). This level of stringency captures classical IREs.37
To examine the role of IRPs in CD63 regulation, studies began by using lentiviral short hairpin RNAs (shRNAs) against IRP1 and IRP2 in IMR90SV fibroblasts (Figure 4A-B). Two IRP1 shRNAs (#1 and #2) led to a significant (P < .001 to P < .01) 60% and 50% downregulation of IRP1 in IRP1KD#1 and IRP1KD#2 cells, respectively, but had no significant effect on IRP2 (Figure 4A-B). The decreased IRP1 in IRP1KD#1 and IRP1KD#2 resulted in a slight, but significant (P < .01) twofold to threefold increase in FTL compared with the respective control. Examining CD63, a slight but significant (P < .01) increase was observed in IRP1KD#1 and IRP1KD#2 cells (Figure 4A-B). In contrast, no significant alteration in CD81 was found for IRP1KD#1 and IRP1KD#2 cells.
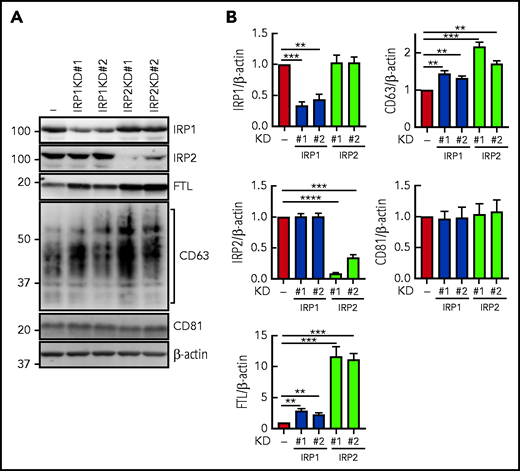
Silencing of IRP1 or IRP2 increases CD63 expression. (A) IRP1 and IRP2 expression were silenced by shRNA. Cells were lysed in lysis buffer, and 20 µg of protein per sample was analyzed with anti-IRP1, anti-IRP2, anti-CD63, anti-CD81, anti-FTL, and anti–β-actin antibodies. (B) Quantification of IRP1, IRP2, FTL, CD63, and CD81 from panel A. Results are mean ± SEM (3 experiments). Significance was determined using the Student t test. **P < .01; ***P < .001; ****P < .0001.
Silencing of IRP1 or IRP2 increases CD63 expression. (A) IRP1 and IRP2 expression were silenced by shRNA. Cells were lysed in lysis buffer, and 20 µg of protein per sample was analyzed with anti-IRP1, anti-IRP2, anti-CD63, anti-CD81, anti-FTL, and anti–β-actin antibodies. (B) Quantification of IRP1, IRP2, FTL, CD63, and CD81 from panel A. Results are mean ± SEM (3 experiments). Significance was determined using the Student t test. **P < .01; ***P < .001; ****P < .0001.
The 2 IRP2 shRNAs #1 and #2 led to a significant (P < .001 to P < .01) 90% and 70% decrease of IRP2 in IRP2KD#1 and IRP1KD#2 cells, respectively, but had no significant effect on IRP1 (Figure 4A-B). The downregulation of IRP2 caused a significant (P < .01 to P < .001) increase in FTL and CD63 (Figure 4A-B), whereas there was no effect on CD81. To summarize, the IRP1 and IRP2 shRNAs #1 and #2 demonstrate that decreased IRP1 or IRP2 leads to posttranscriptional de-repression and upregulation of the IRE-containing targets FTL and CD63.
The IRE domain in human CD63 mRNA is located at −221 to −191 bp upstream of the first methionine, which is similar to the IRE of FTH (–180 to −146 bp)32 or FTL (–181 to −141 bp)61 (Figure 5A). We then assessed whether the consensus IRE in CD63 mRNA could function as an IRP-binding motif by using RNA pulldown (Figure 5B-C) and native EMSAs (Figure 5D-E). The 31-bp IRE in the CD63 5′ UTR was biotinylated, mixed with IMR90SV cell extracts, and pulled down using biotin-streptavidin beads. The CD63 IRE sequence led to a significant (P < .0001 to P < .001) increase in IRP1 and IRP2 binding compared with the beads alone or the non-IRE control (Figure 5B-C).
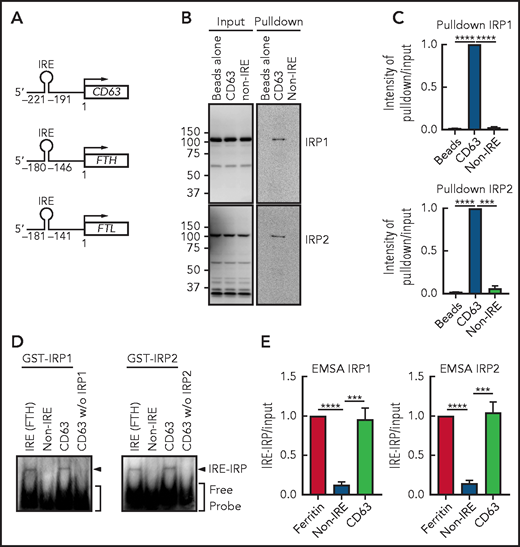
CD63 expression is posttranscriptionally regulated by the IRE-IRP system. (A) Schema of the size and locations of the 5′-IRE domains in CD63, FTH, and FTL mRNAs. (B) CD63 IRE-containing mRNA and non-IRE mRNA were biotinylated and mixed with a total protein extract from IMR90SV cells followed by pulldown using streptavidin beads. Input and pulldown proteins were analyzed by using anti-IRP1 and anti-IRP2 antibodies. Upon equal exposure of the input and pulldown, the percentage of IRP pulled down from the input was 2.5%. (C) Quantification of IRP1 and IRP2 intensity in panel B. (D) Purified GST-IRP1 or GST-IRP2 was mixed with biotinylated FTH IRE, CD63 IRE, or non-IRE RNA (see “Methods” for details). Samples were loaded onto a native 6% TBE-polyacrylamide gel, transferred onto nylon membrane, and stained with streptavidin-horseradish peroxidase. (E) Quantification of shifted bands in panel D. Results are mean ± SEM (3 experiments). Significance was determined by Student t test. ***P < .001; ****P < .0001.
CD63 expression is posttranscriptionally regulated by the IRE-IRP system. (A) Schema of the size and locations of the 5′-IRE domains in CD63, FTH, and FTL mRNAs. (B) CD63 IRE-containing mRNA and non-IRE mRNA were biotinylated and mixed with a total protein extract from IMR90SV cells followed by pulldown using streptavidin beads. Input and pulldown proteins were analyzed by using anti-IRP1 and anti-IRP2 antibodies. Upon equal exposure of the input and pulldown, the percentage of IRP pulled down from the input was 2.5%. (C) Quantification of IRP1 and IRP2 intensity in panel B. (D) Purified GST-IRP1 or GST-IRP2 was mixed with biotinylated FTH IRE, CD63 IRE, or non-IRE RNA (see “Methods” for details). Samples were loaded onto a native 6% TBE-polyacrylamide gel, transferred onto nylon membrane, and stained with streptavidin-horseradish peroxidase. (E) Quantification of shifted bands in panel D. Results are mean ± SEM (3 experiments). Significance was determined by Student t test. ***P < .001; ****P < .0001.
Next, EMSA was performed using purified human recombinant GST-IRP1 and GST-IRP2 (Figure 5D). Upon mixing FTH-IRE (positive control) or CD63 5′ UTR RNA with GST-IRP1 or GST-IRP2, a single shifted band became apparent, which demonstrated the functional interaction of the IRE with IRP1 or IRP2 (Figure 5D-E). Notably, the non-IRE containing control probe used in Figure 5B and the CD63 IRE added without IRP1 or IRP2 were negative. These results demonstrate that the consensus IRE in CD63 mRNA is functional in terms of IRP1 and IRP2 binding, suggesting that CD63 could be regulated via this mechanism.
NCOA4 associates with CD63+ EVs and transfers ferritin into EVs
NCOA4 acts as a receptor that delivers iron-laden ferritin to lysosomes for iron release during iron depletion.68 We hypothesized that NCOA4 may also act as a ferritin trafficking receptor, which can fuse with CD63+ EVs and transfer ferritin to the secretory pathway. To confirm this, IMR90SV cells were incubated with medium (–FBS) (control) or medium containing 10 µg/mL FAC for 16 hours at 37°C, and then we examined the cells using confocal immunofluorescence microscopy (Figure 6A-C).
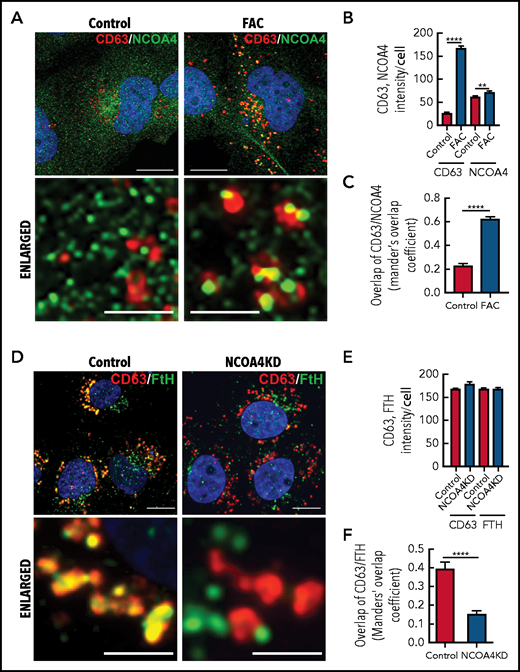
Iron repletion leads to the colocalization of CD63 and NCOA4 into the same vesicle. (A) IMR90SV cells were incubated in medium (–FBS) (control) or medium supplemented with FAC (10 µg/mL) for 16 hours at 37°C. Cells were fixed and stained with anti-NCOA4 (green) and anti-CD63 (red) antibodies. (B) Quantification of CD63 and NCOA4 intensity in panel A. (C) Quantification of CD63 and NCOA4 colocalization indicated by Manders’ overlap coefficient. (D) Control and NCOA4KD IMR90SV cells were incubated for 16 hours at 37°C with 10 µg/mL FAC. Cells were fixed and stained with anti-FTH (green) and anti-CD63 (red) antibodies. (E) Quantification of CD63 and NCOA4 intensity in panel D. (F) Quantification of CD63 and FTH colocalization by Manders’ overlap coefficient. (A,D) Thin scale bar, 10 µm; thick scale bar, 2.5 µm. For analysis, >60 cells were examined per condition over 3 experiments. Results are mean ± SEM (3 experiments). Significance was determined using the Student t test. **P < .01; ****P < .0001.
Iron repletion leads to the colocalization of CD63 and NCOA4 into the same vesicle. (A) IMR90SV cells were incubated in medium (–FBS) (control) or medium supplemented with FAC (10 µg/mL) for 16 hours at 37°C. Cells were fixed and stained with anti-NCOA4 (green) and anti-CD63 (red) antibodies. (B) Quantification of CD63 and NCOA4 intensity in panel A. (C) Quantification of CD63 and NCOA4 colocalization indicated by Manders’ overlap coefficient. (D) Control and NCOA4KD IMR90SV cells were incubated for 16 hours at 37°C with 10 µg/mL FAC. Cells were fixed and stained with anti-FTH (green) and anti-CD63 (red) antibodies. (E) Quantification of CD63 and NCOA4 intensity in panel D. (F) Quantification of CD63 and FTH colocalization by Manders’ overlap coefficient. (A,D) Thin scale bar, 10 µm; thick scale bar, 2.5 µm. For analysis, >60 cells were examined per condition over 3 experiments. Results are mean ± SEM (3 experiments). Significance was determined using the Student t test. **P < .01; ****P < .0001.
Under control conditions, NCOA4 (green) appeared in the cytosol as small, perinuclear, vesicle-like structures (Figure 6A, left), in agreement with studies indicating that NCOA4 localizes to the Golgi apparatus69 and/or microtubules.70 However, upon iron repletion with FAC, CD63 (red) significantly (P < .0001) increased compared with the control (Figure 6A-B). Under these conditions, NCOA4 became associated with larger CD63+ vesicles (Figure 6A, right) that resulted in a significant (P < .0001) increase in NCOA4 and CD63 colocalization upon iron repletion with FAC (Figure 6C). A previous study demonstrated that NCOA4 was degraded after iron loading through a ubiquitin-proteasome pathway.68 We determined, by using IMR90SV fibroblasts, that total NCOA4 expression was not altered upon incubation with FAC (2 to 24 hours; supplemental Figure 4Ai). However, during this time course, the number of NCOA4 foci per cell decreased significantly, and the average size of NCOA4 foci concurrently increased significantly, suggesting that foci were coalescing (supplemental Figure 4Aii). Moreover, by examining iron loading over 2 to 24 hours, expression of NCOA4 and its ubiquitin ligase HECT and RLD domain–containing E3 ubiquitin protein ligase 2 (HERC2) did not change significantly, whereas IRP2, FTL, and FTH were markedly altered after only 6 hours (supplemental Figure 4D-E). Collectively, these data (Figure 6A; supplemental Figure 4) demonstrate that upon iron loading, NCOA4 puncta coalesce into larger structures and colocalize with CD63+ vesicles, possibly to facilitate ferritin trafficking into EVs.
Given these latter results, we explored whether ferritin is transferred to CD63+ vesicles via NCOA4. NCOA4 was silenced in IMR90SV cells to generate NCOA4KD cells and was compared with scramble control cells (Figure 6D-F). These cells were incubated for 16 hours at 37°C with 10 µg/mL FAC (–FBS), and FTH and CD63 were investigated by using confocal microscopy. There was no change in CD63 or FTH intensity in NCOA4KD cells compared with scramble control cells (Figure 6E). However, upon examination, scramble control cells, CD63 (red), and FTH (green) containing vesicular structures strongly merge, leading to yellow fluorescence (Figure 6D), suggesting association of CD63 with FTH. Importantly, there was a significant (P < .0001) decrease in colocalization of FTH with CD63+ vesicles in NCOA4KD cells compared with the scrambled control (Figure 6F). In fact, in NCOA4KD cells, FTH was observed in vesicle-like structures that no longer merge with CD63-containing vesicles (Figure 6D). This latter finding indicated that loss of NCOA4 prevented association of FTH with CD63-containing vesicles. In summary, Figure 6 shows that under iron loading, NCOA4 associates with CD63+ EVs and transfers ferritin into these structures.
FTH secretion through EVs under iron loading is dependent on NCOA4 expression
The results in Figure 6A-C demonstrate association of NCOA4 and CD63-containing vesicles under iron loading, so we performed additional studies to determine whether FTH secretion through EVs was dependent on NCOA4 expression (Figure 7A-D). This was assessed by implementing NCOA4KD cells compared with the respective scramble control cells after incubation with or without 10 µg/mL FAC for 48 hours at 37°C in the presence of 0.5% FBS that had been depleted of bovine EVs.51 Cells were incubated for 48 hours to ensure secretion of sufficient EVs. Incubation of scramble control cells with FAC caused a slight (P < .05) decrease of NCOA4 (Figure 7A-B). By examining NCOA4KD cells, we determined that NCOA4 was downregulated to 30% of the scramble control in the presence or absence of FAC (Figure 7A-B). Iron loading significantly (P < .01 to P < .05) increased CD63 or FTH irrespective of the decreased NCOA4 in NCOA4KD cells (Figure 7A-B). Silencing of NCOA4 slightly increased FTH in NCOA4KD cells in the absence of FAC, which is consistent with its catabolic role in ferritinophagy63 and the loss of function after silencing.
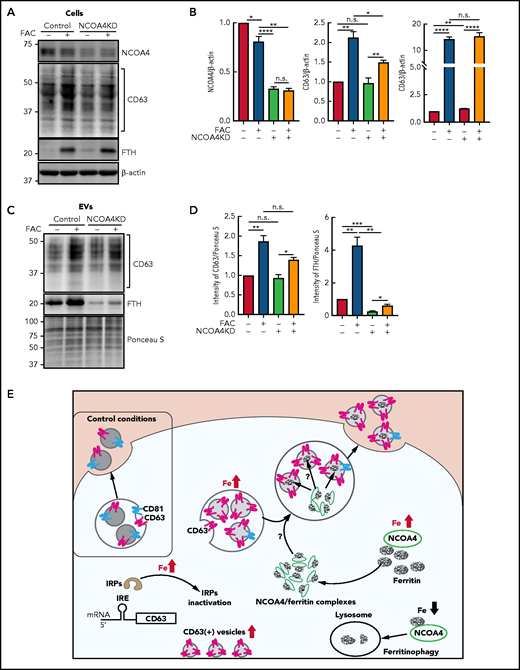
Ferritin secretion through EVs is dependent on NCOA4 expression. (A) IMR90SV cells were incubated in the presence or absence of FAC (10 µg/mL) for 48 hours at 37°C. Isolated EVs from cell culture supernatants were collected by the procedures described in “Methods.” (A) Total cell lysates (20 µg of protein per sample) and (C) EVs (20 µg of protein per sample) were analyzed by immunoblotting with anti-CD63, anti-FTH, anti-NCOA4, and anti–β-actin antibodies. (B) Quantification of NCOA4, CD63, and FTH in panel A. (D) Quantification of CD63 and FTH in panel C. Results are mean ± SEM (3 experiments). (E) Schematic illustrating the mechanism of ferritin iron secretion that occurs by EVs upon iron repletion. Iron repletion induces IRP inactivation, which initiates both ferritin and CD63 translation via the dissociation of IRP from the canonical type I IRE in the 5′ UTR of CD63 mRNA. Upon iron repletion, CD63 expression, but not CD81 expression, in EVs is markedly increased, and CD63 is important for ferritin-mediated iron secretion from cells. The ferritin cargo receptor NCOA4 closely associates with CD63+ vesicles under iron loading and is necessary for the association of ferritin and CD63 and also ferritin secretion in EVs. It will be necessary to investigate the mechanism of how ferritin is transferred from NCOA4-ferritin complexes68 to EVs. In contrast to iron loading, upon iron depletion, ferritin is degraded in lysosomes via the autophagic pathway of ferritinophagy.68 Significance was determined by the Student t test. *P < .05; **P < .01; ***P < .001; ****P < .0001.
Ferritin secretion through EVs is dependent on NCOA4 expression. (A) IMR90SV cells were incubated in the presence or absence of FAC (10 µg/mL) for 48 hours at 37°C. Isolated EVs from cell culture supernatants were collected by the procedures described in “Methods.” (A) Total cell lysates (20 µg of protein per sample) and (C) EVs (20 µg of protein per sample) were analyzed by immunoblotting with anti-CD63, anti-FTH, anti-NCOA4, and anti–β-actin antibodies. (B) Quantification of NCOA4, CD63, and FTH in panel A. (D) Quantification of CD63 and FTH in panel C. Results are mean ± SEM (3 experiments). (E) Schematic illustrating the mechanism of ferritin iron secretion that occurs by EVs upon iron repletion. Iron repletion induces IRP inactivation, which initiates both ferritin and CD63 translation via the dissociation of IRP from the canonical type I IRE in the 5′ UTR of CD63 mRNA. Upon iron repletion, CD63 expression, but not CD81 expression, in EVs is markedly increased, and CD63 is important for ferritin-mediated iron secretion from cells. The ferritin cargo receptor NCOA4 closely associates with CD63+ vesicles under iron loading and is necessary for the association of ferritin and CD63 and also ferritin secretion in EVs. It will be necessary to investigate the mechanism of how ferritin is transferred from NCOA4-ferritin complexes68 to EVs. In contrast to iron loading, upon iron depletion, ferritin is degraded in lysosomes via the autophagic pathway of ferritinophagy.68 Significance was determined by the Student t test. *P < .05; **P < .01; ***P < .001; ****P < .0001.
Examination of secreted EVs showed that CD63 was significantly (P < .01 to P < .05) increased in EVs after incubation of cells with FAC in scramble control cells and NCOA4KD cells (Figure 7C-D). FTH was significantly (P < .01) increased by FAC in the scramble control cells compared with control medium. Notably, FTH was significantly (P < .001 to P < .01) higher in the presence and absence of FAC in the scramble control cells compared with their respective treatments in NCOA4KD cells (Figure 7C-D). These results indicate that NCOA4 silencing markedly decreased FTH in isolated EVs and also indicate that NCOA4 plays a role in ferritin secretion via EVs through CD63+ vesicles.
Discussion
This study has identified the IRE-IRP–dependent posttranscriptional regulation of CD63, one of the major EV-associated proteins involved in exosome secretion.6 Furthermore, CD63+ EVs associate with NCOA4 ferritin vesicles within cells, with NCOA4 transferring ferritin to these structures, which are then secreted under conditions of cellular iron loading (Figure 7E). The iron-regulated secretion of the major iron storage protein ferritin via CD63 poses significant consequences for understanding regulation of cellular iron metabolism, particularly local cell-to-cell exchange of ferritin.
Ferritin secretion occurs in many normal and neoplastic cell types,13-27 with iron-rich ferritin being secreted via the multivesicular body-exosome pathway12 and FTH being demonstrated in exosomes.11,12 EVs are important for intercellular communication, with ferritin secreted from macrophages being an additional iron source for erythroid cells.21
Of note, NCOA4 functions as an intracellular ferritin cargo receptor and directly binds FTH, with ferritin being incorporated into autophagosomes to initiate ferritinophagy under iron deprivation (catabolic) conditions.68 In contrast, under iron loading (anabolic) conditions in which CD63 is upregulated, the ferritin cargo receptor NCOA4 closely associates with CD63+ vesicles (Figure 6A). Furthermore, ferritin was identified within CD63+ EVs, and cells depleted of NCOA4 resulted in impaired ferritin secretion in EVs. In fact, examining NCOA4-depleted cells showed that ferritin was observed outside CD63+ vesicles (Figure 6D), which is consistent with a previous report demonstrating that aggregation of insoluble ferritin in the cytoplasm was enhanced under NCOA4-depleted conditions.70,71 Collectively, ferritin follows 2 distinct pathways via NCOA4 that are dependent on the metabolic state: (1) lysosomal degradation of ferritin during iron deficiency that mobilizes stored iron68 and (2) extracellular secretion of ferritin through CD63+ EVs under anabolic conditions when cells are iron loaded.
The ability of the cells to regulate cellular iron mobilization via ferritin released through EVs adds another dimension to the mechanisms of cellular iron efflux that includes iron release mediated by ferroportin, which is regulated by the IRE-IRP system60 and hepcidin.72 Having 2 well-regulated systems of iron mobilization (secretory ferritin and iron released from ferroportin that is then bound by transferrin) could be critical for fine-tuning cellular iron demands. Previous studies have indicated that serum ferritin is iron poor.52,53 Our results demonstrate that only after cellular iron loading did secreted EVs contain iron-loaded ferritin (Figure 3F,H). Thus, cellular iron status seems to be critical in terms of the iron loading of secreted ferritin in EVs and is important for considering local cellular ferritin and iron metabolism.
In summary, CD63, which is involved in EV secretion,6 is regulated by the IRE-IRP system, with a canonical IRE in the 5′ UTR of CD63 mRNA regulating its expression. Iron loading resulted in secretion of CD63+ EVs from cells that contained iron-loaded ferritin (Figure 3A-B), and intracellular ferritin was shown to be transferred via NCOA4 to CD63+ EVs that are secreted (Figure 7E). Such a mechanism provides new understanding regarding the regulation of iron metabolism, especially local cell-to-cell exchange of ferritin and iron.
Acknowledgments
This work was supported by Japan Society for the Promotion of Science (JSPS) Grants-in-Aid for Scientific Research (KAKENHI) (19K23722 and 20K07309) (I.Y.); grants from the National Health and Medical Research Council of Australia (APP1144456 and APP1144829) and a Senior Principal Research Fellowship (APP1159596); a grant from the Australian Research Council (DP200103530) (D.R.R.); and grants from the Japan Science and Technology Agency (JST) Core Research for Evolutional Science and Technology (CREST) (JPMJCR19H4) and JSPS KAKENHI (JP20H05502) (S.T.).
Electron microscopic analyses were supported by Koji Itakura, Division of Medical Research Engineering, Nagoya University Graduate School of Medicine.
Authorship
Contribution: I.Y. designed all of experiments and performed the research; H.S.D. co-designed some experiments and analyzed the data; I.Y., H.S.D., and D.R.R. analyzed the data and wrote and edited the manuscript; S.T. reviewed and edited the manuscript; and F.K. supervised I.Y., provided academic guidance, and supported the research project.
Conflict-of-interest disclosure: The authors declare no competing financial interests.
Correspondence: Des R. Richardson, Centre for Cancer Cell Biology and Drug Discovery, Griffith Institute for Drug Discovery, Griffith University, Nathan, Brisbane, QLD 4212, Australia; e-mail: d.richardson@griffith.edu.au; and Shinya Toyokuni, Department of Pathology and Biological Responses, Nagoya University Graduate School of Medicine, Nagoya 466-8550, Japan; e-mail: toyokuni@med.nagoya-u.ac.jp.
The online version of this article contains a data supplement.
There is a Blood Commentary on this article in this issue.
The publication costs of this article were defrayed in part by page charge payment. Therefore, and solely to indicate this fact, this article is hereby marked “advertisement” in accordance with 18 USC section 1734.

This feature is available to Subscribers Only
Sign In or Create an Account Close Modal