

Key Points
Lymphoma originating from CAR T cells produced with the piggyBac transposon system has been seen in 2 patients.
The first patient’s lymphoma shows alteration in gene copy number and expression not spatially or functionally related to the CAR gene.

Abstract
We performed a phase 1 clinical trial to evaluate outcomes in patients receiving donor-derived CD19-specific chimeric antigen receptor (CAR) T cells for B-cell malignancy that relapsed or persisted after matched related allogeneic hemopoietic stem cell transplant. To overcome the cost and transgene-capacity limitations of traditional viral vectors, CAR T cells were produced using the piggyBac transposon system of genetic modification. Following CAR T-cell infusion, 1 patient developed a gradually enlarging retroperitoneal tumor due to a CAR-expressing CD4+ T-cell lymphoma. Screening of other patients led to the detection, in an asymptomatic patient, of a second CAR T-cell tumor in thoracic para-aortic lymph nodes. Analysis of the first lymphoma showed a high transgene copy number, but no insertion into typical oncogenes. There were also structural changes such as altered genomic copy number and point mutations unrelated to the insertion sites. Transcriptome analysis showed transgene promoter–driven upregulation of transcription of surrounding regions despite insulator sequences surrounding the transgene. However, marked global changes in transcription predominantly correlated with gene copy number rather than insertion sites. In both patients, the CAR T-cell–derived lymphoma progressed and 1 patient died. We describe the first 2 cases of malignant lymphoma derived from CAR gene–modified T cells. Although CAR T cells have an enviable record of safety to date, our results emphasize the need for caution and regular follow-up of CAR T recipients, especially when novel methods of gene transfer are used to create genetically modified immune therapies. This trial was registered at www.anzctr.org.au as ACTRN12617001579381.
Introduction
Chimeric antigen receptor (CAR) T cells have shown remarkable efficacy in relapsed and refractory B-cell malignancy.1,2 The majority of CAR T-cell products in use have been manufactured using retroviral and lentiviral vectors. Genetic modification carries an inherent risk of mutagenesis as demonstrated by development of leukemia in children receiving genetically modified hemopoietic stem cells for severe combined immunodeficiency.3,4 Although there have been examples of monoclonal CAR T-cell proliferation in patients receiving CD19- and CD22-specific T cells,5,6 these have not been detrimental to patients, and T cells appear to have a low risk of malignant transformation.7
Because of the expense and limited transgene capacity of viral vectors, nonviral gene-modification systems are being explored as alternatives for CAR T-cell production.8-11 We previously devised a simple CAR T-cell production protocol using the piggyBac transposon system12,13 and have seen robust clinical efficacy in patients receiving donor-derived CD19-specific CAR T cells for relapsed and refractory B-cell malignancy post–allogeneic stem cell transplant in a phase 1 clinical trial (the CARTELL study; see accompanying article by Bishop et al14).
Here, we identify 2 cases of malignant transformation of piggyBac transposon–manufactured CD19-specific CAR T cells occurring after infusion. The investigations demonstrate transgene-mediated transcriptional readthrough and other genetic changes including point mutations, background genomic copy-number variations, and a high transgene copy number per cell. We did not identify insertion of the transgene into a known oncogene3-6 and conclude that multiple genetic alterations led to malignant transformation in modified T cells. These results highlight the need for caution in implementing new gene-modification technologies for the manufacture of immune and other therapies.
Materials and methods
Clinical trial details and CAR T-cell production
CAR T cells specific for CD19 (CAR19 T cells) were produced from the HLA-matched sibling donors of patients 2 and 8 using the piggyBac transposon system for gene modification as previously described (supplemental Methods, available on the Blood Web site).12,13
The CAR T cells were administered in the context of the CARTELL study, registered with the Australian New Zealand Clinical Trials Registry (ACTRN12617001579381), and approved by the local human research ethics committee and the Australian Therapeutic Goods Administration (see accompanying article by Bishop et al14). The CAR T-cell products met all release criteria including no autonomous proliferation in vitro using an assay previously described.15
Flow cytometry detection and phosphoflow analysis of CAR T cells
Immunophenotypic and T-cell activation pathway phosphoflow analysis of CAR T cells was performed on FACSCanto or Fortessa flow cytometers (BD Biosciences) and analyzed using FCS Express 6 (De Novo Software, Pasadena, CA) (supplemental Methods).
AbSeq immunophenotypic analysis
Cells were stained with a cocktail of antibody-oligonucleotide conjugates (BD Biosciences) (supplemental Table 1) and loaded onto a 10x Chromium.
An antibody-oligonucleotide conjugate–specific PCR1 primer was used to amplify the AbSeq library, and was sequenced on NextSeq500 or NovaSeq6000 platforms (Illumina, San Diego, CA); the Cellranger pipeline was applied to obtain the protein expression (AbSeq) matrix (supplemental Methods).
Flow cytometry cell sorting
CD4+, CD8+ and CAR+ T cells were selected by flow cytometry sorting on the FACSAria III sorter (BD Biosciences) (supplemental Methods).
For details regarding extraction of DNA and RNA from blood and tissue samples, see supplemental Methods.
TCR clonality analysis
T-cell receptor (TCR) γ and β (TCRG and TRB) clonality was assessed using the Invivoscribe Identiclone TCRG Gene Clonality Assay and LymphoTrack TRB, respectively (Invivoscribe, San Diego, CA) (supplemental Methods).
Hybridization-based NGS analysis
Extracted DNA was analyzed for the presence of mutations in a panel of genes commonly mutated in hematological malignancies as previously described.16 Genomic copy-number analysis was performed using on- and off-target reads from this hybridization-based next-generation sequencing (NGS) panel (supplemental Methods).16,17
Integration site analysis
Integration site analysis in CAR T cells was conducted using muA-mediated integration site recovery as previously described.18,19
Transgene copy-number analysis
CAR transgene copies per cell were assessed by droplet digital PCR using primer/probes specific for the junction of CD28 transmembrane and 4-1BB intracellular sequences and the Bio-Rad Human RPP30 control gene (Hercules, CA) (supplemental Methods).
Whole-genome-sequencing analysis
Whole-genome sequencing was performed by the Australian Genome Research Facility (AGRF) on the NovaSeq 6000 platform (Illumina) to a minimum of 30-fold base coverage (30X) per sample.
CAR19 activity was detected by aligning reads to a modified human reference (GRCh38 with CAR19 as an additional contig) using Sentieon20 with default settings. Structural variants (SVs) were called using the SURVIVOR pipeline,21,22 which measured consensus among Delly (v0.8.2),23 Lumpy (v0.2.13),24 and Manta (v1.6.0)25; SVs were annotated with annotatePeaks.pl from HOMER26 using the hg38 build (supplemental Methods).
Whole-transcriptome analysis
RNA-sequencing libraries were sequenced by AGRF at 1 × 100 bp single-end reads on an Illumina NovaSeq 6000 SP 100 lane.
Reads were aligned to a custom genome (hg38 and CART insert) using STAR27 with RefSeq annotations. Alignments and transcriptional shadows were visualized using IGV (v2.72).28 Genome-position analyses were performed using genomic ranges29 based on RefSeq annotations imported with “rtracklayer”30 and gene lists were annotated with Kyoto Encyclopedia of Genes and Genomes (KEGG) pathways (adjusted P value <.05) using the clusterProfiler package.31
Analyses were performed in the R statistical environment (http://www.r-project.org) with tidyverse32 (supplemental Methods).
Results
Clinical case history
Patient 2 was a 67-year-old man with diffuse large B-cell lymphoma (DLBCL) transformed from follicular lymphoma resistant to multiple lines of chemotherapy, an autologous hemopoietic stem cell transplant (HSCT; December 2014), an HLA-matched sibling allogenic HSCT (November 2015), donor lymphocyte infusions (June, August, November 2016), and radiotherapy. Progressive DLBCL involving the left lobe of the liver, external iliac nodes, iliacus muscle, and paraspinal muscles was diagnosed in June 2017. He received 3 doses of CAR19 T cells (2 × 10⁷ total nucleated cells [TNCs] per m2, 5 × 10⁷ TNCs per m2, 10 × 107 TNCs per m2) produced from his HLA-matched sibling donor administered after lymphocyte-depleting fludarabine and cyclophosphamide (first infusion) or cyclophosphamide alone (second and third infusions) in January, March, and May 2018. At the time of the first dose of CAR T cells, persistent disease on positron emission tomography (PET) was present in the lumbar paraspinal muscles and left iliac nodes. The left para-aortic nodal lesion remained the only PET+ area on repeated scans, gradually increasing in size over 12 months (Figure 1B). The patient had ongoing B-cell aplasia and stable, low-level CAR T cells detectable in his peripheral blood by flow cytometry (Figure 1A). Human herpes virus 6 and cytomegalovirus were repeatedly detected in the patient’s peripheral blood, and BK virus was detectable in the urine and in the peripheral blood to a level of 82c000 copies per mL (Figure 1A).
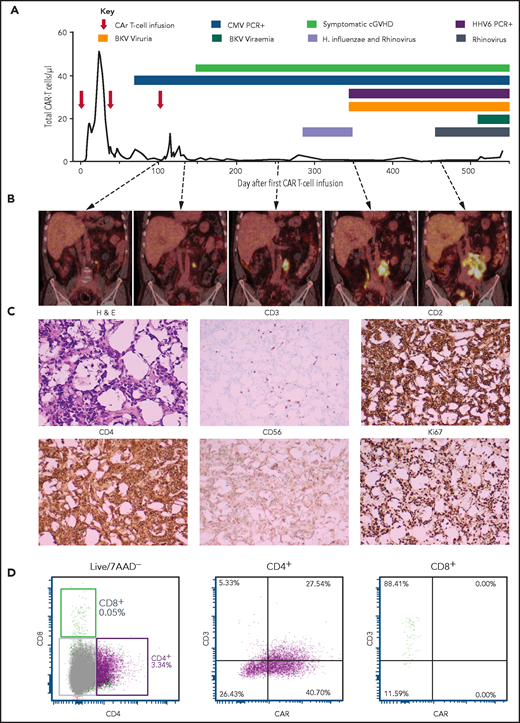
Patient 2 clinical summary, PET scans, and histological features of the CAR T-cell malignancy. (A) Timing of CAR T-cell infusions (red arrows), peripheral blood CAR T-cell quantitation (solid black line), chronic graft-versus-host disease (cGVHD), and infections (colored bars) over time. (B) PET scans showing the left para-aortic lymph node tumor seen from just prior to the third CAR T-cell infusion. (C) Morphology and immunohistochemical staining of tumor biopsy showing aberrant T cells with scanty cytoplasm and enlarged hyperchromatic nuclei, with low/negative CD3 and high CD2, CD4, and Ki67 with moderate CD56 staining. The Ki-67 proliferation index was 99%. The cells were negative for CD5, CD7, CD8, BCL-2, and CD10. Specific stains are shown above each image; original magnifications ×400 for H & E and ×50 for immunohistochemistry images. (D) Flow cytometry assessment of CAR expression on live T cells directly isolated from a biopsy of the para-aortic tumor showing that aberrant CD4+ T cells (purple) with reduced CD3 expression predominantly express CAR compared with a small CD8+ T-cell population (green) with normal CD3 expression and nil CAR expression. 7AAD, 7-amino actinomycin D; BKV, BK virus; CMV, cytomegalovirus; H. influenzae, Haemophilus influenzae; H&E, hematoxylin and eosin; HHV6, human herpesvirus 6; PCR, polymerase chain reaction.
Patient 2 clinical summary, PET scans, and histological features of the CAR T-cell malignancy. (A) Timing of CAR T-cell infusions (red arrows), peripheral blood CAR T-cell quantitation (solid black line), chronic graft-versus-host disease (cGVHD), and infections (colored bars) over time. (B) PET scans showing the left para-aortic lymph node tumor seen from just prior to the third CAR T-cell infusion. (C) Morphology and immunohistochemical staining of tumor biopsy showing aberrant T cells with scanty cytoplasm and enlarged hyperchromatic nuclei, with low/negative CD3 and high CD2, CD4, and Ki67 with moderate CD56 staining. The Ki-67 proliferation index was 99%. The cells were negative for CD5, CD7, CD8, BCL-2, and CD10. Specific stains are shown above each image; original magnifications ×400 for H & E and ×50 for immunohistochemistry images. (D) Flow cytometry assessment of CAR expression on live T cells directly isolated from a biopsy of the para-aortic tumor showing that aberrant CD4+ T cells (purple) with reduced CD3 expression predominantly express CAR compared with a small CD8+ T-cell population (green) with normal CD3 expression and nil CAR expression. 7AAD, 7-amino actinomycin D; BKV, BK virus; CMV, cytomegalovirus; H. influenzae, Haemophilus influenzae; H&E, hematoxylin and eosin; HHV6, human herpesvirus 6; PCR, polymerase chain reaction.
A computed tomography–guided core biopsy 16 months after the first dose of CAR T cells (tumor size, 13 cm × 8 cm) showed fibroadipose tissue infiltrated by intermediate to large CD3+ lymphocytes. TCRG and TRB complementarity-determining region 3 sequencing confirmed monoclonality with a TRVB2-restricted complementarity-determining region 3 sequence (ASSTQGSGNTIY) not matching known sequences.33 Donor-recipient chimerism by microsatellite marker analysis confirmed donor origin.
A repeat laparoscopic biopsy confirmed CAR expression on the monoclonal T cells (Figure 1C-D). Cyclophosphamide, vincristine, and prednisolone chemotherapy was administered leading to transient reduction in tumor size, but was complicated by delirium, sepsis, and acute renal and liver failure leading to death 18 months after CAR T cells. The patient’s family declined an autopsy.
Immunopathological features of the CAR T-cell malignancy
Multiparameter AbSeq immunophenotypic analysis was performed on malignant T cells and compared with the CAR T-cell product (Figure 2A). This showed that the pure CD4+CAR+ T cells with variable CD3 expression were negative for markers of B cells, macrophages, monocytes, dendritic cells, natural killer (NK) cells, and γ-δ T cells (Figure 2B), expressing markers of terminally differentiated effector T-helper type 1 subtype T cells (Figure 2C-D). Cells were positive for activation markers CD38 and CD56 but negative for CD25 and CD137. Cells were positive for T-cell immunoglobulin and mucin domain–containing protein 3 but negative or low for other coinhibitory molecules including programmed death ligand 1, programmed cell death protein 1, and lymphocyte activation gene 3 (Figure 2E).
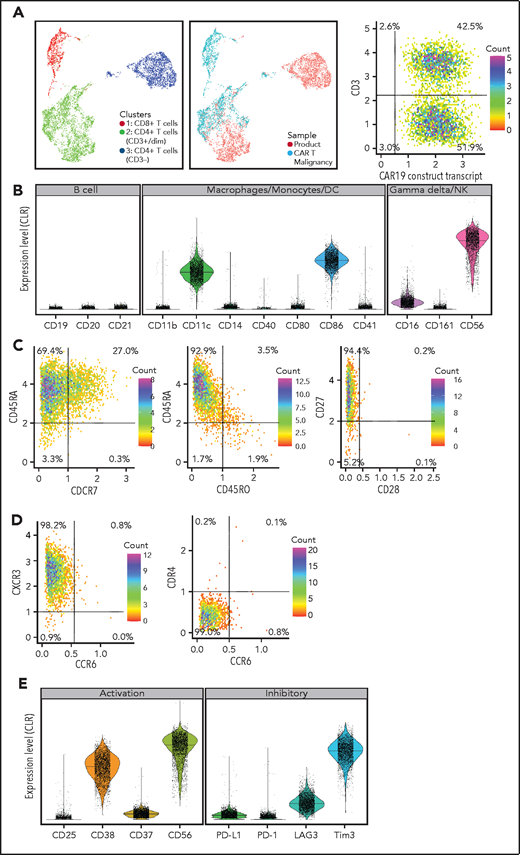
Immunophenotype of malignant CAR T cells. (A) UMAP plots comparing phenotype of the donor-derived CAR T-cell product and malignant CAR T cells: (left) combined plot showing CD3+CD4−CD8+ (cluster 1, red dots), CD3+CD4+CD8− (cluster 2, green dots), and CD3−CD4+CD8− (cluster 3, blue dots) cells; (middle) plot showing differences in CD4, CD8, and CD3 expression between malignant CAR T cells (aquamarine dots falling in cluster 2 and cluster 3) and the donor-derived product (red dots falling in cluster 1 and 2); and (right) expression of the CAR19 transcript of CD3+ and CD3− cells (dot plot). (B) Expression of lineage markers on malignant cells including B cells, macrophages, monocytes, dendritic cells (DC), NK cells, and γ-δ T cells. (C) T-cell memory, (D) T-helper subtype, and (E) activation and inhibitory molecule expression of malignant T cells. CLR, centered log ratio.
Immunophenotype of malignant CAR T cells. (A) UMAP plots comparing phenotype of the donor-derived CAR T-cell product and malignant CAR T cells: (left) combined plot showing CD3+CD4−CD8+ (cluster 1, red dots), CD3+CD4+CD8− (cluster 2, green dots), and CD3−CD4+CD8− (cluster 3, blue dots) cells; (middle) plot showing differences in CD4, CD8, and CD3 expression between malignant CAR T cells (aquamarine dots falling in cluster 2 and cluster 3) and the donor-derived product (red dots falling in cluster 1 and 2); and (right) expression of the CAR19 transcript of CD3+ and CD3− cells (dot plot). (B) Expression of lineage markers on malignant cells including B cells, macrophages, monocytes, dendritic cells (DC), NK cells, and γ-δ T cells. (C) T-cell memory, (D) T-helper subtype, and (E) activation and inhibitory molecule expression of malignant T cells. CLR, centered log ratio.
Malignant CAR T cells fail to expand in response to CD19 in vitro
To determine whether the malignant CAR T-cell proliferation could have been driven by CAR engagement with persistent B-cell malignancy in the patient, we assessed their expansion in response to CD19 antigen and compared this to nonmalignant CAR T cells isolated from the peripheral blood taken at the time of biopsy. Irradiated healthy donor peripheral blood mononuclear cells (PBMCs) were used as a source of CD19 as per original CAR T-cell production.12,13 Peripheral blood CAR T cells expanded 731-fold over 4 weeks, compared with only threefold expansion of tumor CAR T cells, with reduced viability compared with blood CAR T cells (Figure 3A).
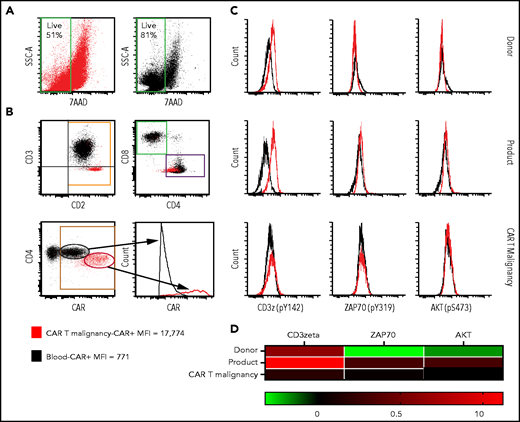
Flow cytometry assessment of cell-surface CAR expression in cultured malignant CAR T cells and assessment of basal activation of unstimulated malignant CAR T cells. (A) Viable cells in stimulated tumor-derived malignant CAR T-cell cultures (red) compared with blood-derived CAR T cells (black) at the end of 4-week culture. (B) Cultured tumor-derived CD3−, CD2high, CD4low malignant CAR T cells (red dots) showing high CAR expression compared with the mixed CD4+ and CD8+, CD3+ CAR T cells expanded from the peripheral blood (black dots) over 2 weeks. (C) Histograms showing phosphorylation levels of mediators of activation in unstimulated CD4+ T cells from untransduced donor PBMC (donor, top row), the CAR T-cell product (product, middle row), and directly isolated malignant CAR T cells (CAR T malignancy, bottom row). Histograms from samples stained with the phosphor-specific antibody (red lines) were compared with fluorescence minus one (FMO) samples (black lines) stained with surface antibodies only. (D) Heat map of relative phosphorylation status of CD3ζ, ZAP70, and AKT in different conditions corrected for autofluorescence using the resolution metric (RD), where RD = (MFIstained − MFIFMO)/(rSDstained + rSDFMO). MFI, median fluorescent intensity; rSD, robust standard deviation; SSC-A, side scatter area.
Flow cytometry assessment of cell-surface CAR expression in cultured malignant CAR T cells and assessment of basal activation of unstimulated malignant CAR T cells. (A) Viable cells in stimulated tumor-derived malignant CAR T-cell cultures (red) compared with blood-derived CAR T cells (black) at the end of 4-week culture. (B) Cultured tumor-derived CD3−, CD2high, CD4low malignant CAR T cells (red dots) showing high CAR expression compared with the mixed CD4+ and CD8+, CD3+ CAR T cells expanded from the peripheral blood (black dots) over 2 weeks. (C) Histograms showing phosphorylation levels of mediators of activation in unstimulated CD4+ T cells from untransduced donor PBMC (donor, top row), the CAR T-cell product (product, middle row), and directly isolated malignant CAR T cells (CAR T malignancy, bottom row). Histograms from samples stained with the phosphor-specific antibody (red lines) were compared with fluorescence minus one (FMO) samples (black lines) stained with surface antibodies only. (D) Heat map of relative phosphorylation status of CD3ζ, ZAP70, and AKT in different conditions corrected for autofluorescence using the resolution metric (RD), where RD = (MFIstained − MFIFMO)/(rSDstained + rSDFMO). MFI, median fluorescent intensity; rSD, robust standard deviation; SSC-A, side scatter area.
Unstimulated malignant CAR T cells do not possess tonic CAR signaling
Expanded CD3−CD4+ CAR T cells from the biopsy expressed high levels of CAR compared with those from the peripheral blood (mean fluorescence intensity, 17c774 in tumor and 771 from blood CAR T cells) (Figure 3B), raising the possibility of tonic CAR signaling. However, there was no increase in phosphorylated CD3ζ, ζ-associated protein of 70 kDa (ZAP70), and AKT34 in unstimulated, directly isolated malignant CAR T cells compared with CD4+ CAR T cells from the product or untransduced sibling donor T cells (Figure 3C-D).
Malignant CAR T cells do not contain transgene insertion into typical oncogenes
To determine whether integration of the transgene into known oncogenes may have led to malignant transformation, insertion site analysis was performed on malignant CAR T cells, the CAR T-cell product, and 7 other products manufactured using the same methodology. As the malignant CAR T cells were monoclonal, whole-genome sequencing was used to verify insertion sites.
The malignancy contained inserts within 2.5 kb of transcriptional start sites and within genes themselves on 3 and 11 occasions, respectively, but no insertions into exons or into traditional oncogenes in the Catalogue Of Somatic Mutations In Cancer (COSMIC) database (Table 1).35
Integration sites within the malignant CAR T cells and their effect on expression of surrounding genes in patient 2
| Insert mapping | Genomic context and RNA sequencing | |||||
|---|---|---|---|---|---|---|
| Chromosome | Insert site* | Strand† | Transcriptional shadow,‡ kbp | Gene same strand within shadow§ | Observed Log2 FC,‖ malignancy CPM vs ProductCPM | In silico evidence of functional product# |
| chr1 | 26c145c520 | + | 18 | FAM110D | 7.01 | FAM110D |
| chr1 | 53c455c616 | + | 25 | DMRTB1 | 12.20 | |
| chr1 | 154c760c298 | + | 50 | |||
| chr1 | 184c030c856 | + | 60 | TSEN15 | 0.66 | |
| chr1 | 208c989c499 | − | 450 | |||
| chr1 | 214c453c094 | + | 40 | |||
| chr2 | 57c195c660 | + | 50 | |||
| chr2 | 62c309c188 | − | 40 | |||
| chr3 | 99c637c483 | + | 100 | COL8A1 | 9.72 | COL8A1 |
| chr3 | 111c596c609 | + | 0 | |||
| chr5 | 49c702c91 | + | 120 | LINC01020 | 8.00 | |
| chr6 | 12c023c195 | + | 120 | HIVEP1 | 2.98 | HIVEP1 |
| chr6 | 35c678c292 | + | 50 | ARMC12 | 2.99 | |
| chr6 | 90c251c539 | − | 50 | BACH2 | −0.17 | |
| chr6 | 111c857c020 | − | 100 | FYN | 3.14 | FYN |
| chr6 | 141c455c746 | + | 40 | |||
| chr7 | 7c259c055 | + | 110 | LOC101927354 | 5.93 | |
| chr7 | 83c404c188 | + | 50 | |||
| chr7 | 143c289c731 | + | 0 | |||
| chr8 | 70c401c154 | − | 100 | NCOA2 | 1.05 | |
| chr9 | 36c557c687 | + | 100 | MELK | 1.30 | |
| chr10 | 108c310c155 | − | 1000 | LINC01435*** | 11.07 | |
| chr12 | 57c836c644 | + | 100 | |||
| chr21 | 19c588c904 | + | 100 | |||
Insertion sites within the genome, size of transcriptional shadow, and impact on exonic expression of surrounding genes are shown. CAR19 insertions in the malignancy were detected by μ insertion analysis and confirmed on whole-genome sequencing by searching alignment files for paired-end split reads between the CAR19 “contig” and regions of the autosomes, excluding calls that did not indicate a full-length insertion of CAR19. Transcriptional shadow was directly visualized using the Integrative Genomics Viewer - Broad Institute. Expression of genes within the transcriptional shadow and on the same strand was evaluated based on total exon counts, and functional impact of intronic insertion sites was estimated by determining whether missing exons interrupted the ORF based on gene annotation. If open reading frame interruption was seen, in silico translation of the spliced product was performed (expasy.org) and compared with the wild-type (WT) protein sequence (www.ebi.ac.uk/Tools/msa/clustalo/). If the resultant sequence retained the WT sequence (in-frame deletion), functional domains (uniprot.org) were evaluated to estimate the likelihood of the altered product retaining activity.
chr, chromosome; FC, fold change; MalignancyCPM, counts per million in malignant T cells; ProductCPM, counts per million in CD4 CAR T cells from the product.
Insert site indicates the nucleotide position of the insert on the chromosome.
Strand (+ or −) indicates the orientation of the transgene.
Transcriptional shadow indicates the presence and length of transcriptional readthrough seen in kilobase pairs as directly visualized in IGV.
Gene same strand within shadow indicates the name of genes potentially impacted by the transcriptional readthrough seen.
Observed Log2FC is the total increase in transcription within the gene affected by the transcriptional shadow including exonic, intronic, and out-of-frame sequences compared with the CAR T-cell product expressed as log2 fold change.
In silico evidence of functional product indicates genes with increased functional protein compared with the CAR T-cell product based on splicing analysis.
LINC01435* is long noncoding RNA not associated with malignancy.
The slight enrichment of oncogenes in the product of patient 2 compared with a statistically random distribution throughout the genome (Figure 4A-B) was similar to previous data comparing piggyBac to retroviral and lentiviral vector insertion profiles36-38 (Figure 4B). None of these traditional oncogenes were seen in the malignant CAR T cells.
![Pattern of integration in piggyBac-derived products administered to patients. (A) Distribution of total unique integration sites in 5 individual CARTELL trial (patients 1-3, 7, and 8) and 3 compassionate access (patients 4-6) products showing a similar insertion pattern in the product of patient 2 (within genes, 63%; exons, 5%; introns, 62%; promoters, 18%; cytosine guanine dinucleotide [CpG] islands, 1%; intergenic regions, 37%; and oncogenes, 9%) compared with the mean of other products (within genes, 65%; exons, 4%; introns, 61%; promoters, 15%; CpG islands, 1%; intergenic regions, 35%; and oncogenes, 7%). All products were from healthy stem cell transplant donors. (B) Distribution of CAR gene insertions in CAR T-cell products and published data sets (denoted with an asterisk in the image) for lentivirus, piggyBac, and retrovirus37 compared with a statistically random distribution throughout the genome. The departure from an expected random distribution is indicated by the colored tile, with red denoting enrichment compared with random and blue indicating depleted compared with random. Note: Products administered to patients subsequently developing CAR T-cell malignancies (2 and 8) are highlighted in red lettering. The COSMIC database was accessed at https://cancer.sanger.ac.uk/cosmic/download.](https://ash.silverchair-cdn.com/ash/content_public/journal/blood/138/16/10.1182_blood.2021010858/2/m_bloodbld2021010858f4.png?Expires=1769080419&Signature=QVX4wDVq-PeFaGm~TVqzqdSr72hnmEsNbGR2TXxy023umKhbHpOfRSX5-GgmHEFE8Ax8n71yJ2JuRRlPFw~niPAWHIqqCk~x1XvGWNeXxSepshAUu2JxVXXVJp~ztyGxVC-fUDdg7wSio-Vwimy7JniT7Sc2ISMIz4ELHI1eu~AIZ2mH3tLe4wKRd57dry94q5zd3kn9XLkTeXUqS~v0brGtxyx4AoA6vwEMtOLGw2zWUp9prsVQHx-5Q9owRDFd6fZWABTyVfrnSHXSCsfNFiJKreGXLYklclNM1SgcfQ8RUIomwJGrx4JKj3uUDz81OnB3SNz0Cd4Mly3V9wpZog__&Key-Pair-Id=APKAIE5G5CRDK6RD3PGA)
Pattern of integration in piggyBac-derived products administered to patients. (A) Distribution of total unique integration sites in 5 individual CARTELL trial (patients 1-3, 7, and 8) and 3 compassionate access (patients 4-6) products showing a similar insertion pattern in the product of patient 2 (within genes, 63%; exons, 5%; introns, 62%; promoters, 18%; cytosine guanine dinucleotide [CpG] islands, 1%; intergenic regions, 37%; and oncogenes, 9%) compared with the mean of other products (within genes, 65%; exons, 4%; introns, 61%; promoters, 15%; CpG islands, 1%; intergenic regions, 35%; and oncogenes, 7%). All products were from healthy stem cell transplant donors. (B) Distribution of CAR gene insertions in CAR T-cell products and published data sets (denoted with an asterisk in the image) for lentivirus, piggyBac, and retrovirus37 compared with a statistically random distribution throughout the genome. The departure from an expected random distribution is indicated by the colored tile, with red denoting enrichment compared with random and blue indicating depleted compared with random. Note: Products administered to patients subsequently developing CAR T-cell malignancies (2 and 8) are highlighted in red lettering. The COSMIC database was accessed at https://cancer.sanger.ac.uk/cosmic/download.
Pattern of integration in piggyBac-derived products administered to patients. (A) Distribution of total unique integration sites in 5 individual CARTELL trial (patients 1-3, 7, and 8) and 3 compassionate access (patients 4-6) products showing a similar insertion pattern in the product of patient 2 (within genes, 63%; exons, 5%; introns, 62%; promoters, 18%; cytosine guanine dinucleotide [CpG] islands, 1%; intergenic regions, 37%; and oncogenes, 9%) compared with the mean of other products (within genes, 65%; exons, 4%; introns, 61%; promoters, 15%; CpG islands, 1%; intergenic regions, 35%; and oncogenes, 7%). All products were from healthy stem cell transplant donors. (B) Distribution of CAR gene insertions in CAR T-cell products and published data sets (denoted with an asterisk in the image) for lentivirus, piggyBac, and retrovirus37 compared with a statistically random distribution throughout the genome. The departure from an expected random distribution is indicated by the colored tile, with red denoting enrichment compared with random and blue indicating depleted compared with random. Note: Products administered to patients subsequently developing CAR T-cell malignancies (2 and 8) are highlighted in red lettering. The COSMIC database was accessed at https://cancer.sanger.ac.uk/cosmic/download.
Transgene copy number per cell in the malignancy was higher than expected at 24, but was not higher than nonmalignant CD4+ CAR T cells from the product (29.8) or peripheral blood (27.6).
Whole-genome sequencing does not reveal enrichment of any class of SVs
The landscape of SVs and their intersections were characterized within genomic DNA extracted from untransduced CD4+ donor T cells, and CD4+ CAR T cells from the product administered to patient 2, his peripheral blood and malignant CAR T cells (Figure 5A). The largest set of events was observed in all samples, representing 34% of SVs called (2856 of 8366). Each sample contained several hundred unique SVs, and their types, lengths, and genomic annotations reveal general consistency, with no enrichment of any class of variant in the malignant cells (Figure 5B).
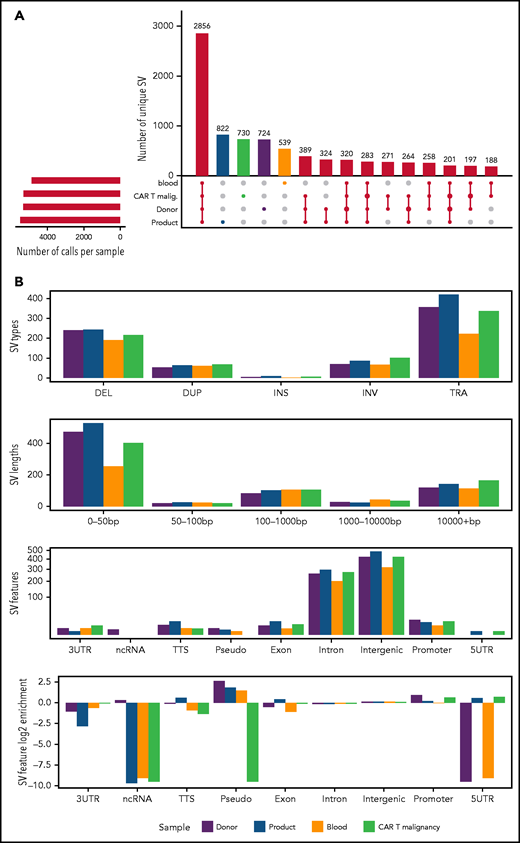
SVs across whole-genome-sequenced samples. (A) UpSet plot showing the intersection of SV calls across DNA extracted from CD4+ T cells isolated from untransduced healthy donor T cells (donor), CD4+ CAR T cells from the CAR T-cell product (product), expanded from patient 2’s peripheral blood (blood) and directly isolated from the malignancy (CAR T Malignancy). SVs detected uniquely within each sample are shaded in colors, maintained throughout the figure. On the bottom left is the number of calls per sample; intersections between samples (black) are shown by connecting bars in the lower right plot. (B) Distribution of SVs called uniquely for each sample, including SV type (3UTR, 3′ untranslated region; 5UTR, 5′ untranslated region; DEL, deletion; DUP, duplication; INS, insertion; INV, inversion; ncRNA, noncoding RNA; pseudo, pseudogene; TRA, translocation; TTS, triplex target DNA site), the length of each SV, and the genomic annotation per SV.
SVs across whole-genome-sequenced samples. (A) UpSet plot showing the intersection of SV calls across DNA extracted from CD4+ T cells isolated from untransduced healthy donor T cells (donor), CD4+ CAR T cells from the CAR T-cell product (product), expanded from patient 2’s peripheral blood (blood) and directly isolated from the malignancy (CAR T Malignancy). SVs detected uniquely within each sample are shaded in colors, maintained throughout the figure. On the bottom left is the number of calls per sample; intersections between samples (black) are shown by connecting bars in the lower right plot. (B) Distribution of SVs called uniquely for each sample, including SV type (3UTR, 3′ untranslated region; 5UTR, 5′ untranslated region; DEL, deletion; DUP, duplication; INS, insertion; INV, inversion; ncRNA, noncoding RNA; pseudo, pseudogene; TRA, translocation; TTS, triplex target DNA site), the length of each SV, and the genomic annotation per SV.
Somatic sequence variants and copy-number changes in malignant CAR T cells detected by targeted NGS
NGS targeting genes recurrently mutated in hematological malignancies was performed on DNA extracted from malignant CAR T cells, CAR T cells expanded from the patient’s peripheral blood, the product, and untransduced donor T cells as previously described.16 An acquired nonsense mutation in PIGA (Glu264*) in malignant CAR T cells alone was detected. In addition, numerous copy-number changes were detected in malignant CAR T cells including copy-number gains involving chromosomal regions on 1q, 4q, 5, 6, 10q, 11q, and 17q and copy-number losses involving regions on 4q and 17p.
Malignant CAR T cells display marked transcriptional changes
To determine whether the insertion sites or somatic mutations identified could be directly related to the development of the CAR T-cell malignancy, examination for global, insertion, and SV-related transcription changes was performed using whole-transcriptome analysis. Directly isolated malignant CAR T cells were compared with flow cytometry–sorted CD4+ CAR T cells expanded from peripheral blood from patient 2, the product, and untransduced CD4+ T cells from the peripheral blood of 3 healthy donors including the sibling donor of patient 2.
Multidimensional scaling of gene-expression profiles showed distinct clusters of the untransduced donor T cells, and the nonmalignant CAR T cells, and marked global differences with the malignant CAR T cells.
Genes with fourfold altered expression in malignant T cells compared with donor CD4+ CAR T cells from the product (584 genes) or untransduced healthy donor CD4+ T cells (1414 genes) and an additional 915 genes with fourfold differential expression in donor CD4+ CAR T cells compared with untransduced healthy donor CD4+ T cells were further analyzed (Figure 6A; supplemental Excel file). Gene ontologies enriched in this 3-way comparison showed distinct clusters of upregulated genes in the CAR T-cell malignancy (Figure 6A-B; supplemental Excel file) associated with primitive embryonic development and cell-cell adhesion (Figure 6B,F), whereas downregulated genes were associated with regulation of cell adhesion, T-cell activation, and activation of phospholipase C (Figure 6B).
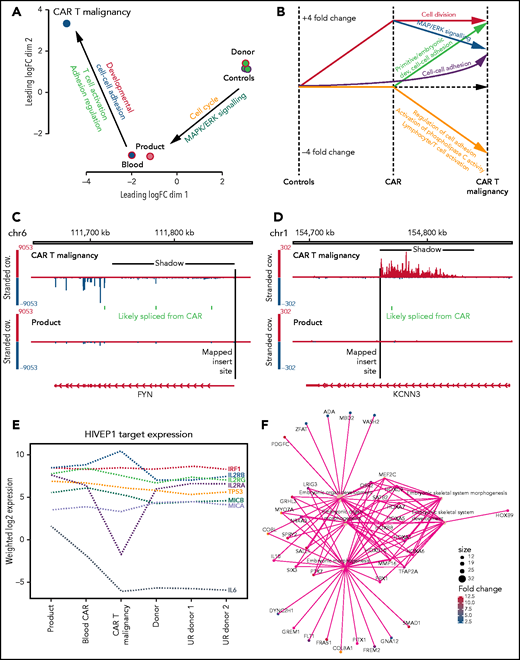
Transcription analysis of malignant CAR T cells compared with nonmalignant CAR+ and untransduced T cells. (A) Multidimensional scaling of global gene expression from malignant CAR T cells (CAR T malignancy), nonmalignant CD4+ CAR T cells from the peripheral blood (Blood) and product (Product) and 3 untransduced healthy donor CD4+ T cells (Donor Controls). (B) Line drawing showing fourfold differential expression of clusters of genes in the malignant CAR T cells (CAR T malignancy) compared with CD4+ T cells from the CAR T-cell product (CAR) and untransduced related healthy donor T cells (Controls). (C) Examples of transcriptional readthrough/shadow seen in the malignant CAR T cells at the point of insertion in the FYN gene producing increased negative strand exonic expression and (D) transcriptional readthrough at the point of insertion in the KCNN3 gene showing no increase in exonic expression as visualized using the IGV.28 (E) Relative levels of expression of genes identified in hg38 using PWMtools69 as containing the HIVEP1-binding motif (KGGGAAATCCCn) in promoter/enhancer regions in CAR+ CD4+ T cells isolated from the product, expanded from the peripheral blood (Blood CAR), malignant CAR T cells (CAR T malignancy), as well as untransduced CD4+ T cells from the sibling donor (Donor) and unrelated healthy donors (UR donor 1, UR donor 2). (F) Example of primitive embryonic gene-ontology clusters seen to be increased in the malignant CAR T cells compared with both product and untransduced donor CD4+ T cells.
Transcription analysis of malignant CAR T cells compared with nonmalignant CAR+ and untransduced T cells. (A) Multidimensional scaling of global gene expression from malignant CAR T cells (CAR T malignancy), nonmalignant CD4+ CAR T cells from the peripheral blood (Blood) and product (Product) and 3 untransduced healthy donor CD4+ T cells (Donor Controls). (B) Line drawing showing fourfold differential expression of clusters of genes in the malignant CAR T cells (CAR T malignancy) compared with CD4+ T cells from the CAR T-cell product (CAR) and untransduced related healthy donor T cells (Controls). (C) Examples of transcriptional readthrough/shadow seen in the malignant CAR T cells at the point of insertion in the FYN gene producing increased negative strand exonic expression and (D) transcriptional readthrough at the point of insertion in the KCNN3 gene showing no increase in exonic expression as visualized using the IGV.28 (E) Relative levels of expression of genes identified in hg38 using PWMtools69 as containing the HIVEP1-binding motif (KGGGAAATCCCn) in promoter/enhancer regions in CAR+ CD4+ T cells isolated from the product, expanded from the peripheral blood (Blood CAR), malignant CAR T cells (CAR T malignancy), as well as untransduced CD4+ T cells from the sibling donor (Donor) and unrelated healthy donors (UR donor 1, UR donor 2). (F) Example of primitive embryonic gene-ontology clusters seen to be increased in the malignant CAR T cells compared with both product and untransduced donor CD4+ T cells.
Malignant CAR T cells show transgene promoter–driven transcriptional readthrough
Alterations in transcription were analyzed to determine whether the CAR insertions had directly impacted expression of surrounding genes and how that might relate to global changes in transcription. Despite the presence of insulator sequences around the CAR transgene, RNA levels surrounding insertion sites showed transcriptional readthrough extending from the 3′ end of the transgene affecting the forward or reverse strand depending on the direction of insertion (Figure 6C-D). This “transcriptional shadow” extended for up to 1000 kb including noncoding intronic and out-of-frame sequences. Analysis of levels of in-frame, exonic sequences showed increased expression of 4 genes: FAM110D, COL8A1, HIVEP1, and FYN (Table 1). Of these, HIVEP1 and FYN could be assessed for direct impact on the transcriptional changes in the malignant cells. Genes that have the HIVEP1-binding motif within a 3-kb promoter window were not overexpressed in the malignant cells (Wilcoxon rank-sum P > .05) compared with other samples (binomial test > 0.05) (Figure 6E). Pathway analysis confirmed changes in primitive development clusters (Figure 6F) but did not reveal changes in gene expression linked to FYN except for the downregulation of the TCR activation pathway (as seen in KEGG; supplemental Figure 1).
Genomic copy-number changes have a dominant influence on malignant CAR T-cell gene expression
Genome-wide expression changes between malignant CAR T cells and product were associated with copy-number gains and losses (Wilcoxon rank-sum P < 1e-16; Figure 7). Furthermore, overexpressed (more than fourfold) genes in the malignant cells compared with product or untransduced cells were more than twofold enriched at regions with increased copy number (odds ratio = 2.19; P < .0001). In contrast, genomic regional clusters of differentially expressed genes did not correspond to any insertion site.

Correlation of insertion site and gene expression in CAR T-cell malignancy and infused CAR T-cell product. (A) Circos plot produced using the circlize package70 showing the changes found in the malignant CAR T cells related to individual chromosomes (Coordinates and Banding) including: CAR transgene insert sites (lines at each genomic position); SV density (gray density plot); genetic copy-number variation (red bars, increased; blue bars, reduced copy numbers); contiguous regions of the genome containing more differentially expressed genes (DEG) than expected by chance (Enriched for DEG, purple bars) defined using a binomial test for DE vs non DE over 10 Mbp windows (adjusted P < .05); all DEG with log-fold change (logFC) (Malignancy vs product) of >4 (DEG Expr) (logFC, adjusted P < .05) plotted at their genome coordinates (green, up; blue, down); and overall levels of gene expression (All Gene Exp Dens), with all genes binned as overexpressed (red density plot) or underexpressed (blue density plot) in malignancy vs product (logFC > or < 0) with gene density plotted as a function of distance over the genome. (B) Correlation between copy-number variation and altered gene expression showing correlation between copy-number gain and increased gene expression (blue box) in the malignant CAR T cells (Malignancy) compared with CAR+CD4+ T cells isolated from the product. ***P < .0001.
Correlation of insertion site and gene expression in CAR T-cell malignancy and infused CAR T-cell product. (A) Circos plot produced using the circlize package70 showing the changes found in the malignant CAR T cells related to individual chromosomes (Coordinates and Banding) including: CAR transgene insert sites (lines at each genomic position); SV density (gray density plot); genetic copy-number variation (red bars, increased; blue bars, reduced copy numbers); contiguous regions of the genome containing more differentially expressed genes (DEG) than expected by chance (Enriched for DEG, purple bars) defined using a binomial test for DE vs non DE over 10 Mbp windows (adjusted P < .05); all DEG with log-fold change (logFC) (Malignancy vs product) of >4 (DEG Expr) (logFC, adjusted P < .05) plotted at their genome coordinates (green, up; blue, down); and overall levels of gene expression (All Gene Exp Dens), with all genes binned as overexpressed (red density plot) or underexpressed (blue density plot) in malignancy vs product (logFC > or < 0) with gene density plotted as a function of distance over the genome. (B) Correlation between copy-number variation and altered gene expression showing correlation between copy-number gain and increased gene expression (blue box) in the malignant CAR T cells (Malignancy) compared with CAR+CD4+ T cells isolated from the product. ***P < .0001.
Seventy-two of the SVs detected on whole-genome sequencing (10%) that were unique to the malignant CAR T cells were near differentially expressed genes; however, all but 2 of these were intergenic, repeats, or intronic. A 1.3-kbp inversion involving the promoter of IFITM2 and a 76-kbp deletion of the transcriptional termination region of LRRN3 were associated with profound downregulation (−8 log-fold change and −12 log-fold change, respectively) but neither were near an insertion site and neither genes are associated with lymphoma.
This indicates that the transcriptional impact of transgene insertion and (in the majority of cases) SVs did not contribute significantly to the changes in genome-wide differential expression observed in malignant cells. The dominant driver of this differential expression is most likely due to copy-number variation and this potentially explains the disconnect between insertion sites, SVs, and global gene expression, obscuring that of potential insertion or mutation-related changes.
Discovery of a second CAR T-cell malignancy and initial analysis
All trial patients were notified and screened for lymphoma by PET scan. Patient 8, a 31-year-old man, was found to have an asymptomatic mediastinal tumor and cervical lymphadenopathy 12 months post-CAR T cells. A biopsy revealed a CD3−, CD2+, CD8+ monoclonal CAR T-cell infiltrate. The tumor was chemotherapy responsive, and the patient is in remission after a second allogeneic HSCT.
Experiments were repeated on tumor samples from patient 8, and showed a smaller number of integrants (4), with similar readthrough as seen in the first patient, but lack of increased in silico expression of any gene (supplemental Table 2; supplemental Figure 4). There was transgene-mediated increased expression of a noncoding RNA on chromosome 1 (LOC107985043) of uncertain function and significance. In both malignancies, there was insertion into an intron of the BACH 2 locus on chromosome 6 (intron 3 and 4 in patients 2 and 8, respectively). Unlike in patient 2, whole-genome sequencing revealed a marked increase in SVs compared with untransduced and nonmalignant CAR T cells, however, like patient 2, there was no enrichment of any particular class of variant (supplemental Figure 5). There was reduced expression of clusters of genes associated with T-cell activation and increased expression of clusters of genes associated with cell division, extracellular matrix and motility. However, there was no enrichment for genes controlling embryonic development (supplemental Figure 4). Overall changes in transcription once again correlated most strongly with alteration in genomic copy-number variation (supplemental Figure 4).
Discussion
We identified monoclonal CAR T-cell malignancies in 2 patients, leading to the death of 1 patient receiving CAR19 T cells manufactured from healthy HSCT donors using the piggyBac transposon system. Although the clinical findings bear a superficial analogy to T-cell malignancies seen in early gene therapy trials with retroviral vectors,3,4 investigations show no integration of the transgene into known oncogenes and a unifying underlying pathogenic mechanism could not be definitively identified. The malignant cells failed to expand in vitro even after stimulation with CD19 antigen, suggesting that signaling through increased CAR19 copies was not responsible for the cell proliferation. We cannot exclude responsiveness to other antigens such as alloantigens or infectious antigens that may have been present only in vivo. No clear oncogenic driver sequence variant abnormalities were detected using targeted NGS; however, widespread copy-number gains and losses were observed involving oncogenes and tumor-suppressor genes, respectively. These copy-number variations were not detected with whole-genome sequencing due to the insensitivity of SV callers to interspersed duplications.39-41
Transgene promoter activity caused increased transcription of surrounding genes, which was not expected as the cassette includes 5′ and 3′ insulator sequences.42 The transcriptional shadow identified enhanced expression of 4 genes in patient 2, of which one, FYN, is an Src family tyrosine kinase involved in cell growth, proliferation, and adhesion. FYN is a proximal component of TCR-mediated T-cell activation43 and activating mutations have been seen in adult T-cell leukemia and lymphoma.44 None of the other 3 genes, FAM110D, COL8A1, or HIVEP1, have been associated with hematological malignancies, although COL8A1 expression has been seen with progression of solid tumors.45,46 Although overexpression of FYN is a prime candidate for the initial driver of malignant transformation in patient 2, KEGG analysis of FYN and T-cell receptor activation pathways showed neutral or downregulation of downstream mediators of T-cell activation (supplemental Figure 1) and phosphorylation of CD3z was not increased in the tumor (Figure 3) as would be expected with increased FYN activity. The initiating event may possibly have been FYN overexpression with consequent downregulation of other mediators of activation to maintain cellular homeostasis, with subsequent mutational changes such as copy-number variation occurring due to FYN-driven proliferation; but FYN also plays a role in programmed cell death protein 1–mediated T-cell inhibition,47 reducing this as a likely mechanism. Transgene integration into introns and reduced expression of BACH2 occurred in both malignancies, making this another gene for further consideration. BACH2 is a transcription factor that promotes regulatory T-cell development and suppresses T-cell activation and differentiation.48 Although not expected to interrupt gene expression, the intronic insertions may have led to reduced BACH2 expression, permitting persistent, excessive activation and proliferation with subsequent malignant changes. However, BACH2 expression is physiologically reduced with differentiation of T cells consistent with the levels seen in both tumors; these alterations may therefore be secondary. Overexpression of BACH2 in DLBCL is associated with poor prognosis,49,50 but changes in expression have not been described in the development of T-cell malignancies, including those associated with retroviral gene therapy. This is despite BACH2 being a recurrent insertion site for retroviruses,51-53 suggesting that BACH2 integration is unlikely to be playing a role in malignant behavior.
Until now, mature T cells transduced with viral vectors have been resistant to mutagenesis.7,54 No cases of secondary malignancies have been reported in hundreds of patients who have received virally transduced CAR T cells for treatment of HIV55 or B-cell malignancies over the last 2 decades. Despite transgene-mediated dysregulation of gene expression, long-term engrafted retrovirally gene-marked T cells have stable genotype, phenotype, and function without malignant behavior.56 Two prior reports have described clonal expansion in patients receiving CAR T cells produced using lentiviral vectors. In 1 case, clonal expansion was associated with insertion into the TET2 gene, whereas in the other there was a single transgene insertion into the CBL gene. In contrast to our cases, neither clonal population manifested clinically malignant behavior, which in the former case may have been therapeutically beneficial. Examination of clonality of lentiviral CAR19 T cells administered to 10 patients performed by Sheih et al has shown that dominance of oligoclonal populations is common, but independent of particular insertion sites.57
Although the development of a T-cell malignancy in these 2 patients raises safety concerns, our findings cannot necessarily be extrapolated to all production methodologies utilizing the piggyBac or other transposon systems. Using different production processes, other groups have not seen any suggestion of malignant transformation with piggyBac CAR T cells in preclinical work10,12,13,36,37,58-60 and up to 2 years of follow-up in patients receiving a B-cell maturation antigen–specific CAR T cell for multiple myeloma.61,62
The occurrence of 2 CAR T-cell malignancies suggests that our production methodology is the predominant factor in malignant transformation. Unique aspects of our method include the electroporation device and settings (with a single high-voltage pulse), concentration of transposon and transposase, and expansion with irradiated PBMCs and interleukin 15 (IL-15; described in supplemental Methods). Studies aimed at determining whether the high-electroporation voltages or high nuclear levels of transposase in particular could mediate nonspecific DNA damage will be especially important. Preclinical assessment of safety relied on data demonstrating a favorable integration profile compared with other transposon and viral vectors, normal cytogenetics, and no antigen-independent proliferation over several months of culture in vitro or in vivo.13 We were also reassured by others’ data36,59 and by mature T cells appearing to be resistant to transformation. We did not specifically assess readthrough in our preclinical studies, using the EF1a promoter seen to be safe in lentiviral CAR T-cell trials even in the absence of insulators1,63,64 and the previously well-characterized core CHS4 insulator.65-67 Although we hypothesize that the transgene-mediated transcriptional readthrough played a role in the pathogenesis of the CAR T-cell malignancies, readthrough has been described as a secondary feature of de novo malignancy68 and further studies are planned including analysis of single-cell clones to assess its frequency in nonmalignant piggyBac CAR T cells.
We will also attempt to recapitulate malignant transformation with potential mechanisms identified, such as overexpression of FYN or targeted integration of a transgene into BACH2 introns. Similar methods will be used to exclude alternative splicing of genes surrounding insertion sites related to a cryptic splice site in the CHS4 insulator as has previously been described with lentiviral vectors, but not demonstrated here.66 Given the high transgene copy number in 1 of the 2 malignancies, its contribution to transformation is uncertain. However, ensuring a copy number of 3 to 5 per transduced cell for future studies will reduce this as a risk. As we have observed that transposon-based CAR T cells with less than 5 copies per cell display robust tumor-specific function in vitro and in vivo (G.S., D.J.G., K.G., K.P.M., unpublished data), manipulations to limit transduction efficiency would not be expected to impair efficacy.
Although the mechanism underlying the malignant behavior of the CAR T-cell clone is not fully established, as investigators we felt that releasing these preliminary data was important, to act as a caution for others exploring the translation of new gene-modification methodologies such as piggyBac for CAR T-cell production. The overarching reason for embarking on this work was the need to produce CAR T cells affordably and with capacity for more complex genetic circuits, which remains compelling. Hopefully, once a complete understanding of the mechanisms that have led to this malignancy has been reached and addressed, work using this system can cautiously resume.
Acknowledgments
This work was supported by the National Health and Medical Research Council of Australia (project grants 1102172 and 1121704) and by a translational program grant from Cancer Council NSW and the Cancer Institute NSW (TPG 19-01). E.B. is a NSW Cancer Institute Early Career Fellow. C.E.M. was supported by the Starr Cancer Consortium (I13-0052), the Pershing Square Sohn Cancer Research Alliance, the National Institutes of Health, National Cancer Institute (R01CA249054, P01CA214274), and Leukemia & Lymphoma Society (LLS) grants MCL7001-18, LLS 9238-16, and LLS-MCL7001-18.
Reagents for AbSeq immunophenotypic analysis were provided by BD Biosciences free of charge. BD Biosciences did not provide any restrictions on this work and did not have a role in the conceptualization, design, data collection, analysis, decision to publish, or preparation of the manuscript.
Authorship
Contribution: K.P.M. designed and oversaw the trial and experiments and wrote the manuscript; K.G., Z.L., J.A.S., and L.M. performed experiments and data analysis including cell culture, transcriptome, and genome sequencing; B.S.G. performed insertion site, transcriptome, and NGS analysis; M.A.M. assisted with experimental work and produced the figures; G.S. performed the insertion site data acquisition and analysis; L.E.C. oversaw the production of CAR T cells; D.C.B. assisted with patient care and trial oversight; R.H.Y.L., C.C., and F.L. performed the AbSeq analysis; J.F., M.M., F.J.S., and C.E.M. performed the whole-genome-sequencing analysis; P.B. performed the TCR clonality and NGS analysis; and D.J.G. and E.B. designed and oversaw the trial and experiments.
Conflict-of-interest disclosure: The authors declare no competing financial interests.
Correspondence: Kenneth P. Micklethwaite, Department of Haematology, Westmead Hospital, Hawkesbury Rd, Westmead, NSW 2145, Australia; e-mail: kenneth.micklethwaite@sydney.edu.au.
All data are available on request by contacting the corresponding author.
The online version of this article contains a data supplement.
There is a Blood Commentary on this article in this issue.
The publication costs of this article were defrayed in part by page charge payment. Therefore, and solely to indicate this fact, this article is hereby marked “advertisement” in accordance with 18 USC section 1734.

This feature is available to Subscribers Only
Sign In or Create an Account Close Modal