

Key Points
Biallelic inactivation of TP53 and CDKN2A/CDKN2B allows for BCR-dependent/costimulatory signal-independent proliferation of CLL cells.
BCR and CDK4/6 inhibitors display synergistic activity against RS models with genetic lesions in TP53 and CDKN2A/CDKN2B.

Abstract
B-cell receptor (BCR) signals play a critical role in the pathogenesis of chronic lymphocytic leukemia (CLL), but their role in regulating CLL cell proliferation has still not been firmly established. Unlike normal B cells, CLL cells do not proliferate in vitro upon engagement of the BCR, suggesting that CLL cell proliferation is regulated by other signals from the microenvironment, such as those provided by Toll-like receptors or T cells. Here, we report that BCR engagement of human and murine CLL cells induces several positive regulators of the cell cycle, but simultaneously induces the negative regulators CDKN1A, CDKN2A, and CDKN2B, which block cell-cycle progression. We further show that introduction of genetic lesions that downregulate these cell-cycle inhibitors, such as inactivating lesions in CDKN2A, CDKN2B, and the CDKN1A regulator TP53, leads to more aggressive disease in a murine in vivo CLL model and spontaneous proliferation in vitro that is BCR dependent but independent of costimulatory signals. Importantly, inactivating lesions in CDKN2A, CDKN2B, and TP53 frequently co-occur in Richter syndrome (RS), and BCR stimulation of human RS cells with such lesions is sufficient to induce proliferation. We also show that tumor cells with combined TP53 and CDKN2A/2B abnormalities remain sensitive to BCR-inhibitor treatment and are synergistically sensitive to the combination of a BCR and cyclin-dependent kinase 4 and 6 (CDK4/6) inhibitor both in vitro and in vivo. These data provide evidence that BCR signals are directly involved in driving CLL cell proliferation and reveal a novel mechanism of Richter transformation.
Introduction
Chronic lymphocytic leukemia (CLL) is a common B-cell malignancy characterized by the expansion and progressive accumulation of mature autoreactive B lymphocytes. Studies conducted over the past 15 to 20 years have provided compelling evidence that the disease is driven by a complex interplay of recurrent genetic defects and signals that the leukemic cells receive from the microenvironment.1,2 Among the latter, signals that the leukemic cells receive through the B-cell receptor (BCR) have proven to play a particularly important role in the pathogenesis of the disease.3 Evidence for this includes the frequent expression of BCRs with stereotyped structural properties, the strong correlation between the clinical course and the mutational status of the genes encoding for the immunoglobulin portion of the BCR, the high expression of BCR target genes in lymph node CLL cells, and, above all, the significant clinical activity of drugs that inhibit BCR signal transduction.4-10 Moreover, a recent study by our group showed that chronic autoantigen stimulation induces CLL in the Eμ-TCL1–transgenic mouse model, providing further in vivo evidence that BCR signals drive the expansion of the malignant cells.11
Despite the evidence supporting a major role for the BCR in the pathogenesis of CLL, the malignant B cells, unlike normal B cells, do not proliferate in vitro upon engagement of the BCR by external ligand. Instead, they can be induced to proliferate by other signals from the microenvironment, such as the Toll-like receptor (TLR) ligand cytosine guanine dinucleotide (CpG) DNA or the T-cell–derived combination of CD40L, interleukin 21 (IL-21), and IL-4.12-14 These data suggest that CLL cell proliferation is regulated by BCR-independent signals and that the BCR plays only an indirect role in this process, presumably by facilitating the recruitment, internalization, and/or processing of the proliferation signals. However, the rapid reduction in the percentage of proliferating leukemic cells in lymph node biopsies from patients with CLL or in spleens from Eμ-TCL1–transgenic mice treated with a Bruton tyrosine kinase (BTK) or SYK inhibitor suggests that the BCR may be more directly involved, at least in a subset of cases.15-20 In further support of this possibility, gene-expression and cell-cycle analyses have shown that stimulation of surface immunoglobulin M (IgM) induces an increase in the expression of the G1-phase cell-cycle regulators MYC, CCND2, and CDK4 and an increase in the percentage of CLL cells in the G1 phase of the cell cycle in samples from patients with poor prognostic features.21-23 However, no increase in the percentage of cells in the S phase of the cell cycle was observed,22 suggesting that the BCR can only provide the initial signal required for cell-cycle entry, whereas subsequent cell-cycle progression is driven by costimulatory signals.
To further understand the role of the BCR pathway in regulating CLL cell proliferation, we investigated in more detail the effects of BCR stimulation on the expression of cell-cycle regulators in human and murine CLL cells. Surprisingly, we observed that BCR stimulation induces not only the expression of positive regulators of the cell cycle, but also expression of the negative regulators CDKN1A and CDKN2B. This finding was interesting for 2 reasons: first, it provided a possible explanation for the inability of BCR signals to induce the entry of CLL cells into the S phase of the cell cycle and, second, it raised the possibility that certain genetic lesions associated with CLL progression may function by reducing the requirement for costimulatory signals in driving CLL proliferation. Such lesions most notably include deletions of the CDKN2A/2B locus and mutations/deletions of the CDKN1A regulator TP53, which co-occur in approximately one-quarter of cases with clonally related Richter syndrome (RS), an aggressive B-cell lymphoma arising from transformation of CLL B cells.24-26
To address the possibility that genetic lesions in CDKN2A/2B and TP53 cooperate with BCR signals in the pathogenesis of RS, we used clustered regularly interspaced short palindromic repeats (CRISPR)/CRISPR-associated protein 9 (Cas9) technology to simultaneously target the CDKN2A, CDKN2B, and TP53 genes in primary Eμ-TCL1–derived murine CLL cells expressing different autoreactive BCRs.11 We show that the genetically modified leukemia cells acquire the capacity to proliferate spontaneously in vitro but remain dependent on BCR signals.
Materials and methods
CLL samples
Blood samples were collected from CLL patients after obtaining informed consent according to the Declaration of Helsinki. Approval for the study was obtained from the institutional review board committee at Catholic University Hospital A. Gemelli (14563/15). CLL cells were purified, cultured, and stimulated with immobilized anti-IgM as described elsewhere.27 Ibrutinib, idelalisib, R406, and GS-9973 (all from Selleckchem), and palbociclib (kindly provided by Pfizer), were used as indicated in the figures or figure legends.
CRISPR/Cas9 editing of murine CLL cells
Murine CLL cells with autoreactive BCRs had previously been isolated from Eμ-TCL1–transgenic mice that had been backcrossed for >10 generations on a C57BL/6J background.11 Cells were thawed and cultured in RPMI 1640 supplemented with 10% heat-inactivated fetal bovine serum, 100 U/mL penicillin, 0.1 mg/mL streptomycin, 2 mM l-glutamine, 1 mM sodium pyruvate (Invitrogen), and 1 μM CpG-1668 (InvivoGen) at a concentration of 1 × 10⁷ cells per mL for 20 hours prior to CRISPR/Cas9 editing with the Alt-R system (Integrated DNA Technologies [IDT]). Predesigned crispr RNAs (cr-RNAs) were used for targeting the TP53, CDKN2A, CDKN2B, MGA, and MyD88 genes, whereas the immunoglobulin heavy constant μ (IGHM) cr-RNA was designed using the IDT web tool (https://eu.idtdna.com/site/order/designtool/index/CRISPR_CUSTOM). To generate the Cas9 ribonucleoprotein (RNP) complexes, the cr-RNAs (1.5 μM) were combined with 1.5 μM ATTO 550-labeled trans-activating cr-RNA, 0.75 μM recombinant Cas9 protein, and 1.5 μM Alt-R Cas9 electroporation enhancer in 5 μL of nuclease-free duplex buffer (IDT). Cas9 RNP complexes were then electroporated using the Amaxa Nucleofector II device and the Z-001 program into 5 × 10⁶ leukemic cells resuspended in 100 μL of mouse B-cell nucleofector solution (Lonza). Control cells were nucleofected with Cas9 RNPs without cr-RNA. Transfection efficiency was evaluated 3 hours after nucleofection by flow cytometry and ranged from 60% to 90% based on the percentage of ATTO 550–positive cells (supplemental Figure 1, available on the Blood Web site). Analysis of editing efficiency was performed on an aliquot of the nucleofected cells collected after 24 hours in culture and purified with the EasySep Mouse CD19 Positive Selection Kit II (StemCell Technologies). Editing efficiency was evaluated by amplicon capillary electrophoresis on a 3500 Genetic Analyzer (Applied Biosystems) of polymerase chain reaction (PCR) fragments spanning the region of genomic DNA around the targeted site.28 Editing efficiency was additionally analyzed by Sanger sequencing followed by analysis with the ICE v2 CRISPR tool (https://www.synthego.com/). cr-RNA and PCR primer sequences are provided in supplemental Tables 1-3.
In vivo adoptive transfer experiments
All animal procedures were performed under a protocol approved by the Italian Ministry of Health (no. 347/2017-PR). CRISPR/Cas9-edited Eμ-TCL1 leukemia cells were transferred by intraperitoneal injection in NSG or C57BL/6 mice immediately after the nucleofection without any prior sorting or antibiotic selection. Leukemia cell expansion was analyzed by white blood cell counts and CD5/CD19 staining. For the in vivo treatment experiment, C57BL/6 mice were randomly assigned to each of the 4 experimental cohorts 3 days after adoptive transfer. Mice were treated with palbociclib at a daily dose of 50 mg/kg and/or ibrutinib at a daily dose of 25 mg/kg. Both drugs were administered in 2 divided doses by intraperitoneal injection as described elsewhere.29-31
Additional details regarding cell culture and stimulation, cell-proliferation assays, histology, immunohistochemistry, real-time quantitative PCR (RQ-PCR), immunoblotting, flow cytometry, whole-exome sequencing, and statistical analysis are provided in the supplemental Materials and methods.
Results
Biallelic disruption of TP53, CDKN2A, and CDKN2B results in spontaneous proliferation of autoreactive Eμ-TCL1 leukemia cells
To further explore the role of the BCR in CLL cell proliferation, we reanalyzed a gene-expression data set of unstimulated and immobilized anti-IgM–stimulated CLL cells that we had previously used to identify targets of BCR-regulated micro-RNAs.32 A total of 735 genes were found to be differentially expressed based on fold change > 2.0 and P < .001. Pathway-enrichment analysis using the BIOCARTA database identified gene sets involved in G1-phase cell-cycle regulation as the most differentially expressed between unstimulated and anti-IgM–stimulated CLL cells (supplemental Table 4). The differentially expressed genes included MYC, CCND1, CCND2, and CDK4, which were all upregulated, and CDKN2D, which was downregulated in anti-IgM–stimulated CLL cells, consistent with entry of the leukemic cells into the G1 phase of the cell cycle. However, upregulation of the negative regulators CDKN1A and CDKN2B was also observed, with CDKN1A appearing as the most differentially expressed gene in this analysis (Figure 1A). The change in the expression of these cell-cycle inhibitors was further validated by RQ-PCR and immunoblotting analysis of an independent set of primary CLL samples (Figure 1B-C).
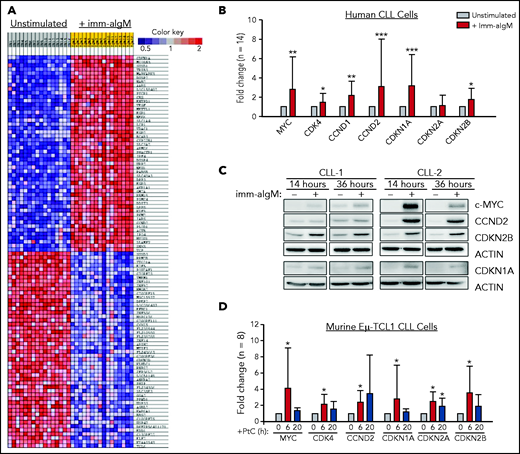
Positive and negative G1-phase cell-cycle regulators are induced in BCR-stimulated CLL cells. (A) Differentially expressed genes between unstimulated CLL cells and CLL cells stimulated for 20 hours with immobilized anti-IgM (imm-aIgM; n = 16) and analyzed on the Agilent Whole Human Genome Microarray 4x44K platform (GEO accession number GSE52776). The top 50 upregulated and top 50 downregulated genes are shown. (B) RQ-PCR analysis of an independent series of human CLL samples (n = 14) cultured for 20 hours with or without immobilized anti-IgM prior to RNA extraction. Significant differences with respect to unstimulated CLL cells are indicated with asterisks: *P < .05, **P < .01, ***P < .001. Analysis was performed using the paired Student t test or Wilcoxon signed-rank test, as appropriate. (C) Time-course analysis of changes in MYC, CCND2, CDKN1A, and CDKN2B protein expression in human CLL cells stimulated with immobilized anti-IgM. Analysis of CLL cells from 2 different patients is shown. (D) RQ-PCR analysis of changes in expression of positive and negative cell-cycle regulators in PtC-stimulated murine Eμ-TCL1–derived CLL cells expressing an anti-PtC BCR.
Positive and negative G1-phase cell-cycle regulators are induced in BCR-stimulated CLL cells. (A) Differentially expressed genes between unstimulated CLL cells and CLL cells stimulated for 20 hours with immobilized anti-IgM (imm-aIgM; n = 16) and analyzed on the Agilent Whole Human Genome Microarray 4x44K platform (GEO accession number GSE52776). The top 50 upregulated and top 50 downregulated genes are shown. (B) RQ-PCR analysis of an independent series of human CLL samples (n = 14) cultured for 20 hours with or without immobilized anti-IgM prior to RNA extraction. Significant differences with respect to unstimulated CLL cells are indicated with asterisks: *P < .05, **P < .01, ***P < .001. Analysis was performed using the paired Student t test or Wilcoxon signed-rank test, as appropriate. (C) Time-course analysis of changes in MYC, CCND2, CDKN1A, and CDKN2B protein expression in human CLL cells stimulated with immobilized anti-IgM. Analysis of CLL cells from 2 different patients is shown. (D) RQ-PCR analysis of changes in expression of positive and negative cell-cycle regulators in PtC-stimulated murine Eμ-TCL1–derived CLL cells expressing an anti-PtC BCR.
To investigate whether BCR engagement induces similar changes in murine CLL cells, we used Eμ-TCL1–derived leukemia cells reactive with the autoantigen phosphatidylcholine (PtC). PtC is a membrane phospholipid that is exposed on the surface of senescent or apoptotic cells and is recognized by the leukemic BCR in up to 30% of spontaneously arising Eμ-TCL1 leukemias.15,33,34 Stimulation of PtC-binding leukemia cells with PtC liposomes resulted in significant induction of CDKN1A and CDKN2B (Figure 1D). In addition, the cell-cycle inhibitor CDKN2A, which lies adjacent to CDKN2B on chromosome 9p21, was also induced in these experiments.
The finding that the cell-cycle inhibitors CDKN1A, CDKN2A, and CDKN2B are induced upon BCR engagement suggested that upregulation of these proteins could represent a mechanism to prevent the proliferation of antigen-stimulated CLL cells in the absence of costimulatory signals. On the other hand, the fact that these genes are often directly or indirectly inactivated in RS because of deletions involving the CDKN2A/2B locus (>30% of cases) and mutations or deletions the CDKN1A transcriptional activator TP53 (>50% of cases) suggested that genetic defects in these genes may contribute to CLL progression by allowing for costimulatory signal-independent proliferation. To further explore this possibility, we simultaneously targeted CDKN2A, CDKN2B, and TP53 in 1 Eμ-TCL1–derived leukemia expressing an anti-PtC BCR (TCL1-355). Targeting of CDKN2A, CDKN2B, and TP53 was performed by nucleofection-mediated delivery of RNP complexes containing recombinant Cas9 and a pool of guide RNAs (Figure 2A). The targeted and control cells were then expanded in immunodeficient NSG mice and were subsequently transferred in syngeneic recipients to evaluate the effects of CDKN2A/2B/TP53 knockdown on leukemia growth and proliferation. Combined targeting of CDKN2A, CDKN2B, and TP53 resulted in accelerated leukemia growth, as evidenced by the significantly higher number of leukemic cells in the peritoneal cavity, peripheral blood, and spleen of mice that received Cas9-edited vs control TCL1-355 leukemia cells (Figure 2B). The spleens of mice with Cas9-edited tumors showed morphological changes consistent with Richter transformation, including more diffuse infiltration, larger and more pleomorphic cells, a larger percentage of cells with macronucleoli and a significantly higher percentage of proliferating 5-bromo-2′-deoxyuridine-positive (BrdU+) or phosphohistone H3+ cells (Figure 2C). Moreover, indel analysis by amplicon capillary electrophoresis of Cas9-edited cells showed an increase in the ratio of CDKN2A, CDKN2B, and TP53 mutant vs wild-type alleles during in vivo propagation, further suggesting that cells with combined TP53/CDKN2A/2B deficiency have a growth advantage compared with wild-type CLL cells (Figure 2D). A separate experiment with independent knockdown of CDKN2A/2B and TP53 also revealed selection of the mutant alleles during in vivo propagation, although only CDKN2A/2B knockdown resulted in a significant increase in tumor burden (Figure 2E-F).

Combined CDKN2A, CDKN2B, and TP53 disruption accelerates tumor growth in the Eμ-TCL1 adoptive transfer model. (A) Schematic representation of the CRISPR/Cas9 procedure to target the CDKN2A, CDKN2B, and TP53 genes in primary Eμ-TCL1–derived murine CLL cells. (B) Box plots with data points showing absolute numbers of CD5+/CD19+ leukemia cells in peritoneal cavity, peripheral blood, and spleen of mice at 21 days after receiving CDKN2A/2B/TP53-targeted or control leukemia cells (n = 6 mice per group). Statistical analysis was performed using the Student t test. (C) Hematoxylin-and-eosin (H&E) staining and immunohistochemistry analysis of proliferating BrdU+ and phosphohistone H3+ cells in spleens of mice 21 days after receiving CDKN2A/2B/TP53-targeted or control leukemia cells. Images were captured with an Olympus BX53 microscope using an Olympus UC90 camera and CellSens Entry software. Statistical analysis was performed using the Student t test. Top row: scale bars, 500 μm; rows 2-4: scale bars, 20 μm. (D) Indel analysis by amplicon capillary electrophoresis of CDKN2A/2B/TP53-targeted leukemia cells isolated from spleens of mice after the first and second passage. Wild-type alleles are indicated by a red arrow; mutant alleles are indicated by a black arrow or brackets. The mutant/wild-type (M/WT) ratio was calculated by dividing the sum of the peak areas of the mutant alleles with the peak area of the wild-type allele. (E) Amplicon capillary electrophoresis analysis of indels in CDKN2A, CDKN2B, and TP53 in leukemia cells with independent targeting of CDKN2A/2B or TP53. (F) Box plots with data points showing absolute numbers of CD5+/CD19+ leukemia cells in peritoneal cavity, peripheral blood, and spleen of mice injected with CDKN2A/2B-targeted, TP53-targeted, or control leukemia cells (n = 8 mice per group).
Combined CDKN2A, CDKN2B, and TP53 disruption accelerates tumor growth in the Eμ-TCL1 adoptive transfer model. (A) Schematic representation of the CRISPR/Cas9 procedure to target the CDKN2A, CDKN2B, and TP53 genes in primary Eμ-TCL1–derived murine CLL cells. (B) Box plots with data points showing absolute numbers of CD5+/CD19+ leukemia cells in peritoneal cavity, peripheral blood, and spleen of mice at 21 days after receiving CDKN2A/2B/TP53-targeted or control leukemia cells (n = 6 mice per group). Statistical analysis was performed using the Student t test. (C) Hematoxylin-and-eosin (H&E) staining and immunohistochemistry analysis of proliferating BrdU+ and phosphohistone H3+ cells in spleens of mice 21 days after receiving CDKN2A/2B/TP53-targeted or control leukemia cells. Images were captured with an Olympus BX53 microscope using an Olympus UC90 camera and CellSens Entry software. Statistical analysis was performed using the Student t test. Top row: scale bars, 500 μm; rows 2-4: scale bars, 20 μm. (D) Indel analysis by amplicon capillary electrophoresis of CDKN2A/2B/TP53-targeted leukemia cells isolated from spleens of mice after the first and second passage. Wild-type alleles are indicated by a red arrow; mutant alleles are indicated by a black arrow or brackets. The mutant/wild-type (M/WT) ratio was calculated by dividing the sum of the peak areas of the mutant alleles with the peak area of the wild-type allele. (E) Amplicon capillary electrophoresis analysis of indels in CDKN2A, CDKN2B, and TP53 in leukemia cells with independent targeting of CDKN2A/2B or TP53. (F) Box plots with data points showing absolute numbers of CD5+/CD19+ leukemia cells in peritoneal cavity, peripheral blood, and spleen of mice injected with CDKN2A/2B-targeted, TP53-targeted, or control leukemia cells (n = 8 mice per group).
To investigate whether cells with combined CDKN2A/2B/TP53 deficiency are capable of spontaneous proliferation, we analyzed in vitro the growth of control, CDKN2A/2B-, TP53- and TP53/CDKN2A/2B-targeted leukemia cells, each isolated from spleens of 3 different mice. The percentage of viable leukemic cells dropped by 70% to 95% within the first week of culture in each of the 4 genotypes, but a small percentage of leukemic cells remained viable during the subsequent 4 to 5 weeks. Strikingly, starting from the sixth week of culture, the number of TP53/CDKN2A/2B-targeted cells started to increase (Figure 3A). By this time all of the control, CDKN2A/2B-, and TP53-targeted cells had died. The cells that started to proliferate were larger than the control TCL1-355 cells and displayed pleomorphic features (Figure 3B-C). Importantly, amplicon capillary electrophoresis showed complete disappearance of the wild-type CDKN2A, CDKN2B, and TP53 alleles in these cells, suggesting that biallelic loss of all 3 genes is required for spontaneous growth in vitro (Figure 3D). Consistent with this finding, immunoblotting analysis revealed no detectable expression of TP53, CDKN1A, CDKN2A, and CDKN2B protein in the spontaneously proliferating cells (Figure 3E). Nucleotide sequencing of the CRISPR/Cas9-targeted region further confirmed that both alleles of TP53, CDKN2A, and CDKN2B had been inactivated (Figure 3F-G).
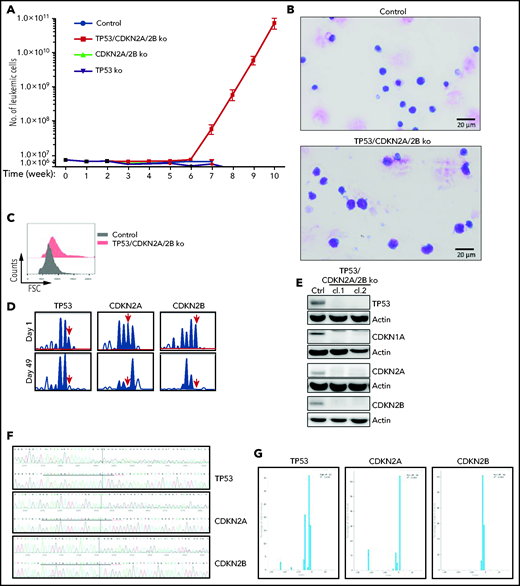
Eμ-TCL1 leukemia cells with biallelic loss of CDKN2A, CDKN2B, and TP53 proliferate spontaneously in vitro. (A) Absolute number of viable CDKN2A/2B/TP53-targeted, CDKN2A/2B-targeted, TP53-targeted, or control TCL1-355 leukemia cells at different time points in culture. A total of 5 × 10⁶ leukemia cells of each genotype were isolated from spleens of corresponding mice and placed in culture. The number of viable cells was calculated by evaluating the ratio of the percentage of propidium iodide (PI)-negative cells out of the total number of cells. Each data point represents an average of 5 independent experiments with CDKN2A/2B/TP53-targeted and 3 independent experiments with CDKN2A/2B-targeted, TP53-targeted, and control leukemia cells. (B) May-Grünwald-Giemsa staining of control TCL1-355 leukemia cells and TCL1-355 leukemia cells with biallelic CDKN2A/2B/TP53 disruption. Scale bars, 20 μm. (C) Forward scatter (FSC) analysis of control TCL1-355 leukemia cells and TCL1-355 leukemia cells with biallelic CDKN2A/2B/TP53 disruption. (D) Indel analysis by amplicon capillary electrophoresis of CDKN2A/2B/TP53-targeted leukemia cells at day 1 and day 49 in culture. The position of the wild-type allele is indicated by a red arrow. (E) Immunoblotting analysis of TP53, CDKN1A, CDKN2A, and CDKN2B protein expression in 2 different clones of spontaneously proliferating TCL1-355 leukemia cells with biallelic CDKN2A/2B/TP53 disruption. (F) Alignment of mutant and wild-type nucleotide sequences (upper and lower panel, respectively) of the Cas9-targeted region using the Inference of CRISPR Edits (ICE) software tool. Analysis was performed on TP53/CDKN2A/2B-ko leukemia cells collected after 7 weeks in culture. (G) Analysis of the percentage of individual indels in the whole population using the ICE software tool. Wild-type allele corresponds to position 0 and is absent in all 3 panels.
Eμ-TCL1 leukemia cells with biallelic loss of CDKN2A, CDKN2B, and TP53 proliferate spontaneously in vitro. (A) Absolute number of viable CDKN2A/2B/TP53-targeted, CDKN2A/2B-targeted, TP53-targeted, or control TCL1-355 leukemia cells at different time points in culture. A total of 5 × 10⁶ leukemia cells of each genotype were isolated from spleens of corresponding mice and placed in culture. The number of viable cells was calculated by evaluating the ratio of the percentage of propidium iodide (PI)-negative cells out of the total number of cells. Each data point represents an average of 5 independent experiments with CDKN2A/2B/TP53-targeted and 3 independent experiments with CDKN2A/2B-targeted, TP53-targeted, and control leukemia cells. (B) May-Grünwald-Giemsa staining of control TCL1-355 leukemia cells and TCL1-355 leukemia cells with biallelic CDKN2A/2B/TP53 disruption. Scale bars, 20 μm. (C) Forward scatter (FSC) analysis of control TCL1-355 leukemia cells and TCL1-355 leukemia cells with biallelic CDKN2A/2B/TP53 disruption. (D) Indel analysis by amplicon capillary electrophoresis of CDKN2A/2B/TP53-targeted leukemia cells at day 1 and day 49 in culture. The position of the wild-type allele is indicated by a red arrow. (E) Immunoblotting analysis of TP53, CDKN1A, CDKN2A, and CDKN2B protein expression in 2 different clones of spontaneously proliferating TCL1-355 leukemia cells with biallelic CDKN2A/2B/TP53 disruption. (F) Alignment of mutant and wild-type nucleotide sequences (upper and lower panel, respectively) of the Cas9-targeted region using the Inference of CRISPR Edits (ICE) software tool. Analysis was performed on TP53/CDKN2A/2B-ko leukemia cells collected after 7 weeks in culture. (G) Analysis of the percentage of individual indels in the whole population using the ICE software tool. Wild-type allele corresponds to position 0 and is absent in all 3 panels.
To more accurately model the temporal occurrence of genetic lesions in TP53 and CDKN2A/2B during Richter transformation, an independent experiment was performed using another Eμ-TCL1 leukemia line with an anti-PtC BCR (TCL1-863). In this experiment, the leukemia cells were first transfected with the TP53 Cas9-RNP complex, and after 1 round of in vivo expansion were transfected with the pool of CDKN2A/2B Cas9-RNP complexes (Figure 4A). Because cases of RS with CDKN2A/2B/TP53 lesions have frequently co-occurring MYC abnormalities, such as amplification of MYC or deletion of the MYC antagonists MGA or MNT,24,25,35,36 the TP53-targeted cells were transfected in parallel with a pool of CDKN2A/2B/MGA Cas9 RNP complexes. The resulting TP53/CDKN2A/2B- and TP53/CDKN2A/2B/MGA-targeted cells, as well as control and TP53-targeted TCL1-863 leukemia cells, were expanded in syngeneic recipients and analyzed for spontaneous growth in vitro. In accordance with the previous experiment, the control and TP53-targeted cells died within a few weeks in culture, whereas the TP53/CDKN2A/2B- and TP53/CDKN2A/2B/MGA-targeted cells started to spontaneously proliferate (Figure 4B). The spontaneously proliferating cells showed biallelic loss of TP53, CDKN2A, and CDKN2B, whereas MGA was disrupted in only a minor proportion of cells (Figure 4C; supplemental Figures 2-5). However, cells with biallelic loss of MGA were selected after prolonged culture, suggesting that this genetic lesion provides a growth advantage but is not required for spontaneous proliferation.

In vitro growth of Eμ-TCL1 leukemia cells with combined disruption of TP53, CDKN2A, CDKN2B, and MGA. (A) Schematic representation of the CRISPR/Cas9 procedure to target the TP53, CDKN2A, CDKN2B, and MGA genes in TCL1-863 leukemia cells. (B) Absolute number of viable TCL1-863 cells with TP53-targeted, TP53/CDKN2A/2B-targeted, TP53/CDKN2A/2B/MGA-targeted, or control TCL1-355 leukemia cells at different time points in culture. Each data point represents an average of 3 technical replicates. (C) Indel analysis by amplicon capillary electrophoresis of TP53/CDKN2A/2B/MGA-targeted leukemia cells at different time points in culture. The position of the wild-type allele is indicated by a red arrow.
In vitro growth of Eμ-TCL1 leukemia cells with combined disruption of TP53, CDKN2A, CDKN2B, and MGA. (A) Schematic representation of the CRISPR/Cas9 procedure to target the TP53, CDKN2A, CDKN2B, and MGA genes in TCL1-863 leukemia cells. (B) Absolute number of viable TCL1-863 cells with TP53-targeted, TP53/CDKN2A/2B-targeted, TP53/CDKN2A/2B/MGA-targeted, or control TCL1-355 leukemia cells at different time points in culture. Each data point represents an average of 3 technical replicates. (C) Indel analysis by amplicon capillary electrophoresis of TP53/CDKN2A/2B/MGA-targeted leukemia cells at different time points in culture. The position of the wild-type allele is indicated by a red arrow.
To investigate whether biallelic loss of TP53, CDKN2A, and CDKN2B can induce spontaneous proliferation of leukemia cells with a different BCR specificity, a separate experiment was performed using a previously established Eμ-TCL1 leukemia (TCL1-699) expressing a transgenic BCR reactive with the Smith (Sm) autoantigen.11 Targeting TP53, CDKN2A, and CDKN2B in these cells also resulted in the establishment of spontaneously proliferating leukemia cells with biallelic loss of all 3 genes (supplemental Figure 6). Importantly, whole-exome sequencing of the TCL1-355, TCL1-863, and TCL1-699 TP53/CDKN2A/2B knockout (ko) leukemias and their wild-type counterparts did not identify any additional shared acquired mutations in the CRISPR/Cas9-edited leukemic clones, excluding the possibility that spontaneous proliferation of these cells is caused by off-target mutations introduced during CRISPR/Cas9 editing (supplemental Table 5).
To determine the impact of biallelic TP53/CDKN2A/2B deficiency on leukemia behavior in vivo, wild-type and TP53/CDKN2A/2B-ko TCL1-355, TCL1-863, and TCL1-699 cells were adoptively transferred by intraperitoneal injection in C57BL/6-recipient mice. In all cases, mice that received TP53/CDKN2A/2B-ko cells had significantly shorter survival compared with controls (supplemental Figure 7). Interestingly, mice that received TCL1-699 TP53/CDKN2A/2B-ko cells had almost no circulating leukemia cells and much smaller spleens than their wild-type counterparts but instead developed large intraperitoneal tumors (supplemental Figure 8). The TP53/CDKN2A/2B-ko tumors were characterized by larger cells with less condensed chromatin and a larger percentage of BrdU+ or phosphohistone H3+ cells compared with their wild-type counterparts (supplemental Figures 9-11). Flow cytometry analysis did not reveal any immunophenotypic differences between the TP53/CDKN2A/2B-ko and wild-type tumors (supplemental Figure 12).
TP53/CDKN2A/2B-ko cells require BCR signals for proliferation
The previous experiments showed that biallelic loss of TP53, CDKN2A, and CDKN2B overcomes the need for costimulatory signals in driving proliferation of Eμ-TCL1 leukemia cells in vitro, but did not prove that this proliferation is BCR dependent. To further address this issue, we targeted the IgM constant region gene by CRISPR/Cas9 in TCL1-863 leukemia cells with biallelic TP53/CDKN2A/2B deficiency (Figure 5A). An editing efficiency of ∽60% was observed by indel analysis, consistent with the detection of a similar proportion of surface IgM− cells by flow cytometry. The surface IgM− cells became undetectable within 10 days of culture and were outgrown by cells with retained surface IgM expression. In parallel, a reduction in the ratio of IgM mutant vs wild-type alleles was observed. A small proportion of indels remained detectable even after prolonged culture, presumably reflecting the presence of cells with monoallelic IgM disruption and normal surface IgM expression. A separate experiment using 2 different TCL1-355 leukemia clones with TP53/CDKN2A/2B deficiency showed identical results (Figure 5B). Transfer of these cells in NSG mice showed that cells with a disrupted IgM heavy chain gene are also negatively selected in vivo (Figure 5B).
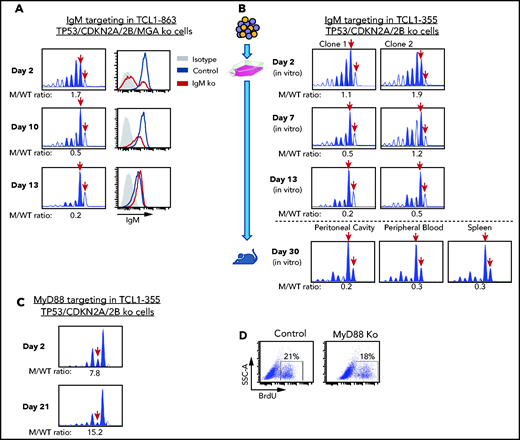
Effects of IgM or MyD88 targeting on growth of TP53/CDKN2A/2B-ko cells. (A) Time-course analysis of changes in IgM mutant vs wild-type allele ratio and surface IgM expression in TCL1-863 TP53/CDKN2A/2B/MGA-ko cells. The presence of 2 bands corresponding to the wild-type IgM heavy chain constant region gene (red arrows) is a result of the occasional nontemplated addition of a nucleotide at the 3′ end of PCR-amplified products by the Taq DNA polymerase.60 (B) Changes in IgM mutant vs wild-type allele ratio in TCL1-355 TP53/CDKN2A/2B-ko cells grown in vitro or in vivo. Cells were transfected with the RNP complex targeting the IgM heavy chain constant region gene and placed in culture. After 48 hours, cells were split and continued to be grown in vitro or were injected in the peritoneal cavity of an NSG mouse that was euthanized 28 days later. One of 2 experiments with identical results is shown. (C) Time-course analysis of changes in MyD88 mutant vs wild-type allele ratio in TCL1-355 TP53/CDKN2A/2B-ko cells. (D) BrdU-incorporation analysis of TCL1-355 TP53/CDKN2A/2B-ko cells with wild-type or mutated MyD88. Analysis was performed on cells collected 21 days after transfection with the MyD88 or control RNP complex.
Effects of IgM or MyD88 targeting on growth of TP53/CDKN2A/2B-ko cells. (A) Time-course analysis of changes in IgM mutant vs wild-type allele ratio and surface IgM expression in TCL1-863 TP53/CDKN2A/2B/MGA-ko cells. The presence of 2 bands corresponding to the wild-type IgM heavy chain constant region gene (red arrows) is a result of the occasional nontemplated addition of a nucleotide at the 3′ end of PCR-amplified products by the Taq DNA polymerase.60 (B) Changes in IgM mutant vs wild-type allele ratio in TCL1-355 TP53/CDKN2A/2B-ko cells grown in vitro or in vivo. Cells were transfected with the RNP complex targeting the IgM heavy chain constant region gene and placed in culture. After 48 hours, cells were split and continued to be grown in vitro or were injected in the peritoneal cavity of an NSG mouse that was euthanized 28 days later. One of 2 experiments with identical results is shown. (C) Time-course analysis of changes in MyD88 mutant vs wild-type allele ratio in TCL1-355 TP53/CDKN2A/2B-ko cells. (D) BrdU-incorporation analysis of TCL1-355 TP53/CDKN2A/2B-ko cells with wild-type or mutated MyD88. Analysis was performed on cells collected 21 days after transfection with the MyD88 or control RNP complex.
To exclude the possibility that in vitro the leukemic cells receive costimulatory proliferation signals from TLR ligands released in the culture medium by apoptotic cells, such as the TLR9 ligand DNA, we targeted by CRISPR/Cas9 the TLR adaptor protein MyD88. In contrast to cells with IgM disruption, cells with MyD88 knockdown were not negatively selected and proliferated at the same rate as cells with wild-type MyD88 (Figure 5C-D). Considering that T-cell–derived costimulatory signals are not present in the culture conditions, these experiments further establish that proliferation of Eμ-TCL1 leukemia cells with biallelic TP53/CDKN2A/2B deficiency is BCR dependent and costimulatory signal independent.
TP53/CDKN2A/2B-ko cells are sensitive to BCR-inhibitor treatment
The finding that cells with combined TP53/CDKN2A/2B deficiency require BCR expression indicated that they should be sensitive to treatment with a BCR inhibitor. To evaluate this possibility further, TCL1-355 TP53/CDKN2A/2B-ko cells were treated in vitro with the BTK inhibitor ibrutinib, the phosphatidylinositol 3-kinase δ inhibitor idelalisib, or the SYK inhibitor R406 (active substance of the drug fostamatinib). BrdU incorporation experiments showed almost complete growth inhibition, further suggesting that proliferation of these cells is dependent on BCR signals (Figure 6A).
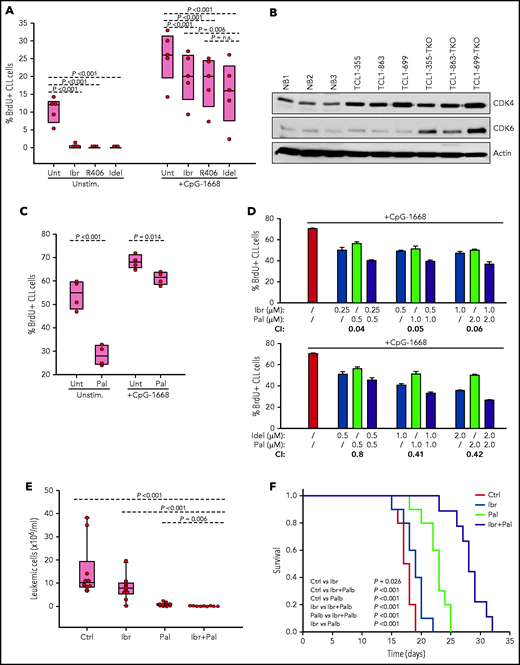
Evaluation of activity of BCR and CDK4/6 inhibitors against Eμ-TCL1 leukemia cells with combined TP53/CDKN2A/2B deficiency. (A) Effects of ibrutinib, R406, and idelalisib on proliferation of unstimulated or CpG-stimulated TCL1-355 leukemia cells with biallelic TP53/CDKN2A/2B disruption. Cells were cultured for 6 hours with BrdU prior to harvesting for flow cytometry analysis. All inhibitors were used at 1 μM concentration. Statistical analysis was performed using 1-way repeated measures analysis of variance (ANOVA) with the Holm-Šidak test for multiple comparisons. (B) Immunoblotting analysis of CDK4 and CDK6 protein expression in 3 normal splenic B-cell samples (NB1-NB3), the 3 CDKN2A/2B/TP53-ko leukemias (TCL1-355-TKO, TCL1-863-TKO, and TCL1-699-TKO), and their non-CDKN2A/2B/TP53–aberrated counterparts (TCL1-355, TCL1-863, TCL1-699). (C) Effects of palbociclib (Pal.) on proliferation of unstimulated or CpG-stimulated TCL1-355 leukemia cells with biallelic TP53/CDKN2A/2B disruption. Cells were cultured with BrdU for 20 hours prior to harvesting. Statistical analysis was performed using the paired Student t test. (D) Analysis of effects of palbociclib in combination with ibrutinib or idelalisib on proliferation of CpG-stimulated TCL1-355 leukemia cells with biallelic TP53/CDKN2A/2B disruption. The combination index (CI) was calculated using CompuSyn software (Paramus, NJ) according to the Chou-Talalay method.61 Mean values from 3 technical replicates were used in the equation. CI values below 1.0 indicate synergistic activity. (E) A total of 1 × 10⁷ TCL1-355 TP53/CDKN2A/2B-ko cells were engrafted in C57BL/6 mice via intraperitoneal injection and randomly assigned to each of the 4 experimental cohorts. Treatment with palbociclib, ibrutinib, or palbociclib plus ibrutinib was started 3 days later. The number of leukemic cells in peripheral blood after 10 days of treatment is shown. (F) Survival analysis of mice treated with palbociclib, ibrutinib, or palbociclib plus ibrutinib. The x-axis indicates days from adoptive transfer. Survival curves were estimated using the Kaplan-Meier method and curve differences among groups were assessed using the log-rank test and the Holm-Šidak method for multiple comparisons. Ibr, ibrutinib; Idel, idelalisib; Unt, untreated.
Evaluation of activity of BCR and CDK4/6 inhibitors against Eμ-TCL1 leukemia cells with combined TP53/CDKN2A/2B deficiency. (A) Effects of ibrutinib, R406, and idelalisib on proliferation of unstimulated or CpG-stimulated TCL1-355 leukemia cells with biallelic TP53/CDKN2A/2B disruption. Cells were cultured for 6 hours with BrdU prior to harvesting for flow cytometry analysis. All inhibitors were used at 1 μM concentration. Statistical analysis was performed using 1-way repeated measures analysis of variance (ANOVA) with the Holm-Šidak test for multiple comparisons. (B) Immunoblotting analysis of CDK4 and CDK6 protein expression in 3 normal splenic B-cell samples (NB1-NB3), the 3 CDKN2A/2B/TP53-ko leukemias (TCL1-355-TKO, TCL1-863-TKO, and TCL1-699-TKO), and their non-CDKN2A/2B/TP53–aberrated counterparts (TCL1-355, TCL1-863, TCL1-699). (C) Effects of palbociclib (Pal.) on proliferation of unstimulated or CpG-stimulated TCL1-355 leukemia cells with biallelic TP53/CDKN2A/2B disruption. Cells were cultured with BrdU for 20 hours prior to harvesting. Statistical analysis was performed using the paired Student t test. (D) Analysis of effects of palbociclib in combination with ibrutinib or idelalisib on proliferation of CpG-stimulated TCL1-355 leukemia cells with biallelic TP53/CDKN2A/2B disruption. The combination index (CI) was calculated using CompuSyn software (Paramus, NJ) according to the Chou-Talalay method.61 Mean values from 3 technical replicates were used in the equation. CI values below 1.0 indicate synergistic activity. (E) A total of 1 × 10⁷ TCL1-355 TP53/CDKN2A/2B-ko cells were engrafted in C57BL/6 mice via intraperitoneal injection and randomly assigned to each of the 4 experimental cohorts. Treatment with palbociclib, ibrutinib, or palbociclib plus ibrutinib was started 3 days later. The number of leukemic cells in peripheral blood after 10 days of treatment is shown. (F) Survival analysis of mice treated with palbociclib, ibrutinib, or palbociclib plus ibrutinib. The x-axis indicates days from adoptive transfer. Survival curves were estimated using the Kaplan-Meier method and curve differences among groups were assessed using the log-rank test and the Holm-Šidak method for multiple comparisons. Ibr, ibrutinib; Idel, idelalisib; Unt, untreated.
To investigate how BCR inhibitors affect the growth of CDKN2A/2B/TP53-ko cells exposed to other proliferative stimuli, BrdU incorporation experiments were performed with cells stimulated with the TLR9 ligand CpG-1668 (Figure 6A). Stimulation with CpG-1668 resulted in an increase in the percentage of BrdU+ cells that was only partially inhibited by treatment with ibrutinib, idelalisib, or R406. Considering that CDKN2A/2B/TP53 disruption results in cell-cycle dysregulation, we investigated the activity of palbociclib, a US Food and Drug Administration (FDA)-approved inhibitor of the kinases CDK4 and CDK6, both of which were found to be overexpressed in the CDKN2A/2B/TP53-ko leukemia compared with normal B cells (Figure 6B). Palbociclib inhibited the proliferation of unstimulated CDKN2A/2B/TP53-ko cells but was only modestly effective against CpG-1668–stimulated cells (Figure 6C). However, combining palbociclib with ibrutinib or idelalisib resulted in significantly greater inhibition of leukemic cell proliferation compared with each agent alone and displayed a combination index consistent with a synergistic effect (Figure 6D).
To compare in vivo the activity of the single and combination treatments, we treated 4 groups of mice with adoptively transferred CDKN2A/2B/TP53-deficient leukemia cells (n = 10 per group) with palbociclib, ibrutinib, palbociclib plus ibrutinib or vehicle for a period of 3 weeks. Analysis of peripheral blood samples after 10 days of treatment showed significantly lower numbers of leukemic cells in mice treated with palbociclib plus ibrutinib compared with any other treatment group (Figure 6E). Consistent with this finding, survival of mice receiving combination treatment was significantly improved compared with control mice or mice receiving single-agent treatment (Figure 6F).
BCR signals induce proliferation of human TP53/CDKN2A/2B-deficient RS cells
To validate these findings in a human setting, we took advantage of 2 recently established RS patient-derived xenografts.37 The RS9737 tumor has biallelic inactivation of TP53 and deletion of the genomic region encompassing CDKN2A and CDKN2B, whereas the RS1316 tumor has wild-type TP53 and CDKN2A/2B, but carries trisomy 12 and mutations in KRAS, MED12, and NOTCH2. Both tumors can be propagated in vivo using immunodeficient NSG mice but not in vitro because of spontaneous cell death by apoptosis.37
To investigate whether combined TP53 and CDKN2A/2B abnormalities allow for costimulatory signal-independent proliferation of human RS cells, RS9737 and RS1316 tumors were isolated from immunodeficient NSG mice, placed in culture, and analyzed by the BrdU-incorporation assay. Analysis of RS9737 cells showed spontaneous ex vivo proliferation until 96 hours, after which time point the cells started rapidly dying (supplemental Figure 13A). The percentage of proliferating RS9737 cells increased following stimulation with immobilized anti-IgM, suggesting that BCR stimulation alone is sufficient to induce proliferation of these cells. In contrast, RS1316 cells did not proliferate ex vivo and were not induced to proliferate by BCR stimulation, although they were induced to proliferate by stimulation with CpG plus IL-15 or CD40L plus IL-4 plus IL-21, stimuli that also increased the percentage of proliferating RS9737 cells (supplemental Figure 13B-C).
To determine whether the spontaneous ex vivo proliferation of RS9737 cells is BCR driven, BrdU-incorporation analysis was performed after 48-hour culture with ibrutinib, idelalisib, R406, or the SYK inhibitor entospletinib (Figure 7A). Treatment with R406, ibrutinib, or entospletinib significantly inhibited the proliferation of the malignant cells, with R406 displaying greatest inhibition. Palbociclib also significantly inhibited the proliferation of the malignant cells (Figure 7B) and demonstrated synergistic activity in combination with R406 (Figure 7C-D). This combination also displayed synergistic activity against CpG-2006 plus IL-15 or CD40L plus IL-4 plus IL-21 stimulated cells, suggesting that the combination of a BCR and CDK4/6 inhibitor could be effective against RS tumors exposed to other microenvironmental proliferation signals.
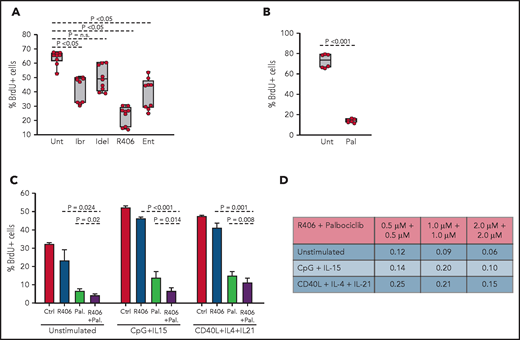
Effects of BCR inhibitors and palbociclib on the proliferation of human RS cells. (A) Effects of BCR inhibitors on spontaneous proliferation of RS9737 cells after 48 hours in culture. All inhibitors were used at 1 μM concentration. Three independent experiments, each with 3 technical replicates, were performed. Statistical analysis was performed using 1-way repeated measures ANOVA with the post hoc Tukey test. (B) Effects of palbociclib (1 μM) on spontaneous proliferation of RS9737 cells after 48 hours in culture. Statistical analysis was performed using the paired Student t test. (C) Analysis of activity of R406 and palbociclib, alone or in combination, against unstimulated and CpG plus IL15 or CD40L plus IL4 plus IL21 stimulated RS9737 cells. (D) Analysis of CI for R406 plus palbociclib against RS9737 cells. The CI was calculated as described in Figure 6D.
Effects of BCR inhibitors and palbociclib on the proliferation of human RS cells. (A) Effects of BCR inhibitors on spontaneous proliferation of RS9737 cells after 48 hours in culture. All inhibitors were used at 1 μM concentration. Three independent experiments, each with 3 technical replicates, were performed. Statistical analysis was performed using 1-way repeated measures ANOVA with the post hoc Tukey test. (B) Effects of palbociclib (1 μM) on spontaneous proliferation of RS9737 cells after 48 hours in culture. Statistical analysis was performed using the paired Student t test. (C) Analysis of activity of R406 and palbociclib, alone or in combination, against unstimulated and CpG plus IL15 or CD40L plus IL4 plus IL21 stimulated RS9737 cells. (D) Analysis of CI for R406 plus palbociclib against RS9737 cells. The CI was calculated as described in Figure 6D.
Discussion
The rapid inhibition of CLL cell proliferation in patients treated with a BCR inhibitor and the absence of a proliferative response upon BCR engagement in vitro have raised questions regarding the role of the BCR in regulating CLL cell proliferation. We now show that BCR stimulation of human and murine CLL cells induces the expression of the positive regulators MYC, CCND1, CCND2, and CDK4, which are required for cell-cycle entry, but simultaneously induces the expression of the negative regulators CDKN1A, CDKN2A and CDKN2B, which block subsequent cell-cycle progression. We further show that combined deficiency of these negative regulators, as occurs in approximately one-quarter of RS tumors, leads to more aggressive disease in vivo and spontaneous proliferation in vitro that is BCR dependent but independent of costimulatory signals. Together, these data provide evidence that BCR signals are directly involved in regulating CLL cell proliferation and reveal a mechanism through which frequently co-occurring genetic lesions in TP53 and CDKN2A/2B contribute to Richter transformation.
Progression through the G1 phase and entry in the S phase of the cell cycle is regulated by a complex interplay between different cyclins, cyclin-dependent kinases (CDKs) and CDK inhibitors. The limiting enzymes for G1-phase progression are CDK4 and CDK6, which are activated by the D-type cyclins CCND1, CCND2, and CCND3 and inhibited by the CDK inhibitors CDKN1A, CDKN1B, CDKN2A, and CDKN2B.38 The levels of expression of these cell-cycle regulators are determined by various extracellular signals, which depending upon the stage of differentiation and the strength, duration, and timing of the signal can induce S-phase entry, reversion to quiescence, or trigger apoptosis. Previous studies have shown that BCR engagement induces the expression of several positive regulators of the cell cycle in human and murine B cells, including CCND1, CCND2, and CDK4.21-23,38 In addition, studies in immature murine B cells have shown that BCR stimulation can also induce the negative cell-cycle regulators CDKN1A and CDKN1B.39 In our study, CDKN1B was not identified as differentially expressed following BCR stimulation, but upregulation of CDKN1A and CDKN2B was observed in human BCR-stimulated CLL cells and CDKN1A, CDKN2A, and CDKN2B in murine BCR-stimulated CLL cells. These findings suggest that enhanced expression of CDK inhibitors could be a common mechanism to prevent cell-cycle progression of B cells that have been stimulated through the BCR but have not received a costimulatory signal.
In the case of CLL B cells, this block in proliferation can be bypassed by costimulatory signals provided by TLR or CD40 stimulation, which have been shown to induce the expression of CCND3 and downregulate CDKN1B,40-43 thus shifting the balance in favor of positive cell-cycle regulators. The data presented in this study show that another mechanism to bypass this block is inactivating lesions in CDKN2A/2B and TP53, which have been reported in 1.7% and 17.7% of unselected CLL cases44 and 30% and 50% of RS cases,24,25 respectively. By preventing the induction of CDKN1A, CDKN2A, and CDKN2B, these lesions can substitute for costimulatory signals from the microenvironment and allow for BCR-dependent/costimulatory signal-independent proliferation of autoreactive B cells. Consistent with this possibility, expression of stereotyped BCRs characterized by broad autoreactivity has been associated with a greater risk for Richter transformation.45,46
One important feature of RS is the rapid and discordant growth of the malignant cells in localized lymph node or extranodal sites.26 Interestingly, this feature was observed only with the TP53/CDKN2A/2B-ko tumors expressing the anti-Sm BCR but not with the tumors expressing an anti-PtC BCR. An important difference between these BCRs that was revealed in a previous study by our group is the stronger autonomous activity of the anti-Sm BCR.11 Considering that integrin-mediated cell adhesion is regulated by BCR signals,47,48 it is plausible to hypothesize that the more sustained nature of the BCR signal in the anti-Sm tumors may account for their greater local growth and retention. Studies are ongoing to further address this possibility and more precisely define the role of BCR-triggered integrin activation during Richter transformation.
Eμ-TCL1–transgenic mice have been used to establish several other RS models in recent years. In particular, Eμ-TCL1–transgenic mice overexpressing activated AKT,49 activated NOTCH1,49 or MYC50 have been reported to develop aggressive lymphomas with diffuse large B-cell lymphoma morphology, although in the latter model the aggressive lymphomas were shown to be derived from B cells at an earlier maturation stage. In addition, aggressive lymphomas with RS features have been reported to develop in Eμ-TCL1 mice with B-cell–specific ablation of NFAT2 (typically characterized by downregulation of CDKN2A and TP53)51 and rarely (<15% of cases) in Eμ-TCL1 mice with B-cell–specific TP53 deficiency.52 Our model differs from these models in the simultaneous introduction of multiple RS-associated genetic lesions in already established leukemia cells, thus more accurately recapitulating the pattern of genetic evolution leading from CLL to RS and allowing evaluation of the combined vs individual role of these lesions during transformation. The model can be further improved by introducing the RS-associated lesions in murine leukemias with human CLL-specific genetic defects, and efforts toward that goal are ongoing in our laboratory.
Despite advances in CLL treatment, RS continues to be an area with urgent unmet clinical need.53 RS patients typically have poor response to chemotherapy and poor overall survival, and this is particularly the case of patients with TP53 and CDKN2A/2B abnormalities.25,54 The finding of this study that tumors with such abnormalities remain BCR dependent suggests that BCR inhibitors could be active in this subset of patients. In line with this possibility, clinical responses have been reported in chemotherapy-refractory RS patients treated with ibrutinib, idelalisib, or the more selective BTK inhibitor acalabrutinib, although typically of short duration.55-57 Our data suggest that the activity of these drugs could be improved by combining them with a CDK4/6 inhibitor, such as palbociclib. Importantly, palbociclib has already been tested in combination with ibrutinib in a phase 1 clinical trial of relapsed/refractory mantle cell lymphoma, demonstrating good tolerability, a high response rate (67%; complete response, 37%) and durable responses (2-year response duration, 70%).58 Together, these studies also provide the rationale to explore this combination in patients with RS and possibly other B-cell malignancies with an activated BCR pathway and combined TP53/CDKN2A/2B abnormalities, such as de novo diffuse large B-cell lymphoma.59
Acknowledgments
This work was supported by the Associazione Italiana per la Ricerca sul Cancro (AIRC, Projects IG 2016, Id. 19236 and IG 2020, Id. 24566, P.I, Efremov Dimitar) and the Italian Ministry of Health (Progetto Ricerca Finalizzata PE-2016-02362756).
Authorship
Contribution: S.C. and D.G.E. designed the study and wrote the manuscript; S.C., C.M., F.P., I.F., A.B., M.D., and R.F. performed the experiments; B.S.Y. and S.P. performed the bioinformatic analysis; A.Z. performed the histopathological analysis; I.I., T.V., S.D., A.J.D., and L.L. provided vital reagents, patient specimens, and/or supervised certain experiments; and all authors analyzed data and reviewed and approved the final version of the manuscript.
Conflict-of-interest disclosure: The authors declare no competing financial interests.
Correspondence: Dimitar G. Efremov, Molecular Hematology Unit, International Center for Genetic Engineering and Biotechnology, Padriciano 99, 34149 Trieste, Italy; e-mail: efremov@icgeb.org.
Presented in abstract form at the 62nd American Society of Hematology (ASH) Annual Meeting and Exposition, Virtual, 7 December 2020.
The data reported in this article have been deposited in the Sequence Read Archive database (accession number PRJNA708156).
For original data, please contact efremov@icgeb.org.
The online version of this article contains a data supplement.
There is a Blood Commentary on this article in this issue.
The publication costs of this article were defrayed in part by page charge payment. Therefore, and solely to indicate this fact, this article is hereby marked “advertisement” in accordance with 18 USC section 1734

This feature is available to Subscribers Only
Sign In or Create an Account Close Modal