

Key Points
SASH3 is an adaptor protein expressed mainly in lymphocytes that is important for T-cell proliferation and activation and cell survival.
Hemizygous loss-of-function variants in SASH3 result in combined immunodeficiency with immune dysregulation.

Abstract
Sterile alpha motif (SAM) and Src homology-3 (SH3) domain-containing 3 (SASH3), also called SH3-containing lymphocyte protein (SLY1), is a putative adaptor protein that is postulated to play an important role in the organization of signaling complexes and propagation of signal transduction cascades in lymphocytes. The SASH3 gene is located on the X-chromosome. Here, we identified 3 novel SASH3 deleterious variants in 4 unrelated male patients with a history of combined immunodeficiency and immune dysregulation that manifested as recurrent sinopulmonary, cutaneous, and mucosal infections and refractory autoimmune cytopenias. Patients exhibited CD4+ T-cell lymphopenia, decreased T-cell proliferation, cell cycle progression, and increased T-cell apoptosis in response to mitogens. In vitro T-cell differentiation of CD34+ cells and molecular signatures of rearrangements at the T-cell receptor α (TRA) locus were indicative of impaired thymocyte survival. These patients also manifested neutropenia and B-cell and natural killer (NK)-cell lymphopenia. Lentivirus-mediated transfer of the SASH3 complementary DNA–corrected protein expression, in vitro proliferation, and signaling in SASH3-deficient Jurkat and patient-derived T cells. These findings define a new type of X-linked combined immunodeficiency in humans that recapitulates many of the abnormalities reported in mice with Sly1–/– and Sly1Δ/Δ mutations, highlighting an important role of SASH3 in human lymphocyte function and survival.
Introduction
Antigen receptor engagement on lymphocytes allows for initiation of signal transduction pathways that ultimately guide the cellular immune response.1 Genetic defects associated with impaired antigen receptor signaling are a cause of combined immunodeficiency (CID) in humans, with increased susceptibility to severe infections, autoimmunity, and malignancies.2,3
Adaptor proteins play an important role in the propagation of signal transduction cascades. Through recognition of protein-protein interaction domains, adaptor molecules function as intracellular scaffolds around which signaling complexes are organized. SASH3 (sterile alpha motif [SAM] and Src homology 3 [SH3] domain-containing member 3), also called SH3-containing lymphocyte protein (SLY1), is a lymphoid-specific adaptor protein encoded by an X-linked gene.4 The SAM domain of SASH3 mediates homo- and heterodimerization, and the SH3 domain mediates protein–protein interaction by binding to proline-rich domains. SASH3 also contains 2 nuclear localization signals.5 First identified in an adhesion assay screen using a T-cell lymphoma complementary DNA library,6 SASH3 was later independently identified as a protein that is phosphorylated at Ser27 following T- or B-cell receptor ligation and protein kinase C (PKC) activation.7 However, its precise role in antigen receptor signaling is not defined. Sly1−/− and Sly1Δ/Δ mice,4 the latter expressing a protein that lacks the Ser27 phosphorylation site and parts of the nuclear localization signals, are characterized by reduced lymphoid organ cellularity, impaired T-cell proliferation after CD3 and CD28 stimulation, low levels of serum immunoglobulin M (IgM) and IgG1, impaired antibody responses to T-independent and T-dependent antigens, and quantitative and qualitative defects of natural killer (NK) cells.4,8-10 However, the role of SASH3 in human lymphoid development and function is not known.
Here, we report 4 unrelated male patients with recurrent infections, refractory autoimmune cytopenias, and profound multilineage immunodeficiency, associated with hemizygous loss-of-function SASH3 variants. These data identify SASH3 deficiency as a novel cause of X-linked CID in humans.
Patients and methods
Study approval and study patients
Peripheral blood mononuclear cells (PBMCs) and bone marrow samples were obtained upon informed consent, according to protocols 07-I-0-033, 93-I-0119, 10-I-0014, 13-N-0017, 20-N-9962, 05-I-0213, and 17-I-0122. The study was approved by the National Institutes of Health Institutional Review Board. Table 1 provides details regarding the 4 unrelated male patients (patient 1 [P1] to P4 in Figure 1A) in this study along with histories of recurrent infections and multilineage, treatment-refractory autoimmune cytopenias. Detailed clinical information is provided in the supplemental Material (available on the Blood Web site).
Clinical features of patients with SASH3 mutations
| P1 | P2 | P3 | P4 | |
|---|---|---|---|---|
| Age at first symptoms | 3 y | 5 y | 2 y | Not known |
| Infections | Recurrent pulmonary infections, skin/soft tissue infections, warts | Recurrent sinopulmonary infections, Escherichia coli sepsis | Recurrent sinopulmonary infections, dental abscesses, sepsis, and skin infections; Candida esophagitis; warts | JC virus progressive multifocal leukoencephalopathy, bacterial meningitis (2 episodes), septic arthritis, sepsis, recurrent sinopulmonary infections, varicella-zoster virus, warts |
| Hematology | Neutropenia, chronic thrombocytopenia, T-cell large granular lymphocyte (clonal CD8+CD57+ cells) proliferation | Autoimmune hemolytic anemia, immune-mediated thrombocytopenia, autoimmune neutropenia, splenomegaly, CD8+CD57+ large granular lymphocyte T cells in bone marrow | Autoimmune hemolytic anemia, immune-mediated thrombocytopenia, autoimmune neutropenia | Immune-mediated thrombocytopenia, autoimmune hemolytic anemia, leukopenia, CD8+CD57+ large granular lymphocyte T cells in bone marrow |
| Neurology | Brain volume loss, seizures (end of life) | JC virus progressive multifocal leukoencephalopathy | ||
| Cardiovascular | Episodic bradycardia | |||
| Pulmonary | Bronchiectasis, granulomatous nodules | |||
| Endocrine | Hypothyroidism | Hypothyroidism, hypophosphatemia | ||
| Gastrointestinal tract/liver | Hepatomegaly, suspected nodular regenerative hyperplasia | Enteropathy, nodular regenerative hyperplasia/hepatomegaly, liver granulomas | ||
| Skin and mucous membranes | Aphthous ulcers | Granulomatous skin lesions, aphthous ulcers | Granulomatous skin lesions |

Pedigrees, SASH3 genetic variants, and protein expression. (A) Pedigrees and familial segregation of mutant SASH3 alleles. Probands are indicated as P1to P4. SASH3 variants detected by whole-exome sequencing are designated at the nucleotide and amino acid level below each patient. (B) Sanger sequencing confirmation of SASH3 variants. The patient is identified on the upper left of each chromatogram (M., mother). Arrows designate the mutated nucleotide. Parental sequencing was not obtained for P2 or for P4 who was adopted. (C) SASH3 variants are predicted to be damaging. Plot of combined annotation depletion dependent (CADD, version 13) score vs minor allele frequency (MAF) of SASH3 modified from PopViz (Rockefeller University, New York, NY). The dotted horizontal line corresponds to the SASH3 mutation significance cutoff (MSC) score. Arrows identify the CADD score of each of the SASH3 variants detected in the patients, all of which were private (MAF = 0). (D) Schematic representation of the SASH3 protein and its domains. Locations of the patients’ variants are indicated by vertical red lines. Numbers indicate amino acid positions. (E) SASH3 protein is not detectable in patients with nonsense SASH3 variants. The immunoblot shows results for SASH3 and β-actin protein expression in PBMC lysates for the patients identified above each lane. CTRL, control, NES, nuclear export signal; NLS1, nuclear localization signal 1; NLS2, nuclear localization signal 2; NR, not reported.
Pedigrees, SASH3 genetic variants, and protein expression. (A) Pedigrees and familial segregation of mutant SASH3 alleles. Probands are indicated as P1to P4. SASH3 variants detected by whole-exome sequencing are designated at the nucleotide and amino acid level below each patient. (B) Sanger sequencing confirmation of SASH3 variants. The patient is identified on the upper left of each chromatogram (M., mother). Arrows designate the mutated nucleotide. Parental sequencing was not obtained for P2 or for P4 who was adopted. (C) SASH3 variants are predicted to be damaging. Plot of combined annotation depletion dependent (CADD, version 13) score vs minor allele frequency (MAF) of SASH3 modified from PopViz (Rockefeller University, New York, NY). The dotted horizontal line corresponds to the SASH3 mutation significance cutoff (MSC) score. Arrows identify the CADD score of each of the SASH3 variants detected in the patients, all of which were private (MAF = 0). (D) Schematic representation of the SASH3 protein and its domains. Locations of the patients’ variants are indicated by vertical red lines. Numbers indicate amino acid positions. (E) SASH3 protein is not detectable in patients with nonsense SASH3 variants. The immunoblot shows results for SASH3 and β-actin protein expression in PBMC lysates for the patients identified above each lane. CTRL, control, NES, nuclear export signal; NLS1, nuclear localization signal 1; NLS2, nuclear localization signal 2; NR, not reported.
Immune phenotyping, NK cell function, and next-generation sequencing
Peripheral blood and blood from bone marrow aspirates was processed using Ficoll (GE Healthcare, Marlborough, MA). Single-cell suspensions were stained with monoclonal antibodies directed against cell-surface molecules. Upon washing, cells were analyzed by flow cytometry using an LSR Fortessa Flow Cytometer with FACSDiva software, and the final analysis was performed using FlowJo v.10.6 software (BD Biosciences, Franklin Lakes, NJ). NK-cell degranulation in response to stimulation with K562 target cells and interleukin-12 (IL-12)/IL-18–induced NK-cell interferon γ (IFN-γ) production were tested as previously described.11 Genomic DNA was extracted from peripheral blood and subjected to massively parallel (next-generation) sequencing on an Illumina sequencing system (San Diego, CA) (details are provided in supplemental Methods).
Plasma preparation, cell proliferation, cell cycle, and apoptosis
Plasma was prepared from heparinized blood by centrifugation at 2000g for 10 minutes, and levels of soluble biomarkers were measured using a V-PLEX Human Cytokine 30-Plex Kit and a SECTOR Imager 6000 Reader (both from Meso Scale Diagnostics, Gaithersburg, MD) according to the manufacturer’s directions. In vitro T-cell proliferation upon stimulation with anti-CD3 and anti-CD28 (with or without IL-2), or with phosphomolybdic acid (PMA) plus ionomycin was measured by Cell Trace Violet dilution as described.12 Cell cycle progression and apoptosis were analyzed by culturing PBMCs (5 × 10⁵ cells per well) with either medium alone or 20 ng/mL PMA plus 500 ng/mL ionomycin or with 100 ng/mL anti-CD3 plus 100 ng/mL anti-CD28 for 72 hours. Cell cycle analysis was performed using a Click-iT EdU Alexa Fluor 647 Flow Cytometry Assay Kit (Invitrogen, Carlsbad, CA) according to the manufacturer’s instructions. For apoptosis, cells were stained with a Fluorescein Isothiocyanate-Annexin V Apoptosis Detection Kit (BioLegend, San Diego, CA) and 4′,6-diamidino-2-phenylindole (DAPI) (FxCycle Violet; Invitrogen) for 30 minutes and analyzed by flow cytometry.
Western blotting and HTS of TRA rearrangements
Cell lysates were obtained from 1 × 10⁶ PBMCs or from 5 × 10⁵ T-cell enriched preparations (EasySep Human T-Cell Enrichment Kit; STEMCELL Technologies) under resting conditions or upon stimulation for 20 minutes with CD3 and CD28 (Dynabeads T-Cell Activator; Invitrogen). Samples were resolved by sodium dodecyl sulfate-polyacrylamide gel electrophoresis according to standard protocols, transferred to nitrocellulose transfer membrane (Invitrogen), and immunoblotted with specific antibodies (see supplemental Methods). Immunoreactive proteins were detected with horseradish peroxidase–coupled secondary antibodies (GE Healthcare), followed by an electrochemiluminescence assay (Thermo Fisher Scientific, Waltham, MA). PBMCs were collected and enriched for CD3+ cells using the Pan T-Cell Isolation Kit (Miltenyi Biotec). High-throughput sequencing (HTS) of T-cell receptor α (TRA) rearrangements was performed by multiplex polymerase chain reaction, using DNA as the template (Adaptive Biotechnologies, Seattle, WA), as described.13
Structural modeling
Experimentally derived structures for the SH3 and SAM domains of SASH3 were combined using homology-based methods14 and the closest experimental structures were obtained by a sequence-based search15 of the protein data bank.14 The SAM domain was modeled from mouse Sly1 (100% identity; 6fxf5). The SH3 domain was modeled from the SH3 domain of human HACS1 (92% identical; 6uzj [unpublished]). The C-terminal region of SASH3 is likely to be intrinsically disordered, using the consensus prediction from MobiDB-lite.16 Genomic variants were assessed in their 3D context using FoldX version 4.0.17 The effects of genomic variants on simple linear motifs were assessed using ELM18 and custom scripts.
In vitro T-cell differentiation and correction of SASH3 deficiency
In vitro T-cell differentiation of sort-purified bone marrow–derived and mobilized peripheral blood–derived CD34+CD3– cells was performed using the artificial thymic organoid (ATO) system, as described.19SASH3−/− Jurkat cells were generated using CRISPR, and their genotypes were characterized as detailed in supplemental Material. Lack of SASH3 protein expression was confirmed by western blotting. A bicistronic lentiviral vector expressing SASH3 and mCherry was generated and used to transduce SASH3−/− Jurkat cells as well as control- and patient-derived T cells, as described in supplemental Material. In parallel, cells were transduced with a mock-vector expressing mCherry only. Reconstitution of SASH3 expression was assessed by western blot. In vitro proliferation of parental SASH3−/− and gene-transduced Jurkat cells was assessed by plating the same number of cells in triplicate wells in RPMI-10% fetal bovine serum and counting the number of cells once per day for 4 days. Mock-transduced and SASH3-transduced control and patient-derived T cells were stimulated in vitro with anti-CD3 plus anti-CD28 for 20 minutes, as described above, and cell lysates were probed with antibodies to phosphorylated PLCγ1 (pPLCγ1), total PLCγ1, SASH3, and glyceraldehyde-3-phosphate dehydrogenase.
Statistical analysis
Differences between groups were analyzed using either the Student t test (for individual comparisons with Gaussian distributions), or the Mann-Whitney U test (for individual comparisons with non-Gaussian distributions), with statistical significance indicating a 95% confidence interval. Statistical analysis was performed using Prism (GraphPad Software, San Diego, CA).
Results
Hematologic and immunologic phenotype
At the time of genetic diagnosis, all patients were leukopenic (Table 2). Analysis of lymphocyte subsets demonstrated low CD4+ T-cell counts in P1, P3, and P4 and a marked decrease of CD4+ naïve T cells in all 4 patients. P2 and P4 also had low naïve CD8+ T-cell counts, whereas P1 and P3 showed an elevated number of CD8+ effector memory cells re-expressing CD45RA (TEMRA) that expressed programmed cell death protein 1 (PD-1) and CD95 (supplemental Figure 1A). The proportion of CD4+CD25hiCD127low regulatory T cells (Tregs) was decreased in P1, P2, and P3 (Table 1). The distribution of T helper (TH) cell subsets was studied by analyzing the expression of CXCR3 and CCR6 chemokine receptors on the surface of CD4+CD25lowCD45RA–CXCR5– cells.20 Near absence of TH1, TH17, and TH1* cells was observed in P1, P3, and P4, and a severe reduction of TH17 cells was detected in P2 (supplemental Figure 1B).
Laboratory data for patients with SASH3 mutation at the time of genetic diagnosis
| Reference range | P1 | P2 | P3 | P4 | |
|---|---|---|---|---|---|
| Age at genetic diagnosis, years | 19 | 50 | 27 | 56 | |
| SASH3 variant | p.R347C | p.R288X | p.R288X | p.R245X | |
| White blood cell count | 4.23-9.07 | 2.53 (L) | 1.89 (L) | 2.68 (L) | 4.11 (L) |
| Hemoglobin, g/dL | 13.7-17.5 | 15.6 | 9.5 (L) | 11.7 (L) | 15.2 |
| Platelet count × 103/μL | 161-347 | 156 (L) | 216 | 46 (L) | 291 |
| Absolute lymphocyte count × 103/μL | 1.32-3.57 | 1.33 | 0.58 (L) | 2.01 | 0.56 (L) |
| Absolute neutrophil count × 103/μL | 1.78-5.38 | 0.38 (L) | 1.09 (L) | 0.60 (L) | 2.74 |
| CD3+ cells per μL | 714-2266 | 1294 | 530 (L) | 2002 | 339 (L) |
| CD4+CD3+ cells per μL | 359-1565 | 140 (L) | 393 | 145 (L) | 133 (L) |
| CD4+CD62L+CD45RA+CD3+ cells per μL | 102-1041 | 32 (L) | 16 (L) | 0 (L) | 1 (L) |
| CD4+CD62L+CD45RA–CD3+ cells per μL | 162-614 | 53 (L) | 220 | 121 (L) | 105 (L) |
| CD4+CD62L–CD45RA–CD3+cells per μL | 42-225 | 20 (L) | 149 | 24 (L) | 26 (L) |
| CD4+CD62L–CD45RA+CD3+ cells per μL | 0-29 | 35 (H) | 8 | 0 | 0 |
| CD4+CD25hiCD127low, % of CD4+ cells | 3-10 | 2.24 (L) | 2.27 (L) | 0.97 (L) | 5.3 |
| CD8+CD3+ cells per μL | 178-853 | 1001 (H) | 125 (L) | 1214 (H) | 191 |
| CD8+CD62L+CD45RA+CD3+ cells per μL | 85-568 | 181 | 39 (L) | 237 | 42 (L) |
| CD8+CD62L+CD45RA–CD3+ cells per μL | 25-180 | 37 | 41 | 28 | 121 |
| CD8+CD62L–CD45RA–CD3+ cells per μL | 24-175 | 52 | 23 (L) | 40 | 9 (L) |
| CD8+CD62L–CD45RA+CD3+ cells per μL | 11-172 | 733 (H) | 21 | 907 (H) | 20 |
| CD19+ cells per μL | 61 -321 | 4 (L) | 13 (L)* | 0 (L)* | 8 (L)* |
| CD3–CD16+CD56+ cells per μL | 126-729 | 33 (L) | 36 (L) | 0 (L) | 124 (L) |
| Serum IgG, mg/dL | 700-1600 | 813 | 1425† | 1364† | 173 (L) |
| Serum IgA, mg/dL | 70-400 | 82 | <5 (L) | <5 (L) | <5 (L) |
| Serum IgM, mg/dL | 40-230 | 26 (L) | 755 (H) | <5 (L) | <5 (L) |
| Anti-pneumococcal antibody (proportion of serotypes with positive antibody titer) | Positive: >1.3 μg/mL | 14/23 | N/A | N/A | 6/23 |
| Anti-tetanus IgG, IU/mL | Positive: ≥0.01 | 0.48 | N/A | N/A | 0.29 |
| Antidiphtheria IgG, IU/mL | Positive: >0.01 | >1.00 | N/A | N/A | 0.04 |
| Anti-Haemophilus influenzae IgG, mg/L | Positive: ≥1.0 | 1.79 | N/A | N/A | ND |
| Anti-rubella IgG, IU/mL | Positive: >10 | 2.2 | N/A | N/A | ND |
| Anti-nuclear antibody, EU | 0.0-0.9 | 1.0 (H) | 1.5 (H) | 0.0 | ND |
| Anti-thyroid peroxidase IgG, IU/mL | 0.0-34.9 | Negative | 73.4 (H) | 40.7 (H) | ND |
| Epstein-Barr viremia, log10 IU/mL | <2.07 log | Negative | Negative | Negative | |
| Cytomegalovirus viremia, log10 IU/mL | Negative | Negative | Negative | Negative |
Abnormal values are in bold.
EU, ELISA units; H, high; L, low; N/A, not available; ND, not done.
Patients who had received rituximab.
Patients who had received immunoglobulin replacement therapy.
All 4 patients had very low to absent CD19+ B cells (Table 2). P2, P3, and P4 had previously received rituximab; however, they had been diagnosed with low IgG and IgA and defective specific antibody responses in childhood or young adulthood before receiving rituximab. P1 had profound B-cell lymphopenia and low serum IgM but normal IgG levels and preserved antibody responses (Table 2). Bone marrow examination was performed in P1, P2, and P4, and it revealed mild hypocellularity in P2, extensive infiltrates of CD3+CD8+CD57+ cells in all 3 patients (supplemental Figure 2A-D), and significant expansion of CD19+CD20–CD10–CD38++ plasmablasts in P1 and P2 (supplemental Figure 3).
All patients had severe NK-cell lymphopenia (Table 1), with decreased expression of CD57, CXCR1, and KIR and increased expression of NKG2A in P1 and P2 compared with controls (supplemental Figure 4A). In vitro studies of NK-cell function were performed in P2, and they showed decreased IFN-γ expression after stimulation with IL-12 and IL-18 (supplemental Figure 4B) but normal degranulation upon coculture with K562 target cells and IL-2 (supplemental Figure 4C). Three patients had neutropenia. Increased plasma levels of several biomarkers (IL-1β, IL-6, tumor necrosis factor α, CXCL10, CCL3, CCL4, and IL-18) were documented in P1, P2, and P3, consistent with a hyperinflammatory state associated with immune dysregulation in these patients (supplemental Figure 5).
Molecular identification and characterization of SASH3 gene defect
To search for possible underlying gene defects, we used whole-exome sequencing. No variants in genes known to be associated with inborn errors of immunity were detected. However, all 4 patients carried variants in the SASH3 gene located on chromosome Xq26.1 (Figure 1A). In particular, P1 was hemizygous for the c.1039C>T missense variant, predicted to result in p.Arg347Cys amino acid change. The remaining 3 patients (P2, P3, and P4) were hemizygous for nonsense variants. P2 and P3 shared the same c.862C>T variant, predicted to cause an early termination at codon 288 (p.Arg288Ter). P4 was hemizygous for a c.733C>T variant (p.Arg245Ter). These variants were confirmed by Sanger sequencing, and heterozygosity for the respective variants was documented in the mothers of patients P1 and P3 (Figure 1B). None of these variants are reported in the Genome Aggregation Database (gnomAD),21 and their combined annotation–dependent depletion (CADD) score (34 for p.Arg347Cys and 39 for both p.Arg288Ter and p.Arg245Ter) is significantly higher than the SASH3 mutation significance cutoff (MSC) score22 of 3.313 (Figure 1C).
The SASH3 variants identified in P2, P3, and P4 are predicted to result in protein truncation within (P2, P3) or immediately upstream from the SAM domain (P4), whereas the missense variant detected in P1 (p.Arg347Cys) is located in the C terminus of the protein (Figure 1D). Western blotting analysis performed on PBMC lysates obtained from patients and controls with a polyclonal antibody targeting the N terminus of the SASH3 protein showed the presence of a normal-sized product in P1 at slightly reduced levels compared with control. In contrast, no SASH3 expression was detected in P2, P3, or P4 (Figure 1E), presumably as a result of nonsense-mediated RNA decay.
To facilitate interpretation of the genomic variants observed in patients, we generated a 3D model for the region of SASH3 from the beginning of the SH3 domain, through the C terminus (supplemental Figure 6). The linker between SH3 and SAM and the C-terminal region are likely highly dynamic. Although we failed to detect expression of SASH3 protein in cell lysates from P2 and P3, the p.Arg288Ter variant occurs in the second-to-last exon, leaving potential for some of the message to escape nonsense-mediated decay. Nonetheless, this variant causes partial loss of the SAM domain and disrupts the 3D structure of the domain and thereby its ability to bind other proteins. In addition, there are multiple posttranslational modifications in the C terminus that would not be present in the truncated protein. We further analyzed the possible consequences of the variant identified in P1 by an enhanced annotation approach. We investigated sequence motifs present near Arg347, a highly conserved residue from Xenopus through humans and identified a putative protein kinase A–binding motif. The p.Arg347Cys substitution disrupts this motif (supplemental Figure 6). Furthermore, the wild-type SASH3 protein has been measured to be phosphorylated at residue Ser349 by multiple mass spectrometry studies,23 which supports the functional role of the motif. Thus, the p.Arg347Cys amino acid substitution may alter SASH3 activity through loss of the Ser349 regulatory phosphorylation mark.
Defective activation, proliferation, and cell cycle progression of SASH3-mutated T cells
Upon stimulation with anti-CD3 and anti-CD28, both CD4+ and CD8+ T cells from SASH3-deficient patients demonstrated impaired expression of CD25 along with CD71, CD98, and GLUT1, 3 activation-dependent metabolite transporters24 (Figure 2A-B). These defects were associated with reduced cell proliferation (Figure 3A). The addition of exogenous IL-2 partially rescued the phenotype (Figures 2A and 3A-B). In vitro T-cell proliferation was also impaired in response to stimulation with PMA and ionomycin (Figure 3A), suggesting that distal intracellular signaling is also affected. Upon stimulation with PMA, ionomycin, anti-CD3, and anti-CD28 for 72 hours, cell cycle analysis showed that the proportion of lymphocytes in S phase and in G2/M phase were reduced and increased, respectively, in patients compared with controls (Figure 3B). Significantly elevated proportions of early- (annexin V+DAPI–) and late- (annexin V+DAPI+) stage apoptotic cells were observed in SASH3-deficient patients under unstimulated conditions and upon stimulation with anti-CD3 and anti-CD28 or with PMA and ionomycin (Figure 3C), indicating that increased apoptosis may also contribute to the impaired proliferation of SASH3-mutated T cells.
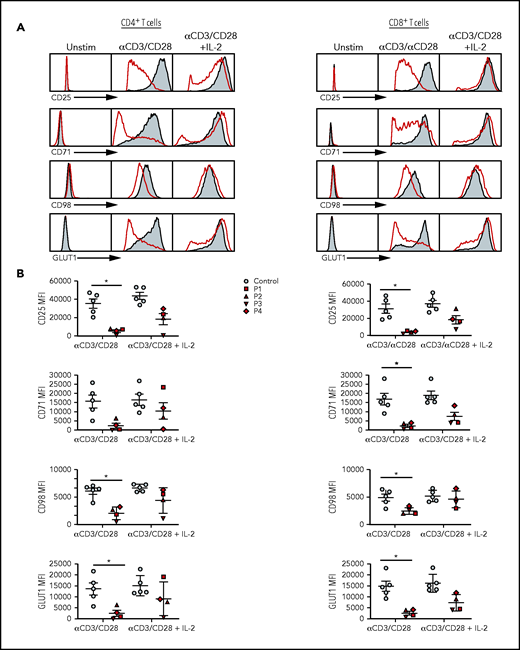
Activation profiles of SASH3-mutated T cells after in vitro stimulation with mitogens. (A) Representative plots of CD25, CD71, CD98, and GLUT1 expression in (left) CD4+ and (right) CD8+ T cells from P2 (red) and a healthy control (solid gray) in resting conditions or upon activation with anti-CD3 and anti-CD28 or anti-CD3 and anti-CD28 plus IL-2 in CD4+ T cells. (B) Cumulative mean fluorescence intensity (MFI) data for CD25, CD71, CD98, and GLUT1 expression in (left) CD4+ and (right) CD8+ T cells from controls (n = 5; solid gray) and SASH3-mutated patients (red). Bars represent mean values ± standard error of the mean. *P ≤ .05. Unstim, unstimulated.
Activation profiles of SASH3-mutated T cells after in vitro stimulation with mitogens. (A) Representative plots of CD25, CD71, CD98, and GLUT1 expression in (left) CD4+ and (right) CD8+ T cells from P2 (red) and a healthy control (solid gray) in resting conditions or upon activation with anti-CD3 and anti-CD28 or anti-CD3 and anti-CD28 plus IL-2 in CD4+ T cells. (B) Cumulative mean fluorescence intensity (MFI) data for CD25, CD71, CD98, and GLUT1 expression in (left) CD4+ and (right) CD8+ T cells from controls (n = 5; solid gray) and SASH3-mutated patients (red). Bars represent mean values ± standard error of the mean. *P ≤ .05. Unstim, unstimulated.

Proliferation, cell cycle, and apoptosis of SASH3-mutated T cells after in vitro stimulation with mitogens. (A) Top: Representative plots showing Cell Trace Violet (CTV) staining in CD4+ or CD8+ T cells from P2 (red line) and control (solid gray). Red numbers correspond to the frequency of CTVlow proliferating cells (black bar). Bottom: Cumulative percentage of CTVlow cells among CD4+ or CD8+ T cells from controls (solid gray) or SASH3-mutated patients (red) in resting conditions or upon stimulation with anti-CD3 and anti-CD28, anti-CD3 and anti-CD28 plus IL-2, or PMA and ionomycin. Response to PMA and ionomycin was not studied in P3 because of a lack of available cells. Bars represent mean values ± standard error of the mean. (B) Cell cycle analysis. PBMCs from controls (CTRL1 and CRTL2) and patients (P1, P2, P4) were stimulated with anti-CD3 and anti-CD28 for 96 hours, or with PMA and ionomycin for 72 hours and then stained with 5-ethynyl-2′-deoxyuridine (EdU) and DAPI. A decreased proportion of cells in S phase and an accumulation of cells in G2/M phase were observed in the patients. (C) Analysis of cell apoptosis. PBMCs from controls (CTRL1 to CTRL3) and patients (P1, P2, P4) were either left unstimulated or were cultured with anti-CD3 and anti-CD28 or PMA and ionomycin for 96 hours and stained with annexin V and DAPI for 30 minutes; live cells were counted by flow cytometry. P3 was not studied because of lack of available cells. Increased apoptosis was observed in all patient samples when compared with controls. Statistical analysis was performed by comparing the percentage of annexin V+ cells in patients vs controls. *P ≤ .05; **P ≤ .01; ***P ≤ .001; ****P ≤ .0001.
Proliferation, cell cycle, and apoptosis of SASH3-mutated T cells after in vitro stimulation with mitogens. (A) Top: Representative plots showing Cell Trace Violet (CTV) staining in CD4+ or CD8+ T cells from P2 (red line) and control (solid gray). Red numbers correspond to the frequency of CTVlow proliferating cells (black bar). Bottom: Cumulative percentage of CTVlow cells among CD4+ or CD8+ T cells from controls (solid gray) or SASH3-mutated patients (red) in resting conditions or upon stimulation with anti-CD3 and anti-CD28, anti-CD3 and anti-CD28 plus IL-2, or PMA and ionomycin. Response to PMA and ionomycin was not studied in P3 because of a lack of available cells. Bars represent mean values ± standard error of the mean. (B) Cell cycle analysis. PBMCs from controls (CTRL1 and CRTL2) and patients (P1, P2, P4) were stimulated with anti-CD3 and anti-CD28 for 96 hours, or with PMA and ionomycin for 72 hours and then stained with 5-ethynyl-2′-deoxyuridine (EdU) and DAPI. A decreased proportion of cells in S phase and an accumulation of cells in G2/M phase were observed in the patients. (C) Analysis of cell apoptosis. PBMCs from controls (CTRL1 to CTRL3) and patients (P1, P2, P4) were either left unstimulated or were cultured with anti-CD3 and anti-CD28 or PMA and ionomycin for 96 hours and stained with annexin V and DAPI for 30 minutes; live cells were counted by flow cytometry. P3 was not studied because of lack of available cells. Increased apoptosis was observed in all patient samples when compared with controls. Statistical analysis was performed by comparing the percentage of annexin V+ cells in patients vs controls. *P ≤ .05; **P ≤ .01; ***P ≤ .001; ****P ≤ .0001.
SASH3 variants globally affect TCR signaling
To better characterize at the biochemical level how SASH3 deficiency affects T-cell receptor (TCR) signaling, we performed western blotting on T-cell lysates from P1 and P2 in resting conditions and upon stimulation with anti-CD3 and anti-CD28. A global defect of TCR signaling was detected in both patients; they had decreased levels of pZAP70, pLAT, and pPLCγ1, virtual absence of pERK and pAKT, and markedly reduced amounts of p4EBP and pS6. In addition, pIκBα was nearly absent, and levels of pNF-κB-p65 were markedly reduced. These defects were more severe in P2 than in P1, consistent with the putative hypomorphic nature of the variant in P1. Levels of the antiapoptotic protein BCL2 were decreased in patient cells (Figure 4), consistent with increased apoptosis.
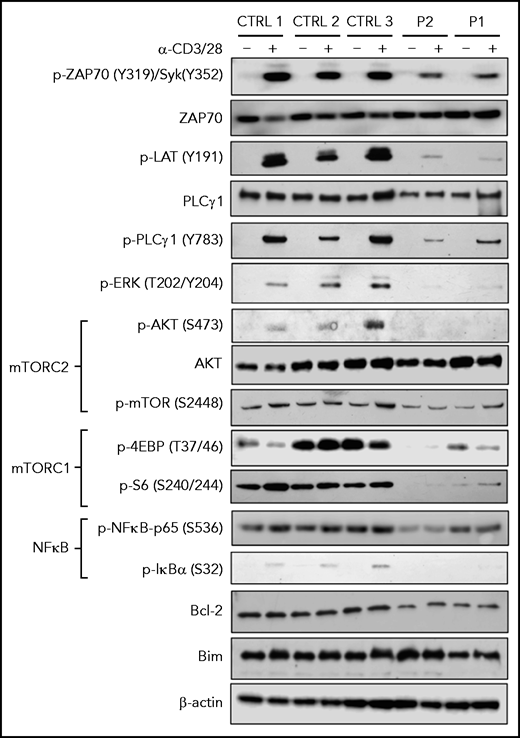
TCR signaling in SASH3-mutated patients. Immunoblots for the indicated proteins and phosphorylated proteins on lysates from 5 × 10³ CD3+ T cells (obtained from PBMCs upon negative selection with magnetic beads) with (+) and without (–) stimulation with anti-CD3 and anti-CD28 Dynabeads for 20 minutes from 3 healthy controls and P1 and P2. β-actin was used as loading control.
TCR signaling in SASH3-mutated patients. Immunoblots for the indicated proteins and phosphorylated proteins on lysates from 5 × 10³ CD3+ T cells (obtained from PBMCs upon negative selection with magnetic beads) with (+) and without (–) stimulation with anti-CD3 and anti-CD28 Dynabeads for 20 minutes from 3 healthy controls and P1 and P2. β-actin was used as loading control.
Abnormalities of rearrangements at the TCRα (TRA) locus in patients with SASH3 deficiency
Reduced TCR signaling may affect positive and negative selection in the thymus,25 and impaired thymocyte survival has been reported in Sly1−/− mice.10 To investigate whether a similar mechanism may contribute to the naïve T-cell lymphopenia observed in the patients, we analyzed composition of the TRA repertoire in peripheral T cells from patients and controls. During T-cell development, rearrangements at the TRA locus occur sequentially, so that only thymocytes that survive long enough can rearrange the most upstream TRAV and the most downstream TRAJ genes.26 Human genetic conditions associated with reduced thymocyte lifespan are characterized by a low number of T cells expressing Vα7.2, the product of the upstream TRAV1/2 gene.27,28 The proportion of CD3+ cells expressing Vα7.2 (including mucosa-associated invariant T [MAIT] cells) was significantly reduced in P2, P3, and P4, whereas a normal proportion of such cells was detected in P1 (supplemental Figure 7). HTS of the TRA repertoire demonstrated reduced usage of the most distal TRAV and TRAJ gene segments in both unique and total sequences from P1 and P3 (Figure 5A). Moreover, decreased diversity of the T-cell repertoire (Figure 5B) and prominent clonotypic expansions (Figure 5C) were observed in both patients compared with age-matched controls. Because autoimmune cytopenia was a prominent clinical manifestation in our cohort, we analyzed the frequency of TRA clonotypes containing hydrophobic amino acids at positions 6 and 7 of the CDR3, a molecular biomarker of self-reactivity.13 A higher proportion of such clonotypes was detected in both patients as compared with controls (Figure 5D). This effect was more prominent in P3 than in P1, consistent with the more severe clinical phenotype in P3.
![HTS analysis of the TRA repertoire in SASH3-mutated patients. (A) Representative heat maps depicting Vα and Jα gene pairing in (left) unique and (right) total sequences of T cells from a healthy control, P1, and P3. The most upstream Vα and most downstream Jα gene segments at the TRA locus are shaded in light pink. (B) Shannon [H] entropy diversity index of unique T-cell reads. (C) Representation of the frequency of 1000 most represented clonotypes among all clonotypes in T cells from 3 controls, P1, and P3. (D) Percentage of (left) unique and (right) total clonotypes containing hydrophobic amino acid residues at positions 6 and 7 (P6 and P7) of the TRA-CDR3. Results are shown for 3 healthy controls (gray circles), P1 (red square), and P3 (red triangle). Bars represent mean values ± SD (B,D). *P < .05.](https://ash.silverchair-cdn.com/ash/content_public/journal/blood/138/12/10.1182_blood.2020008629/4/m_bloodbld2020008629f5.png?Expires=1769171972&Signature=JWeV2oZ13zHJ9FkjxGJhVVqGlkAuJ5TFxWQV15pFwE6sBhZTgrvDQc3PGjRUS-5hXyQLX4gRYe9V5kqZ61PrQZheFzE6ZcEnQTBl-vA2O4dRKK2fv5q1SckL1wfi31-ZxntllQGQXnV-fw9zkmH5HFKAdL7sVz1y5L4HTTdMdwauYuzMJmcqHS1DxG7q~xCIRu50jKleLcGGiHr5ZiufW51VLlCCyTFfBtlMzhskK0l0IMTTo4r4aRbbi9C9Hi30OColVKVlBgfwKzdJIW4GMEOzshX2qDGIG3ix-njBYE7fZZx9tr7m0YJb2Qq~Tk4bkHlzv6~xAWm-~Ui09rnARQ__&Key-Pair-Id=APKAIE5G5CRDK6RD3PGA)
HTS analysis of the TRA repertoire in SASH3-mutated patients. (A) Representative heat maps depicting Vα and Jα gene pairing in (left) unique and (right) total sequences of T cells from a healthy control, P1, and P3. The most upstream Vα and most downstream Jα gene segments at the TRA locus are shaded in light pink. (B) Shannon [H] entropy diversity index of unique T-cell reads. (C) Representation of the frequency of 1000 most represented clonotypes among all clonotypes in T cells from 3 controls, P1, and P3. (D) Percentage of (left) unique and (right) total clonotypes containing hydrophobic amino acid residues at positions 6 and 7 (P6 and P7) of the TRA-CDR3. Results are shown for 3 healthy controls (gray circles), P1 (red square), and P3 (red triangle). Bars represent mean values ± SD (B,D). *P < .05.
HTS analysis of the TRA repertoire in SASH3-mutated patients. (A) Representative heat maps depicting Vα and Jα gene pairing in (left) unique and (right) total sequences of T cells from a healthy control, P1, and P3. The most upstream Vα and most downstream Jα gene segments at the TRA locus are shaded in light pink. (B) Shannon [H] entropy diversity index of unique T-cell reads. (C) Representation of the frequency of 1000 most represented clonotypes among all clonotypes in T cells from 3 controls, P1, and P3. (D) Percentage of (left) unique and (right) total clonotypes containing hydrophobic amino acid residues at positions 6 and 7 (P6 and P7) of the TRA-CDR3. Results are shown for 3 healthy controls (gray circles), P1 (red square), and P3 (red triangle). Bars represent mean values ± SD (B,D). *P < .05.
T-cell progenitors derived from SASH3-deficient bone marrow CD34+ cells display decreased survival
To further investigate whether SASH3 deficiency affects T-cell development and/or survival, we differentiated CD34+CD3– hematopoietic stem and progenitor cells from P2 and a healthy control in the ATO system.19 Although the CD34+ cells from P2 were able to progress through various stages of T-cell differentiation, both the frequency and the absolute count of TCRαβ+CD3+ cells generated after 6 weeks of culture were significantly decreased compared with what was observed in control cells (Figure 6A). Importantly, a reduced number of cells per ATO was also observed at earlier stages of differentiation (Figure 6B), and this defect was associated with impaired cell cycle progression and increased apoptosis, as shown by decreased frequency of cells in the S and G2/M phases, higher frequency of hypodiploid cells (Figure 6C), and increased proportion of annexin V+DAPI+ late apoptotic cells (Figure 6D).
Given that CXCL12/CXCR4 signaling participates in the control of human precursor pre-TCRβ selection, cell survival, and proliferation and in the egress of mature thymocytes to the periphery,29-31 we stained cells that differentiated in the ATO system for CXCR4 surface expression. Decreased CXCR4 expression was observed in P2 at all stages of differentiation but more prominently in more mature CD5+CD7lo and TCRαβ+CD3+ cells (Figure 6E). A similar defect in CXCR4 expression was also observed in peripheral blood T cells from P1 and P2 (supplemental Figure 8). Finally, β-selection promotes metabolic activity in developing thymocytes, including activation of the mTOR pathway and upregulation of CD98 surface expression. A slight reduction of CD98 expression was detected on the surface of differentiating CD1a+CD7– cells from P2 (Figure 6F), similar to that reported in Sly1−/− and Sly1Δ/Δ mice.10 Overall, in vitro T-cell differentiation data suggest that SASH3 could also play an important role in survival and activation of human thymocytes.
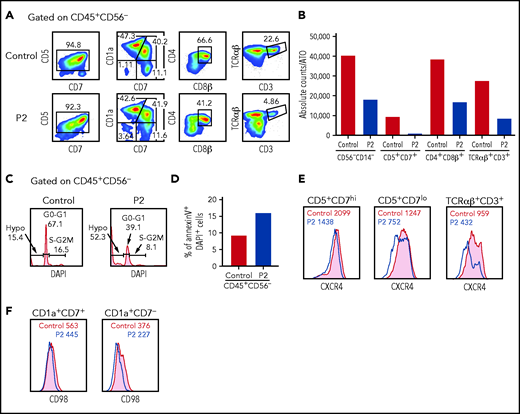
In vitro T-cell differentiation of CD34+CD3– hematopoietic stem and progenitor cells (HSPCs). (A) Representative analysis of T-cell differentiation of control and P2 HSPCs after 6 weeks of culture in an ATO system. The fluorescence-activated cell sorter (FACS) plots show expression of early and late markers of T-cell differentiation upon gating on LIVE/DEAD–CD45+CD14–CD56–CD34– cells. (B) The bar graph shows the absolute cell counts per ATO of indicated cell subsets in control (gray bar) and P2 (red bar) samples analyzed in parallel. (C) The histograms show distribution of cells in the different phases of cell cycle after cell staining for DNA content (DAPI) in control and P2, upon gating on total CD45+CD56– cells. (D) The bar graph shows the frequency of apoptotic cells after staining with annexin V and DAPI in control and P2 upon gating on total CD45+CD56– cells. (E-F) FACS plot representing CXCR4 and CD98 expression in more immature (CD5+CD7hi or CD1a+CD7+) and more mature (CD5+CD7lo or CD1a+CD7–) developing T-cell progenitors and in mature TCRαβ+CD3+ cells.
In vitro T-cell differentiation of CD34+CD3– hematopoietic stem and progenitor cells (HSPCs). (A) Representative analysis of T-cell differentiation of control and P2 HSPCs after 6 weeks of culture in an ATO system. The fluorescence-activated cell sorter (FACS) plots show expression of early and late markers of T-cell differentiation upon gating on LIVE/DEAD–CD45+CD14–CD56–CD34– cells. (B) The bar graph shows the absolute cell counts per ATO of indicated cell subsets in control (gray bar) and P2 (red bar) samples analyzed in parallel. (C) The histograms show distribution of cells in the different phases of cell cycle after cell staining for DNA content (DAPI) in control and P2, upon gating on total CD45+CD56– cells. (D) The bar graph shows the frequency of apoptotic cells after staining with annexin V and DAPI in control and P2 upon gating on total CD45+CD56– cells. (E-F) FACS plot representing CXCR4 and CD98 expression in more immature (CD5+CD7hi or CD1a+CD7+) and more mature (CD5+CD7lo or CD1a+CD7–) developing T-cell progenitors and in mature TCRαβ+CD3+ cells.
Rescue of SASH3 deficiency
To confirm that the abnormalities observed were a result of SASH3 deficiency, we performed rescue experiments using 2 experimental approaches. First, we generated a cellular model of SASH3 deficiency by disrupting the SASH3 gene in Jurkat cells using CRISPR. Upon delivery of a pair of guide RNAs targeting the SASH3 gene and subcloning in limiting dilution, a clone was identified that carried a homozygous 602nt deletion encompassing part of exon 1 and intron 1 of the SASH3 gene (supplemental Figure 9A). Western blot analysis confirmed lack of SASH3 expression (supplemental Figure 9B). Compared with the parental Jurkat cell line, SASH3−/− Jurkat cells demonstrated decreased cell proliferation (supplemental Figure 9C). We then generated a bicistronic lentiviral vector that allowed expression of SASH3 and mCherry (SASH3 vector), as well as a vector that allowed expression of mCherry alone (mock vector). Transduction of the SASH3−/− Jurkat cells with the SASH3 vector rescued SASH3 expression and corrected the defect of cell proliferation to levels comparable to the parental mock-transduced Jurkat cell line (Figure 7A-B). In parallel, we used the same vectors to transduce primary T cells from a healthy control and P2. Approximately 25% of the cells were transduced with the SASH3 vector as shown by mCherry expression (Figure 7C), yet this was sufficient to rescue PLCγ1 phosphorylation upon in vitro stimulation with anti-CD3 plus anti-CD28 (Figure 7D).

Lentivirus-mediated correction of SASH3 deficiency in Jurkat cells and in patient-derived T cells. (A) Top: transduction efficiency as measured by mCherry expression in wild-type (WT) and SASH3−/− Jurkat cells upon transduction with mock and SASH3 lentivirus (LV) vectors. Bottom: western blot showing reconstitution of SASH3 protein expression in SASH3−/− Jurkat cells upon transduction with the SASH3 LV vector. (B) Correction of the proliferative defect of SASH3−/− Jurkat cells upon transduction with the SASH3 LV vector. WT, wild-type Jurkat; mock, SASH3−/− Jurkat cells transduced with mock LV vector; SASH3, SASH3−/− Jurkat cells transduced with the SASH3 LV vector. Statistical significance was assessed with 2-way analysis of variance for multiple comparisons. (C) Dot-plot showing transduction efficiency (as measured by mCherry expression) in control- and P2-derived T-cell blasts upon transduction with mock and SASH3 LV vectors. (D) Top: western blot showing reconstitution of PLCγ1 phosphorylation in SASH3-transduced P2 T cells upon in vitro stimulation with anti-CD3 and anti-CD28. Bottom: densitometric quantification of phosphorylated PLCγ1 (pPLCγ1) protein expression in mock- and SASH3-transduced P2 T cells in 2 distinct experiments (identified by different symbols). Results are expressed as pPLCγ1:glyceraldehyde-3-phosphate dehydrogenase (GAPDH) ratio and compared with what was detected in mock-transduced control cells, which were given a value of 1.0.
Lentivirus-mediated correction of SASH3 deficiency in Jurkat cells and in patient-derived T cells. (A) Top: transduction efficiency as measured by mCherry expression in wild-type (WT) and SASH3−/− Jurkat cells upon transduction with mock and SASH3 lentivirus (LV) vectors. Bottom: western blot showing reconstitution of SASH3 protein expression in SASH3−/− Jurkat cells upon transduction with the SASH3 LV vector. (B) Correction of the proliferative defect of SASH3−/− Jurkat cells upon transduction with the SASH3 LV vector. WT, wild-type Jurkat; mock, SASH3−/− Jurkat cells transduced with mock LV vector; SASH3, SASH3−/− Jurkat cells transduced with the SASH3 LV vector. Statistical significance was assessed with 2-way analysis of variance for multiple comparisons. (C) Dot-plot showing transduction efficiency (as measured by mCherry expression) in control- and P2-derived T-cell blasts upon transduction with mock and SASH3 LV vectors. (D) Top: western blot showing reconstitution of PLCγ1 phosphorylation in SASH3-transduced P2 T cells upon in vitro stimulation with anti-CD3 and anti-CD28. Bottom: densitometric quantification of phosphorylated PLCγ1 (pPLCγ1) protein expression in mock- and SASH3-transduced P2 T cells in 2 distinct experiments (identified by different symbols). Results are expressed as pPLCγ1:glyceraldehyde-3-phosphate dehydrogenase (GAPDH) ratio and compared with what was detected in mock-transduced control cells, which were given a value of 1.0.
Discussion
We have described a novel X-linked inborn errors of immunity that results from SASH3 deficiency in 4 unrelated males with a history of recurrent infections and autoimmunity. The pathogenic role of the 3 SASH3 variants identified in the patients is supported by multiple lines of evidence. In particular, none of the variants has been previously reported, and their CADD scores are significantly higher than the MSC score for the SASH3 gene. Furthermore, the nonsense variants detected in P2, P3, and P4 are associated with loss of protein expression. The remaining missense variant detected in P1 is predicted to alter a PKA phosphorylation site and is associated with clinical and immunologic features similar to those in P2, P3, and P4. The immunologic defects identified in the patients recapitulate many of the abnormalities previously reported in Sly1−/− and Sly1Δ/Δ mice, including CD4+ T-cell lymphopenia, impaired in vitro T-cell proliferation via CD3 and CD28 (partially rescued by exogenous IL-2), decreased expression of CD71, CD98, and GLUT1 nutrient receptors, impairment of cell cycle progression, and increased T-cell apoptosis.4,10,32
Our data demonstrate that human SASH3 deficiency has a drastic global effect on TCR signaling, affecting phosphorylation of both proximal (ZAP-70, LAT, and PLCγ1) and distal (ERK, S6, AKT, IκBα) elements. In contrast, no defects of Akt, Erk1/2, and IκBα phosphorylation had been observed upon TCR engagement in Sly1Δ/Δ mice.4 The reason for this difference remains unknown, but the profound functional T-cell defects identified in patients likely play a major role in the increased susceptibility to recurrent infections observed in the patients.
Previous studies have shown that Sly1−/− and Sly1Δ/Δ mice have a reduced number of double-positive and single-positive thymocytes.10 By studying in vitro T-cell differentiation of CD34+ hematopoietic stem and progenitor cells, we have documented the decreased viability and the cell cycle progression of T-cell progenitors associated with generation of a reduced number of CD3+TCRαβ+ cells in patients compared with controls. Along with skewed usage of TRAV and TRAJ genes in peripheral T cells, these data are consistent with impaired thymocyte survival in patients with SASH3 deficiency. Skewed usage of TRAV genes in SASH3-deficient patients was associated with severe reduction of MAIT cells. Lack of this subset has been recently reported in a patient with MR1 deficiency and persistent warts.33 Therefore, it is possible that susceptibility to severe warts observed in SASH3-deficient patients may reflect multiple mechanisms, including impaired T-cell function, lack of MAIT cells, and NK-cell lymphopenia.
We also found that circulating T cells in patients are enriched in TCR clonotypes containing hydrophobic amino acids at the apex of CDR3, a molecular signature of self-reactive T cells.34 We had previously shown that thymocytes with molecular signatures of self-reactivity are depleted during T-cell development in both humans and mice,13 and an increased frequency of peripheral TCR clonotypes with molecular signatures of self-reactivity has been reported in various forms of CID with increased risk of autoimmune cytopenias.13,35 Together, these observations suggest that SASH3 deficiency may also perturb mechanisms of negative selection in the thymus, thereby facilitating development of autoimmunity. Other immunologic abnormalities may also contribute to the high frequency of autoimmune manifestations in SASH3 deficiency, including numerical and functional Treg defects, persistence of infectious triggers, and abnormalities of B-cell function. In this regard, it is noteworthy that an expanded population of plasmablasts was detected in the bone marrow of both patients who underwent this procedure, and that 3 of the patients had a reduced proportion of circulating Tregs. P3 and P4 have been diagnosed with cutaneous and hepatic granulomas, another manifestation of immune dysregulation that has been frequently reported in patients with CID.36-38
NK-cell development and function are also affected by SASH3 deficiency. In particular, NK cells from SASH3-mutated patients were present in low numbers and showed impaired IFN-γ secretion. This observation is interesting in light of the positive correlation between SASH3 levels and IFN-γ production by human NK cells reported in a previous study.9 A low count of NKp46+CD3– NK cells and impaired IFN-γ production has also been reported in Sly1−/− mice.9 Decreased NK-cell viability was observed in mutant mice, and this defect was rescued by crossing Sly1−/− mice to Bcl2 transgenic mice.9 It is tempting to speculate that NK cells from SASH3-deficient patients have a survival defect, consistent with similar abnormalities observed in T cells. Rescue experiments in SASH3-deficient Jurkat cells and in patient-derived primary T cells have led to correction of the proliferation defect and of PLCγ1 phosphorylation, respectively, arguing for the causal role of SASH3 deficiency in determining the phenotype.
In summary, we have described a novel form of X-linked CID that results from SASH3 deficiency. Future studies are needed to more precisely define the role played by SASH3 in TCR signaling and NK-cell development and function, but our data demonstrate homogeneity of the clinical phenotype, with increased susceptibility to infections and treatment-refractory multilineage autoimmune cytopenias associated with immunologic abnormalities that involve all lymphoid lineages. Although this condition permits survival into adulthood, severe complications may lead to a fatal outcome. Bone marrow chimera experiments in mice have demonstrated that the immune deficiency resulting from SASH3 deficiency is hematopoietic cell-autonomous and can be corrected by bone marrow transplantation.4 A similar option should be considered for patients with this condition.
Acknowledgments
The authors thank the patients and their families for participating in this study, and Lawrence E. Samelson and Valarie Barr for their thoughtful comments and suggestions. The authors acknowledge Elena Cho, Debbie Draper, and Meng Truong for their clinical and protocol-related support; Jia Yan, Michael Setzer, Michael Kamen, Kathleen Jevtich, Yunting Yu, Celine Hong, Leila Jamal, and Haley Hullfish of the Centralized Sequencing Initiative; Gary Fahle, Yan Su, Sujin Hwang, and Julie Niemela from the Department of Laboratory Medicine; Justin B. Lack, Vasudev Kuram, and Susan M. Huse from the National Institute of Allergy and Infectious Diseases (NIAID) Collaborative Bioinformatics Resource and the Frederick National Laboratory for Cancer Research; and Jason Barnett, Xi Cheng, Yongjie Fan, Ke Huang, Krishnaveni Kaladi, Eric Karlins, Zhiwen Li, Joseph Mackey, Andrew Oler, Daniel Veltri, Sandhya Xirasagar, Lingwen Zhang, and Satishkumar Ranganathan from the Genomic Research Integration System (GRIS), Office of Cyber Infrastructure and Computational Biology, NIAID, National Institutes of Health (NIH). The GRIS system was developed, in part, with funding from NIAID, NIH, Department of Health and Human Services, under Bioinformatics and Computational Biosciences Branch Support Services Contract HHSN316201300006W/HHSN27200002 (to MSC, Inc)
This project was supported by grants from the NIH/Division of Intramural Research, NIAID, (1 ZIA AI001222-02) (L.D.N.) and the National Cancer Institute (HHSN261200800001E).
The content of this publication does not necessarily reflect the views or policies of the US Department of Health and Human Services, nor does mention of trade names, commercial products, or organizations imply endorsement by the United States Government.
Authorship
Contribution: O.M.D., L.D.N., and P.M.M. conceived and designed experiments; O.M.D., J.R.E.B., H.S.K., M.T.Z., A.K.D., M.B., F.P., D.F., B.P., S.M., T.K., N.R.D., J.J.L., M.P., K.R.C., and J.E.N., performed the experiments; O.M.D., J.R.E.B., H.S.K., M.T.Z., A.K.D., M.B., F.P., L.D.N., B.P., S.M., N.T., S.R.D., R.G., M.B.S., J.J.L., S.M.H., J.S., D.B.K., R.U., S.D.R., and M.A.W. analyzed the data; J.R.E.B., D.H.M., I.C., L.K.D., D.V., A.A., K.M.-H., and A.F.F. provided clinical care; M.T.Z., N.T., M.P., D.B.K., R.U., S.M.H., S.D.R., P.M.M., and L.D.N. provided reagents, materials, and analysis tools; O.M.D., J.R.E.B., and L.D.N wrote the manuscript; and all authors read and approved the final manuscript.
Conflict-of-interest disclosure: The authors declare no competing financial interests.
Correspondence: Luigi D. Notarangelo, Laboratory of Clinical Immunology and Microbiology, National Institute of Allergy and Infectious Diseases, National Institutes of Health, Building 10 CRC, Room 5-3950, MSC 1456, 10 Center Dr, Bethesda, MD 20892; e-mail: luigi.notarangelo2@nih.gov.
The online version of this article contains a data supplement.
Whole-exome sequencing and T-cell receptor repertoire data have been deposited in Web-based repositories. Accession numbers are provided in the supplemental Material. Whole-exome sequencing data have been deposited in the Database of Genotypes and Phenotypes (dbGaP) for P1, P2 and P3, and in BioProject for P4. T-cell receptor repertoire data have been deposited in the Adaptive Biotechnology website (https://www.adaptivebiotech.com/). Accession numbers are provided in the supplemental Material.

This feature is available to Subscribers Only
Sign In or Create an Account Close Modal