

TO THE EDITOR:
We recently participated in an international effort proposing SF3B1 mutant (MT) myelodysplastic syndromes (MDS) as a unique disease subtype under the auspice of the international working group (IWG) for the prognosis of MDS.1 We hereby validate those findings among an independent large cohort that was not included in the original proposal.
Among 1729 MDS patients with known SF3B1 mutation status at our institution, 320 patients (19%) harbored SF3B1 MT (Table 1). Similar to the IWG cohort, patients with SF3B1 MT were slightly older, had predominantly lower-risk disease, ring sideroblast phenotype, lower myeloblast percentage, and preserved neutrophil/platelet counts. No gender difference was observed in our cohort. The landscape of concomitant somatic mutations was similar to the IWG cohort, with notable distinct comutation rates in SF3B1 MT vs wild-type (WT) populations (Table 1).
Baseline characteristics based on SF3B1 MT
| Comparing all SF3B1 MT vs SF3B1 WT (n = 1729) | Comparing SF3B1 MT pts based on new IWG proposal criteria (n = 320) | |||||
|---|---|---|---|---|---|---|
| SF3B1 MT n = 320 | SF3B1 WT n = 1409 | P | SF3B1 MT IWG (n = 175) | SF3B1 MT non-IWG (n = 145) | P | |
| Age (mean), y | 70 | 68.5 | .037 | 69 | 71 | .2 |
| Gender (male) | 62% | 64% | .55 | 67% | 56% | .04 |
| Race (white) | 94% | 90% | .13 | 96% | 92% | .38 |
| t-MDS | 9% | 17% | .001 | 10% | 9% | .7 |
| WHO 2016 | <.005 | <.005 | ||||
| MDS-SLD | 3% | 9% | 5% | 1% | ||
| MDS-MLD | 8% | 26% | 8% | 8% | ||
| MDS-SLD-RS | 31% | 1% | 48% | 11% | ||
| MDS-MLD-RS | 25% | 3% | 37% | 9% | ||
| MDS-EB-1 | 6% | 17% | 0 | 13% | ||
| MDS-EB-2 | 6% | 21% | 0 | 12% | ||
| MDS-U | 1% | 2% | 1% | 1% | ||
| AML | 2% | 12% | 0 | 5% | ||
| MDS/MPN | 3% | 5% | 0 | 8% | ||
| del(5q) | 2% | 4% | 0 | 4% | ||
| MDS/MPN-RS-T | 13% | 0 | 0 | 28% | ||
| IPSS-R | <.005 | <.005 | ||||
| Very low | 28% | 10% | 35% | 18% | ||
| Low | 52% | 25% | 61% | 43% | ||
| Intermediate | 10% | 21% | 4% | 17% | ||
| High | 5% | 19% | 0 | 11% | ||
| Very high | 5% | 25% | 0 | 11% | ||
| AML transformation | 12.5% | 38% | <.005 | 4.7% | 22% | <.005 |
| Myeloblasts | 3.2% | 8% | <.005 | 1.5% | 5% | <.005 |
| Hgb (g/dL) | 11.3 | 9.7 | .007 | 12.9 | 9.0 | .2 |
| ANC | 3.5 | 2.4 | .008 | 2.8 | 4.3 | .01 |
| Platelets | 287 | 129 | <.005 | 242 | 341 | <.005 |
| Mutation landscape | ||||||
| TET-2 | 31% | 21% | <.005 | 33% | 28% | .5 |
| DNMT3A | 21% | 13% | <.005 | 21% | 21% | .96 |
| ASXL-1 | 15% | 22% | <.005 | 11% | 19% | .15 |
| IDH-1 | 1.9% | 3.3% | .001 | 1% | 3% | .5 |
| IDH-2 | 2% | 5% | <.005 | 2% | 2% | .9 |
| SRSF2 | 4% | 13% | <.005 | 3% | 6% | .3 |
| U2AF1 | 1.6% | 12% | <.005 | 1% | 1% | .7 |
| ZRSR2 | 5% | 6% | .001 | 1% | 1% | .6 |
| EZH-2 | 5% | 7.5% | <.005 | 0 | 11% | <.005 |
| RUNX-1 | 12% | 9% | .001 | 0 | 21% | <.005 |
| ETV-6 | 1.6% | 4% | .007 | 2% | 1% | .9 |
| TP53 | 4.7% | 21% | <.005 | 0 | 10% | <.005 |
| CBL | 1.9% | 3% | .007 | 2% | 2% | .9 |
| NRAS | 1.9% | 3.8% | <.005 | 1% | 3.4% | .2 |
| SETBP1 | 3.8% | 4.3% | .1 | 3.5% | 4% | .9 |
| JAK-2 | 8.5% | 3.4% | <.005 | 6% | 12% | .16 |
| MPL | 2.2% | 1.2% | .026 | 2% | 1% | .8 |
Number of somatic mutations tested using the standard Illumina platform, 70% included ≥54 gene panels with a minimum 13-gene panel.
ANC, absolute neutrophil count; Hgb, hemoglobin; MDS-U, MDS-unclassified; MPN, myeloproliferative neoplasm; pts, patients; RS-T, RS with thrombocytosis; WHO, World Health Organization.
The median overall survival (OS) for SF3B1 MT MDS patients was 84 months (95% confidence interval [CI], 68-100) compared with 31 months for WT patients (95% CI, 28-34; P < .005). The rate of acute myeloid leukemia (AML) transformation was 12.5% for SF3B1 MT patients compared with 38% for SF3B1 WT (P < .005). There was no difference in OS among SF3B1 MT and WT in patients with >5% myeloblasts (median OS, 24 vs 20 months; P = .17).
Data on variant allele frequency (VAF) were reported in 234 SF3B1 MT patients. The mean VAF was 32.3%. The hazard ratio (HR) for OS was 0.66 (95% CI, 0.43-0.1; P = .065) for SF3B1 VAF >30% compared with ≤30%, although this was not independently associated with favorable OS after adjusting for the revised international prognostic scoring system (IPSS-R) (HR, 0.74; 95% CI, 0.47-1.16; P = .2 ). There was no difference in the rate of AML transformation in patients with high vs low VAF (9% vs 13%; P = .3). There was no difference in mean SF3B1 VAF between MDS–single lineage dysplasia (SLD)/multilineage dysplasia (MLD), MDS–ring sideroblasts (RS), and MDS–excess blasts (EB) (29, 32, and 30, respectively; P = .2).
Confirming the IWG proposal among patients with SF3B1 MT, presence of >5% myeloblasts (median OS, 24 vs 94 months; P < .005), complex karyotype (median OS, 13 vs 89 months; P < .005), presence of del(5q)/−5 isolated or complex (median OS, 24 vs 92 months; P < .005), presence of del7/−7 (median OS, 51 vs 86 mo; P = .026), and chromosome 3 abnormalities (median OS, 37 vs 89 months; P = .01) was associated with worse outcome. In our cohort, SF3B1 MT was associated with worse outcome among patients with isolated del5q MDS. Among 63 isolated del(5q) MDS classified by the World Health Organization 2016 criteria in patients with molecular data available, 6 patients (10%) harbored SF3B1 MT (median VAF 38.9%) with no concomitant TP53 MT. SF3B1 MT patients had a significantly shorter median OS compared with WT (23.9 vs 83.5 months; P = .001).
RUNX1 MT was associated with worse OS and higher AML transformation among SF3B1 MT patients. The median OS for concomitant RUNX1/SF3B1 MT patients was 40 months (95% CI, 33-47 months) compared with 94 months (95% CI, 73-115 months) for RUNX1 WT/SF3B1 MT (P < .001), and the rate of AML transformation was 33% vs 10.5% (P = .001) (Figure 1A-B). The HR for mortality was 1.96 (95% CI, 1.1-3.4) in the presence of RUNX-1 MT after adjusting for IPSS-R (P = .019). EZH-2 MT was associated with a trend for worse OS (median OS, 55 months; 95% CI, 23-88 months) for EZH-2/SF3B1 MT compared with 84 months for EZH-2WT/SF3B1 MT (95% CI, 66-109 months; P = .06). In our database, only 15 patients (4%) had TP53 concomitant MT, and no difference in median OS was observed, although a higher AML transformation was identified (33% vs 11%; P = .039).
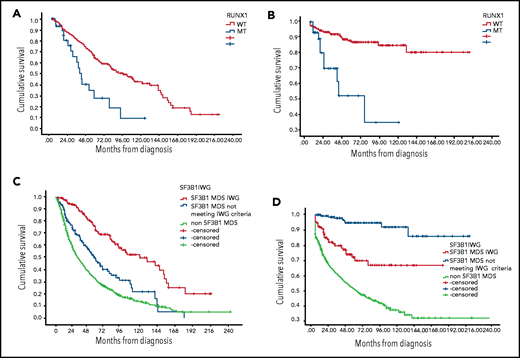
Kaplan-Meier estimates of overall survival and leukemia-free survival. (A) OS based on RUNX-1 MT status among SF3B1 MT MDS patients. (B) Leukemia-free survival based on RUNX-1 MT status among SF3B1 MT MDS patients. (C) OS based on SF3B1 mutation status by new proposal IWG criteria. (D) Leukemia-free survival based on SF3B1 mutation status by new proposal IWG criteria.
Kaplan-Meier estimates of overall survival and leukemia-free survival. (A) OS based on RUNX-1 MT status among SF3B1 MT MDS patients. (B) Leukemia-free survival based on RUNX-1 MT status among SF3B1 MT MDS patients. (C) OS based on SF3B1 mutation status by new proposal IWG criteria. (D) Leukemia-free survival based on SF3B1 mutation status by new proposal IWG criteria.
SF3B1 MT retained favorable prognostic value in the context of therapy-related MDS (t-MDS). Of the 272 t-MDS patients in our database with known SF3B1 mutation status, 31 were SF3B1-MT (11%). Of those with SF3B1-MT, 60% were classified as MDS-RS compared with 4.1% of those with SF3B1-WT t-MDS. Complex cytogenetics were seen in 37.4% vs 10.3% of patients with SF3B1-WT vs SF3B1-MT (P = .009). TP53 mutation was seen in 36.1% of SF3B1-WT patients vs 10% of SF3B1-MT patients (P = .004). The AML transformation rate was 34.4% in SF3B1-WT t-MDS compared with 12.9% t-MDS SF3B1-MT (P = .016). Median OS was 17 months in SF3B1-WT t-MDS vs 43 months in SF3B1-MT t-MDS (P = .004).
We have previously reported that presence of ring sideroblasts with myeloblasts >5% was highly concordant with the presence of TP53 mutation occurring in 80% of SF3B1-WT patients.2
In terms of response to treatment, patients with SF3B1 MT had higher hematological improvement rate (HI) to erythroid stimulating agents; 92 out of 188 patients (49%) achieved HI compared with 105 out of 314 (33%) SF3B1 WT patients (P = .001). There was a trend for lower response to hypomethylating agents; the HI rate was 49 out of 155 (32%) among SF3B1 MT patients compared with 359 out of 915 (39%) among SF3B1 WT patients (P = .07). There was no difference in response to lenalidomide, with an HI rate of 22 out of 105 (23%) and 35 out of 145 (24%), respectively, for SF3B1 MT and WT (P = .55). We previously reported SF3B1 MT was a negative predictor of response to immunosuppressive therapy.3 Luspatercept was recently approved for MDS-RS patients, a population highly enriched with SF3B1 MT.4 In the PACE-MDS study, the HI rate was 77% among SF3B1 MT patients compared with 40% among those with WT.5 Recent data from a phase 2 clinical study with imetelstat suggest potential preferential and disease modifying activity among small number of SF3B1 MT patients.6
We reclassified our patients based on IWG SF3B1 new proposal criteria.1 Notably, 175 patients were classified as MDS-SF3B1 by the new proposed criteria, 145 patients with SF3B1 MT not meeting the new proposed criteria, and 1412 SF3B1 WT MDS patients (Table 1). The median OS was 120 months (95% CI, 77-164 months), 55 months (95% CI, 42-69 months), and 31.5 months (95% CI, 28-35 months), respectively (P < .005; Figure 1C). The median leukemia-free survival was not reached among all SF3B1 MT patients compared with 58 months among SF3B1 WT patients (P < .005) (Figure 1D). The rate of AML transformation was 4.7%, 22%, and 38%, respectively (P < .005). t-MDS was observed in 10%, 9%, and 17% of the 3 above-mentioned groups. Excluding t-MDS, the median OS was 142, 57, and 36 months, respectively (P < .005). There was no difference in response rates to erythroid stimulating agents, hypomethylating agents, and lenalidomide between patients classified as SF3B1 by IWG new criteria compared with other SF3B1 MT MDS.
In summary, we confirm and validate the findings reported recently by Malcovati et al that SF3B1 MT MDS should be classified as a unique disease entity based on the new proposal criteria. Furthermore, we demonstrate that SF3B1 MT retained favorable prognostic value in the context of t-MDS and worse outcome among patients with isolated del(5q), and we compliment the IWG findings by reporting responses to current available therapies based on SF3B1 MT status.
Authorship
Contribution : R.K. wrote the manuscript, designed the research study, and analyzed and interpreted data; V.V., O.C., N.A.A., and D.S. collected and analyzed data and approved the final manuscript; E.P. designed the research study and approved the final manuscript; and D.A.S. reviewed data, designed the research study, and approved the final manuscript.
Conflict-of-interest disclosure : R.K. received speakers bureau fees from Jazz Pharma, Bristol Myers Squibb, and Agios and honoraria from Jazz Pharma, Bristol Myers Squibb, Geron, AbbVie, Incyte, Acceleron, and Novartis. E.P. received honoraria from Novartis and research funding from Incyte, Kura, and BMS. D.S. received research funding from Celgene and Jazz Pharma and consultancy fees from Agios, Bristol Myers Squibb, Celyad Oncology, Incyte, Intellia Therapeutics, Kite Pharma, Novartis, and Syndax. The remaining authors declare no competing financial interests.
Correspondence: Rami Komrokji, H. Lee Moffitt Cancer Center, 12902 Magnolia Dr, CSB7, Tampa, FL 33612; e-mail: rami.komrokji@moffitt.org.

This feature is available to Subscribers Only
Sign In or Create an Account Close Modal