

Key Points
Letermovir prophylaxis may be associated with decreased polyfunctional CMV-specific T-cell immunity after HCT.
COMPASS is an analytical tool that can effectively measure polyfunctional CMV-specific T-cell immune responses.

Abstract
Decreased cytomegalovirus (CMV)-specific immunity after hematopoietic cell transplantation (HCT) is associated with late CMV reactivation and increased mortality. Whether letermovir prophylaxis-associated reduction in viral exposure influences CMV-specific immune reconstitution is unknown. In a prospective cohort of allogeneic HCT recipients who received letermovir, we compared polyfunctional CMV-specific T-cell responses to those of controls who received PCR-guided preemptive therapy before the introduction of letermovir. Thirteen-color flow cytometry was used to assess T-cell responses at 3 months after HCT following stimulation with CMV immediate early-1 (IE-1) antigen and phosphoprotein 65 (pp65) antigens. Polyfunctionality was characterized by combinatorial polyfunctionality analysis of antigen-specific T-cell subsets. Use of letermovir and reduction of viral exposure were assessed for their association with CMV-specific T-cell immunity. Polyfunctional T-cell responses to IE-1 and pp65 were decreased in letermovir recipients and remained diminished after adjustment for donor CMV serostatus, absolute lymphocyte count, and steroid use. Among letermovir recipients, greater peak CMV DNAemia and increased viral shedding were associated with stronger CD8+ responses to pp65, whereas the CMV shedding rate was associated with greater CD4+ responses to IE-1. In summary, our study provided initial evidence that letermovir may delay CMV-specific cellular reconstitution, possibly related to decreased CMV antigen exposure. Evaluating T-cell polyfunctionality may identify patients at risk for late CMV infection after HCT.
Introduction
Letermovir is a recently approved antiviral shown to decrease clinically significant cytomegalovirus (CMV) infection after hematopoietic cell transplantation (HCT) in a phase 3, randomized, placebo-controlled trial.1 Similar outcomes have been reported in patients excluded from the original primary efficacy analysis because of the presence of detectable CMV DNA by polymerase chain reaction (PCR) at the time of randomization.2 Despite its favorable clinical efficacy, there appeared to be an increased rate of late first clinically significant CMV events after discontinuation of letermovir prophylaxis in the original randomized controlled trial.1 In an earlier study, a similar effect had been seen with ganciclovir prophylaxis.3
Decreased CMV-specific cellular immunity at 3 months after HCT is associated with increased late CMV reactivation and mortality.4 Multiple clinical factors can affect the tempo of CMV-specific immune recovery after HCT, including donor CMV serostatus, high-dose steroids, lymphopenia, and stem cell source.5,6 Donor CMV serostatus has been shown to be more predictive of T-cell reconstitution after HCT than graft-versus-host disease (GVHD), highlighting the profound impact that donor-derived cellular immunity has on overall cytolytic immune function.4,7-9 A key factor in delayed immune reconstitution during antiviral prophylaxis is reduced antigen exposure as a result of decreased CMV reactivation, as was shown with ganciclovir prophylaxis.10 Subclinical CMV reactivation during ganciclovir prophylaxis appeared to be associated with improved CMV-specific CD8+ and CD4+ T-cell responses at the end of prophylaxis.5,10
Studies of CMV-specific T-cell responses after HCT initially relied on measuring lymphoproliferative or monofunctional cellular responses.5,9,11 However, as multiparameter flow cytometry has evolved, so has the complexity of the accompanying immune function data.12 Combinatorial polyfunctionality analysis of antigen specific T-cell subsets (COMPASS) is a novel analytical tool that integrates polyfunctional cellular responses into a single score that can be used to summarize antigen-specific T-cell responses. Previously validated in human immunodeficiency virus and tuberculosis vaccine responses,13 COMPASS has been used to assess the significance of donor-derived human herpesvirus 6 (HHV-6) T-cell immunity,14 and it may also be useful in evaluating polyfunctional CMV-specific immunity.
To determine the influence of letermovir prophylaxis on CMV-specific immune reconstitution after HCT as a possible mechanism for increased late CMV reactivation, we performed a prospective cohort study to compare polyfunctional CMV-specific T-cell responses in letermovir recipients with those in patients who received PCR-guided preemptive therapy before the introduction of letermovir. We used COMPASS for the first time in the HCT setting to determine if CMV-specific cellular immunodeficiency is associated with increased late CMV reactivation after HCT.
Methods
Study population
CMV-seropositive allogeneic HCT recipients who underwent HCT at our center after the debut of letermovir as standard CMV prophylaxis in October 2018 were considered for immune function testing. Additional eligibility criteria included age 18 years or older, undergoing first allogeneic HCT (prior autologous HCT permitted), documented as having received letermovir prophylaxis, and had no reactivated CMV requiring preemptive antiviral therapy before initiation of letermovir prophylaxis. An additional cohort of CMV-seropositive allogeneic HCT recipients who received PCR-guided preemptive therapy from October 2010 through 2017 were included as controls.
Letermovir prophylaxis was initiated per institutional standard practice at day 8 after high-risk non–cord HCT, day 1 after high-risk cord HCT, or engraftment after low-risk HCT. “High-risk” status was defined as having an umbilical cord blood stem cell source, haploidentical donor, HLA-mismatched donor after T-cell–depleted HCT, or having required ≥1 mg/kg of prednisone or its equivalent for treatment of acute GVHD.
Cumulative steroid exposure in the first 100 days after HCT was calculated as the area under the curve (AUC) of a daily weight–based dose of prednisone-equivalent steroid (milligrams per kilogram), using the trapezoid rule (area = 0.5 × [base_1 + base_2] × height).
The study was approved by the Fred Hutchinson Cancer Research Center Institutional Review Board, and the patients provided written informed consent before sample collection.
Virologic surveillance
Before November 2019, patients underwent weekly CMV DNA PCR surveillance in the first 100 days after HCT with a PCR assay developed at the University of Washington with a limit of detection (LoD) and limit of quantitation (LoQ) of 7.5 IU/mL and 25 IU/mL, respectively.15 After this period, CMV monitoring was performed with the Abbott RealTime Assay with LoD 31.2 IU/mL and LoQ 50 IU/mL.16 After post-HCT day 100, CMV DNA PCR surveillance was performed through our clinics or by primary providers. Letermovir recipients who reactivated CMV in the first 100 days after HCT were treated with ganciclovir or valganciclovir per institutional standards when CMV DNA PCR was ≥500 IU/mL after low-risk HCT or ≥150 IU/mL after high-risk HCT. Controls were treated when CMV DNA PCR was ≥150 IU/mL after low-risk HCT or ≥50 IU/mL after high-risk HCT. After post-HCT day 100, all patients received antiviral therapy when CMV DNA PCR was ≥500 IU/mL.
For virologic outcome analyses, any detectable CMV DNAemia and CMV DNA PCR ≥150 IU/mL and ≥500 IU/mL were examined as a composite with CMV end-organ disease, according to the most recent international definitions given by the CMV Drug Development Forum.17 For regression analyses, “clinically significant CMV infection” was defined as a composite of either CMV DNA PCR ≥500 IU/mL or CMV end-organ disease. “Late CMV infection” was defined as having occurred after post-HCT day 100. Late CMV disease was assessed by review of the electronic medical record and via our long-term follow-up database. Peak CMV DNAemia was the highest CMV DNA PCR value in the first 100 days after HCT, and viral shedding rate was calculated as the percentage of detectable CMV PCR tests collected.3
Peripheral blood mononuclear cell isolation and stimulation
Peripheral blood mononuclear cells (PBMCs) were isolated by density centrifugation from prospectively collected blood in heparinized tubes at 3 months after HCT. The cells were processed within 24 hours of collection and cryopreserved in liquid nitrogen in 90% fetal bovine serum (HyClone) and 10% dimethyl sulfoxide (DMSO; Sigma Aldrich).
The cells were thawed in enriched medium (RPMI–HEPES; Gibco) with 10% fetal bovine serum (Sigma-Aldrich), 2 mmol/L l-glutamine (Gibco), 10 000 IU/L penicillin, and 10 mg/L streptomycin (Gibco). Cells were plated at 1 × 10⁶ cells per well in 96-well round-bottom plates and stimulated for 6 hours at 37°C with 5% CO2, as well as with the costimulatory antibodies anti-CD28 (1 μg/mL; BD Biosciences), anti-CD49d (1 μg/mL; Beckman Coulter), and Brefeldin A (10 μg/mL; Sigma-Aldrich)/Golgistop (0.1%; BD Biosciences) mix.
Cells were stimulated with CMV immediate early-1 (IE-1) or phosphoprotein 65 (pp65) 15mer peptide libraries overlapping by 11 amino acids (1 μg/mL; JPT Peptide Technologies) resuspended in DMSO, as well as with Staphylococcus aureus enterotoxin B (SEB; 0.05 μg/mL; Sigma-Aldrich) and DMSO (the peptide diluent) as nonspecific positive and negative controls, respectively. Cells were stained with anti-CD107a phycoerythrin-cyanine 7 (PECy7; BD Biosciences) during stimulation. Of note, not all samples were stimulated with all antigens because of insufficient cell quantities; therefore, stimulation with pp65 and controls was prioritized.
Intracellular cytokine staining
A 13-color intracellular cytokine staining assay that includes 5 functional CMV-specific T-cell markers was modified from previously published protocols.18-20 After they were stored at 4°C overnight, the cells were incubated in a dark at room temperature in EDTA (20 mM) for 20 minutes, followed by Live/Dead Fixable Aqua Viability Dye (Life Technologies) for 30 minutes in 1× phosphate-buffered saline (PBS; Gibco). They were washed with 1× PBS and FACS wash buffer (BD Biosciences) with 0.5% bovine serum albumin in 1× PBS; incubated in the dark for 30 minutes with a fluorescent antibody cocktail containing anti-CCR7 Alexa Fluor 700 (BD Biosciences), anti-CD45RA BrilliantViolet 605 (Biolegend), ant-CD57 PECy5 (Lifespan), and anti-CD14 QDot 800 (Invitrogen); washed twice with FACS wash buffer and permeabilized for 20 minutes with 1× Cytofix/Cytoperm solution (BD Biosciences). They were then washed twice with Cytofix/Cytoperm buffer (BD Biosciences) and stained 30 minutes in the dark with a fluorescent antibody cocktail containing anti-CD3 PE-CF594 (Beckman Coulter), anti-CD4 allophycocyanin-Alexa Fluor 750 (Beckman Coulter), anti-CD8 blue-violet 650 (Biolegend), anti-granzyme B Alexa Fluor 647 (BD Biosciences), anti-interferon-γ (IFN-γ) violet 450 (BD Biosciences), anti-tumor necrosis factor-α (TNF-α) fluorescein isothiocyanate (FITC, eBioscience), and anti-interleukin-2 (IL-2) phycoerythrin (PE; BD Biosciences) in Cytofix/Cytoperm buffer. They were then washed twice with Cytofix/Cytoperm buffer, fixed with 1% paraformaldehyde (Sigma-Aldrich), and stored at 4°C overnight for flow analysis.
Flow cytometry and analysis
Cell acquisition (at 100 000–400 000 events) was performed on an LSR-II flow cytometer (BD Biosciences) within 24 hours of staining. All antibodies were titrated for optimum performance, and appropriate single-color compensation and fluorescence minus-one controls were run. Data were analyzed with FlowJo software, version 9.9.6. The gating strategy is shown in supplemental Figure 1, available on the Blood Web site. Absolute lymphocyte counts (ALCs) drawn at approximately day 90 after HCT were used to calculate absolute polyfunctional CMV-specific T-cell counts (cells per μL).
Polyfunctionality and COMPASS
Polyfunctional CMV-specific T-cell subsets were defined as those expressing IFN-γ plus ≥1 functional markers (ie, CD107a, TNF-α, IL-2, or granzyme B) after background subtraction of the DMSO control, similar to previous studies.18-20 Positive responses were defined as T-cell frequencies greater than 0.05% above background and at least threefold greater than the DMSO response in the same cell population.20 Simplified Presentation of Incredibly Complex Evaluations (SPICE), version 6.1, was used to graphically compare relative proportions of polyfunctional T-cell phenotypes based on the total number of functional markers expressed.21
COMPASS was used to measure CMV-specific polyfunctionality according to previously published methods.13 Functionality scores (FSs) and polyfunctionality scores (PFSs) were generated based on the degree of functional expression. Both measure the proportion of antigen-specific cell subsets detected among all possible functional combinations, whereas PFS weighs cell subsets by the degree of their polyfunctionality (ie, cell subsets that respond to antigen with a greater number of markers receive higher weights), an immunologic trait correlated with better outcomes in vaccine studies.22,23 To ensure robustness of COMPASS results, total CD4+ and CD8+ collected events were each tested a priori at 1000 and 2000 events and COMPASS was run using multiple different seeds (data not shown). Based on these results, thresholds of 1000 events were selected for both CD4+ and CD8+, and smaller samples were excluded by COMPASS. Excluded samples were set to a score of 0 for statistical purposes.
Statistical analysis
Absolute polyfunctional CMV-specific T-cell counts (defined by the phenotype IFN-γ plus ≥1 functional markers), COMPASS PFS and FS in letermovir recipients and controls were compared using Wilcoxon rank-sum tests. CD4+ and CD8+ T-cell responses were analyzed separately, as both have been implicated in protection from CMV reactivation.5,10,24 Multivariable linear regression was used to assess the relationships between CMV-specific T-cell immunity and treatment group as well as with viral load kinetics that have direct links to CMV clinical outcomes after HCT (peak CMV DNAemia and viral shedding rates).3 Regression models were adjusted for factors known to be associated with CMV-specific immune reconstitution: CMV donor status, ALC, and cumulative steroid exposure in the first 100 days after HCT.4,25 The cumulative incidence of clinically significant CMV infection in the first 100 days after HCT and from post-HCT days 100 through 270 was determined with death as a competing risk in the in the “cmprsk” package in the R Statistical Computing Environment, version 3.5.0. Multivariable Cox regression was used to estimate the association of upper quartile polyfunctional CMV-specific T-cell responses with late clinically significant CMV infection.
Results
Study population
Fifty-six letermovir recipients and 93 controls were evaluated by immune function testing. Demographics for both groups are listed in Table 1. More patients had underlying acute leukemia among letermovir recipients (P = .03), and letermovir recipients received more reduced intensity conditioning, whereas controls received more nonmyeloablative conditioning (P < .001). The median day of neutrophil engraftment was post-HCT day 17 (range, days 10-34) for letermovir recipients and post-HCT day 16 (range, days 6-31) for controls given preemptive antiviral therapy. The median PBMC collection day for both groups was 89 days after HCT (range, days 84-104) and the median ALC was 760 cells per mm3 (range, 70-12 330). The median cumulative steroid AUC for both groups was 28.8 mg/kg per day (range, 4.8-191.3). The median days of letermovir initiation and discontinuation were post-HCT day 20 (range, days 1-64) and post-HCT day 98 (range, days 13-110) respectively. The median duration of letermovir exposure was 78 days (range, 7-105 days). Eight patients discontinued letermovir before post-HCT day 90, primarily because of CMV reactivation requiring preemptive treatment (n = 5) or drug-drug interactions (n = 2). Nine patients died during follow-up from days 100 through 270 after HCT (3 letermovir recipients, 6 control).
Patient characteristics
| Variables | Letermovir (n = 56) | Control (n = 93) | P* |
|---|---|---|---|
| Age, median (range) | 53.9 (19.5-74.1) | 53.2 (19.9-73.2) | .72 |
| Sex, n (%) | |||
| Male | 35 (63) | 56 (60) | .78 |
| Female | 21 (38) | 37 (40) | |
| Cell source, n (%) | |||
| BM/cord | 11 (20) | 12 (13) | .27 |
| PBSC | 45 (80) | 81 (87) | |
| HLA matching, n (%) | |||
| Matched related | 12 (21) | 31 (33) | .29 |
| Matched unrelated | 31 (55) | 45 (48) | |
| Other | 13 (23) | 17 (18) | |
| Donor CMV serostatus, n (%) | |||
| Negative | 40 (71) | 57 (61) | .21 |
| Positive | 16 (29) | 36 (39) | |
| Underlying disease | |||
| AML/ALL | 29 (52) | 31 (33) | .03 |
| Other | 27 (48) | 62 (67) | |
| Conditioning, n (%) | |||
| Myeloablative | 34 (61) | 48 (52) | <.001 |
| Nonmyeloablative | 8 (14) | 38 (41) | |
| Reduced intensity | 14 (25) | 7 (8) | |
| ALC (cells per mm3), n (%) | |||
| ≤300 | 14 (25) | 12 (13) | .06 |
| >300 | 42 (75) | 81 (87) | |
| Acute GVHD, n (%) | |||
| Grade 0-1 | 18 (32) | 32 (34) | .78 |
| Grade 2-4 | 38 (68) | 61 (66) | |
| HCT Risk-type, n (%) | |||
| High | 17 (30.4) | 22 (23.7) | .44 |
| Low | 39 (69.6) | 71 (76.3) | |
| Steroid AUC by day 100 (mg/kg per day), median (range) | 25.6 (6.5-104.3) | 30.1 (4.8-193.6) | .14 |
| Peak CMV DNAemia by day 100 (log10 IU/mL), median (range) | 0.0 (0.0-3.6) | 2.3 (0.0-4.5) | <.001 |
| CMV shedding rate by day 100 (% PCR with detectable CMV DNA), median (range) | 0.0 (0.0-0.7) | 0.3 (0.0-0.9) | <.001 |
ALL, acute lymphoblastic leukemia; AML, acute myelogenous leukemia; BM, bone marrow; PBSC, peripheral blood stem cell.
Fisher’s exact test or Wilcoxon rank-sum test, as applicable.
CMV reactivation and disease
The cumulative incidence of CMV infection from days 0 to 270 after HCT in letermovir recipients and controls is shown (Figure 1). Twenty-three letermovir recipients and 75 controls reactivated CMV at any level in the first 100 days after HCT, whereas 3 letermovir recipients and 31 controls had CMV DNAemia ≥500 IU/mL. Two letermovir recipients and 5 controls who underwent “high-risk” HCT had low-level CMV reactivation in the first 8 days after HCT. Two letermovir recipients and 8 controls were diagnosed with CMV disease (8 gastrointestinal, 1 pneumonia, 1 central nervous system), and all had viral reactivation before diagnosis of CMV. The distribution of weekly CMV DNAemia in both groups from post-HCT weeks 1 through 14 is shown, and it was generally higher and occurred at increased rates in preemptive therapy recipients (supplemental Figure 2).
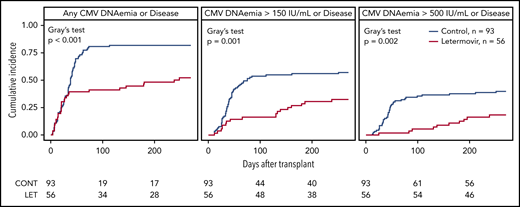
Cumulative incidence of CMV infection in the first 270 days after HCT. The cumulative incidence of CMV infection from days 0 through 270 after HCT in letermovir recipients and controls with preemptive treatment. A positive viral event was defined as a composite of CMV end-organ disease or CMV PCR DNAemia: at any level, ≥150 IU/mL, or ≥500 IU/mL for the assay used. Death was treated as a competing risk. Note that only a proportion of patients in both groups had late (after post-HCT day 100) CMV DNA PCR results available for analysis (36 letermovir recipients, 75 controls). Patients without late CMV DNA PCR surveillance were censored only if they did not have late CMV disease data available via review of the electronic medical record or our long-term follow-up database.
Cumulative incidence of CMV infection in the first 270 days after HCT. The cumulative incidence of CMV infection from days 0 through 270 after HCT in letermovir recipients and controls with preemptive treatment. A positive viral event was defined as a composite of CMV end-organ disease or CMV PCR DNAemia: at any level, ≥150 IU/mL, or ≥500 IU/mL for the assay used. Death was treated as a competing risk. Note that only a proportion of patients in both groups had late (after post-HCT day 100) CMV DNA PCR results available for analysis (36 letermovir recipients, 75 controls). Patients without late CMV DNA PCR surveillance were censored only if they did not have late CMV disease data available via review of the electronic medical record or our long-term follow-up database.
Thirty-nine letermovir recipients and 75 controls had late CMV DNA PCR or CMV end-organ disease data available for analysis. Of those patients, 19 letermovir recipients and 45 controls had late CMV reactivation at any level on post-HCT days 100 through 270, whereas 6 letermovir recipients and 12 controls had CMV DNAemia ≥500 IU/mL. Three letermovir recipients and 7 controls were diagnosed with late CMV (8 gastrointestinal, 2 pneumonia) at median day 238 (range, days 130-264) and day 158 (range, days 108-254) post-HCT, respectively. One letermovir recipient and 5 controls had viral reactivation before diagnosis of late CMV disease. We examined the cumulative incidence of CMV disease after day 100 in both groups and found no difference (P = .55).
Letermovir is associated with decreased CMV-specific polyfunctional T-cell responses
First, we compared the proportion of CMV-specific T-cell functional phenotypes based on the total number of functional markers expressed in both treatment groups (Figure 2). Granzyme B monofunctional responses were excluded, as some T-cell subsets are known to express this marker constitutively.26 The relative proportion of polyfunctional responses appeared greater than monofunctional responses in both groups.
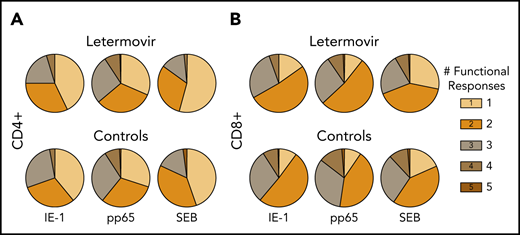
Relative proportion of functional CMV-specific T-cell phenotypes. The proportion of CMV-specific CD4+ (A) and CD8+ (B) T-cell subset phenotypes based on the total number of functional markers expressed at approximately day 90 after HCT in letermovir recipients and preemptive therapy recipients. Responses were measured after stimulation with CMV IE-1, pp65, or SEB (positive control). Granzyme B monofunctional cytokine responses were excluded from these charts, as some cell subsets have been noted to express this cytokine constitutively (see "Letermovir is associated with decreased CMV-specific polyfunctional responses").
Relative proportion of functional CMV-specific T-cell phenotypes. The proportion of CMV-specific CD4+ (A) and CD8+ (B) T-cell subset phenotypes based on the total number of functional markers expressed at approximately day 90 after HCT in letermovir recipients and preemptive therapy recipients. Responses were measured after stimulation with CMV IE-1, pp65, or SEB (positive control). Granzyme B monofunctional cytokine responses were excluded from these charts, as some cell subsets have been noted to express this cytokine constitutively (see "Letermovir is associated with decreased CMV-specific polyfunctional responses").
Next, we described the proportion of positive polyfunctional CMV-specific T-cell responses in each treatment group. The proportion of positive T-cell responses to IE-1 and pp65 were decreased in letermovir recipients (Figure 3). Absolute polyfunctional T-cell counts specific to both antigens (defined by the phenotype IFN-γ plus ≥1 functional marker) were lower in letermovir recipients (Figure 4). COMPASS-generated PFS to each antigen were diminished in letermovir recipients (Figure 5). Interestingly, there appeared to be a notable amount of general immunosuppression to our nonspecific control antigen (SEB) among letermovir recipients. Similar findings were seen when comparing FSs (supplemental Figure 3). COMPASS PFSs were not appreciably different according to ALC and steroid AUC, however, scores appeared to be increased in patients with CMV-seropositive donors (supplemental Figure 4).
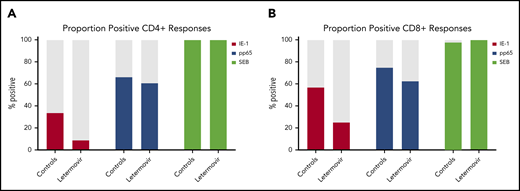
Proportion of patients with positive polyfunctional CMV-specific T-cell responses. The proportion of patients with positive polyfunctional CMV-specific CD4+ (A) and CD8+ (B) T-cell responses (defined by the phenotype IFN-γ plus ≥1 functional marker) at approximately day 90 after HCT in letermovir recipients and preemptive therapy recipients. Positive T-cell responses were further defined as those >.05% above background and at least threefold greater than the DMSO (negative control) response in the same cell subset.
Proportion of patients with positive polyfunctional CMV-specific T-cell responses. The proportion of patients with positive polyfunctional CMV-specific CD4+ (A) and CD8+ (B) T-cell responses (defined by the phenotype IFN-γ plus ≥1 functional marker) at approximately day 90 after HCT in letermovir recipients and preemptive therapy recipients. Positive T-cell responses were further defined as those >.05% above background and at least threefold greater than the DMSO (negative control) response in the same cell subset.
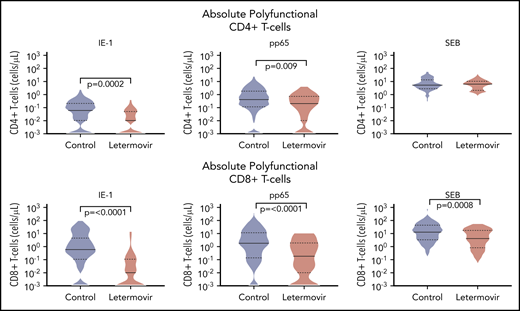
Absolute polyfunctional CMV-specific T-cell counts. Absolute polyfunctional CMV-specific CD4+ (top) and CD8+ (bottom) T-cell counts (defined by the phenotype IFN-γ plus ≥1 functional marker) at approximately day 90 after HCT in letermovir recipients and preemptive therapy recipients. Cytokine responses were generated after stimulation with CMV IE-1, pp65, and SEB (positive control) antigens. Violin plots show frequency distribution of data and width of sections represent the proportion of a specific value (ie, wider sections represent a greater proportion). Dotted lines represent the interquartile range and solid lines represent the median. Comparisons were made by Wilcoxon rank-sum tests.
Absolute polyfunctional CMV-specific T-cell counts. Absolute polyfunctional CMV-specific CD4+ (top) and CD8+ (bottom) T-cell counts (defined by the phenotype IFN-γ plus ≥1 functional marker) at approximately day 90 after HCT in letermovir recipients and preemptive therapy recipients. Cytokine responses were generated after stimulation with CMV IE-1, pp65, and SEB (positive control) antigens. Violin plots show frequency distribution of data and width of sections represent the proportion of a specific value (ie, wider sections represent a greater proportion). Dotted lines represent the interquartile range and solid lines represent the median. Comparisons were made by Wilcoxon rank-sum tests.
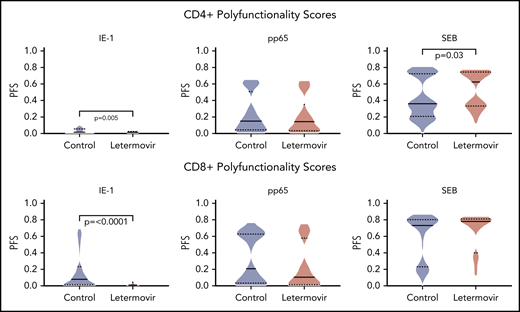
COMPASS-generated PFSs. COMPASS-generated PFSs at approximately day 90 after HCT in letermovir recipients and preemptive therapy recipients. Cytokine responses were generated after stimulation with CMV IE-1, pp65, and SEB (positive control) antigens. Violin plots show frequency distribution of data and width of sections represent the proportion of a specific value (ie, wider sections represent a greater proportion). Dotted lines represent the interquartile range, and solid lines represent the median. Comparisons were made by Wilcoxon rank-sum tests.
COMPASS-generated PFSs. COMPASS-generated PFSs at approximately day 90 after HCT in letermovir recipients and preemptive therapy recipients. Cytokine responses were generated after stimulation with CMV IE-1, pp65, and SEB (positive control) antigens. Violin plots show frequency distribution of data and width of sections represent the proportion of a specific value (ie, wider sections represent a greater proportion). Dotted lines represent the interquartile range, and solid lines represent the median. Comparisons were made by Wilcoxon rank-sum tests.
Multivariable linear regressions were used to evaluate the association between polyfunctional T-cell responses (defined by the phenotype IFN-γ plus ≥1 functional marker) and treatment group adjusted for donor CMV serostatus, ALC, and steroid AUC. Absolute polyfunctional CMV-specific CD4+ and CD8+ IE-1 T cells remained significantly diminished in letermovir recipients after adjustment (P = .01). There was a trend toward decreased CD4+ and CD8+ pp65 T cells among letermovir recipients. Analyses were repeated, using COMPASS PFSs as outcome variables, and yielded similar results with the exception of pp65 responses (supplemental Table 1).
CMV reactivation in letermovir recipients is associated with enhanced polyfunctional T-cell responses
To establish how viral kinetics may influence CMV-specific immune reconstitution in letermovir prophylaxis recipients, we examined the association of peak CMV DNAemia and CMV viral shedding rates in the first 100 days after HCT with CMV-specific T-cell immunity. Polyfunctional CMV-specific T-cell responses were evaluated as binary (ie, positive vs negative) outcomes. Both peak CMV DNAemia and viral shedding were significantly associated with positive polyfunctional T-cell responses to pp65 (supplemental Figure 5).
To test these associations in a more formal manner, we evaluated the association of viral kinetics with CMV-specific T-cell polyfunctionality, using multivariable linear regression adjusted for CMV donor serostatus, ALC, and steroid AUC. We found that viral peak and shedding were associated with CMV-specific CD4+ and CD8+ T-cell polyfunctionality as measured by the phenotype IFN-γ plus ≥1 functional marker and COMPASS PFS (Figure 6). These relationships were strongest for viral shedding and CD8+ T-cell responses, especially pp65 CD8+ responses by IFN-γ plus ≥1 functional marker (P ≤ .001) and COMPASS PFS (P = .02). CMV shedding was associated with increased CD4+ and CD8+ COMPASS FS to CMV IE-1 and pp65 antigens (supplemental Figure 6).
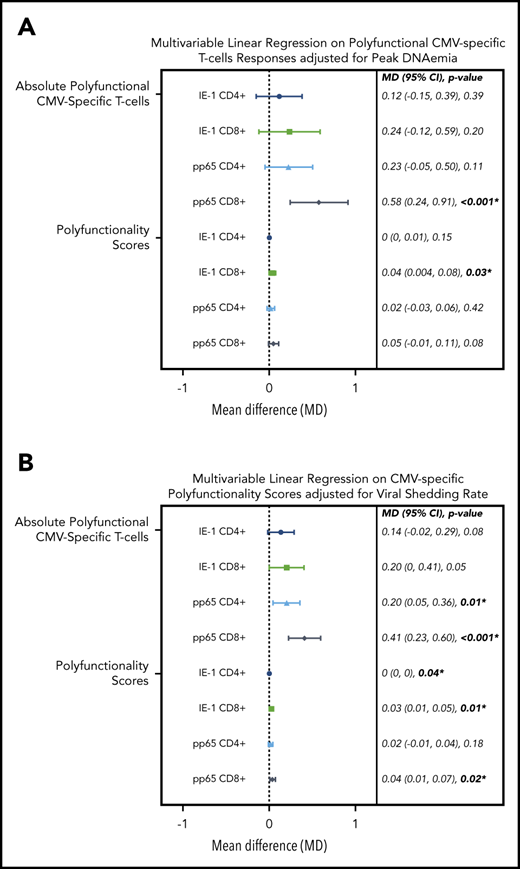
Multivariable linear regression of CMV kinetics with polyfunctional CMV-specific T-cell immunity in letermovir recipients only. Multivariable linear regression examining association of viral kinetics in the first 100 days after HCT with polyfunctional CMV-specific T-cell responses at approximately day 90 after HCT among letermovir recipients only. Comparisons were adjusted for either peak CMV DNAemia (in log10 scale as a continuous variable; A) or CMV shedding (percentage of positive CMV PCR tests collected per 10% increase; B). CMV-specific polyfunctionality was measured as absolute polyfunctional T-cell counts (as defined by the phenotype IFN-γ plus ≥1 functional marker; top half) or COMPASS PFSs (bottom half). Adjustments were also made for donor CMV serostatus, ALCs (≤300 vs >300 cells per mm3), and AUC of daily weight-based prednisone equivalent steroid dose in the first 100 days after HCT. CI, confidence interval; MD, mean difference.
Multivariable linear regression of CMV kinetics with polyfunctional CMV-specific T-cell immunity in letermovir recipients only. Multivariable linear regression examining association of viral kinetics in the first 100 days after HCT with polyfunctional CMV-specific T-cell responses at approximately day 90 after HCT among letermovir recipients only. Comparisons were adjusted for either peak CMV DNAemia (in log10 scale as a continuous variable; A) or CMV shedding (percentage of positive CMV PCR tests collected per 10% increase; B). CMV-specific polyfunctionality was measured as absolute polyfunctional T-cell counts (as defined by the phenotype IFN-γ plus ≥1 functional marker; top half) or COMPASS PFSs (bottom half). Adjustments were also made for donor CMV serostatus, ALCs (≤300 vs >300 cells per mm3), and AUC of daily weight-based prednisone equivalent steroid dose in the first 100 days after HCT. CI, confidence interval; MD, mean difference.
Higher COMPASS scores are associated with lower rates of late CMV reactivation
We created heat maps to visualize differences in the proportion of patients with higher degree functional T-cell subsets in patients with late CMV surveillance follow-up available for analysis. Patients were grouped according to the presence of late, clinically significant CMV infection. Functionality was quantified by the posterior probability that a specific functional T-cell subset was present at the subject level. As a representative example, we show the probabilities of functional CD8+ T-cell subsets in response to stimulation with IE-1 (Figure 7). These heat maps suggest an increased proportion of patients with 4 and 5 functional IE-1 CD8+ T-cell subsets among patients who did not have late CMV reactivation. Similar findings were seen with IE-1 CD4+, pp65 CD8+, and pp65 CD4+ T-cell responses among patients without CMV reactivation (supplemental Figure 7).
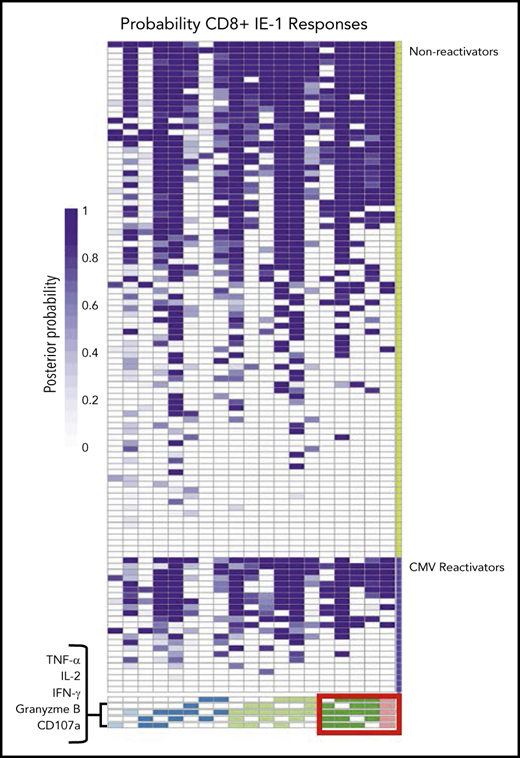
Functional CMV IE-1 CD8+T-cell subsets at the patient level grouped by late CMV reactivation. Heat map of functional CD8+ T-cell subsets to CMV IE-1 at the subject level quantified by posterior probabilities and grouped according to late CMV reactivation (lower violet) vs no reactivation (upper green). Rows correspond to entire antigen-specific cell subsets represented in a patient and are arranged in columns by ascending degree of functionality, from 1 (light blue) to 5 (pink) functions. Individual heat map cells show posterior probability that a functional antigen-specific cell subset is present in a patient and are color coded from white (0) to dark purple (1). For example, patient 1 has a probability of 1.0 of possessing CD8+ T cells that express all 5 functional markers but 0 probability of possessing CD8+ T cells expressing only TNF-α and granzyme B in response to stimulation with IE-1. Note the increased proportion of subjects with 4 and 5 functional type CD8+ T-cell subsets (red box) among patients without CMV reactivation vs those with CMV reactivation.
Functional CMV IE-1 CD8+T-cell subsets at the patient level grouped by late CMV reactivation. Heat map of functional CD8+ T-cell subsets to CMV IE-1 at the subject level quantified by posterior probabilities and grouped according to late CMV reactivation (lower violet) vs no reactivation (upper green). Rows correspond to entire antigen-specific cell subsets represented in a patient and are arranged in columns by ascending degree of functionality, from 1 (light blue) to 5 (pink) functions. Individual heat map cells show posterior probability that a functional antigen-specific cell subset is present in a patient and are color coded from white (0) to dark purple (1). For example, patient 1 has a probability of 1.0 of possessing CD8+ T cells that express all 5 functional markers but 0 probability of possessing CD8+ T cells expressing only TNF-α and granzyme B in response to stimulation with IE-1. Note the increased proportion of subjects with 4 and 5 functional type CD8+ T-cell subsets (red box) among patients without CMV reactivation vs those with CMV reactivation.
To determine the association of COMPASS PFS with late, clinically significant CMV reactivation after HCT, we modeled time to clinically significant CMV reactivation with a Cox proportional-hazards model on upper quartile PFSs adjusted for CMV reactivation in the first 100 days after HCT (supplemental Figure 8). The upper quartile of absolute polyfunctional CD4+ and CD8+ T cells (defined by the phenotype IFN-γ plus ≥1 functional marker) and COMPASS PFS to pp65 and IE-1 were associated with decreased risk of late CMV reactivation, and the relationship was strongest for CD8+ responses to IE-1. In addition, we performed unadjusted, univariable Cox regression analyses of upper quartile T-cell responses (ie, IFN-γ plus ≥1 functional marker, COMPASS PFS, and FS) on late CMV disease; however, none of the results of those analyses was statistically significant (data not shown).
Discussion
In this study, letermovir prophylaxis appeared to be associated with delayed polyfunctional CMV-specific cellular immune reconstitution at 3 months after HCT compared with preemptive antiviral therapy. Specifically, polyfunctional CMV-specific T-cell subsets (defined by the phenotype IFN-γ plus ≥1 functional marker) as well as COMPASS PFS responses to CMV IE-1 and pp65 antigens were decreased in letermovir prophylaxis recipients. Absolute polyfunctional CMV-specific CD8+ T-cell subsets and COMPASS PFS responses to IE-1 and pp65 remained diminished after adjustment for other factors that impact cellular reconstitution. In addition, peak CMV DNAemia and CMV viral shedding were associated with greater absolute polyfunctional CMV-specific T-cell counts and PFSs among letermovir recipients. Finally, high (ie, upper quartile) polyfunctional CMV-specific CD4+ and CD8+ T-cell responses were associated with decreased risk of late CMV reactivation, and IE-1 CD8+ PFSs trended toward a decreased risk of late, clinically significant CMV infection.
Letermovir prophylaxis after HCT is associated with fewer toxicities compared with ganciclovir and other antivirals.1 Although letermovir does not cause obvious myelosuppression, little is known about functional immune changes that could be attributable to letermovir prophylaxis after HCT. Our study provides initial evidence that letermovir prophylaxis may be associated with a delay in polyfunctional CMV-specific cellular immune reconstitution. Multiple in vitro studies have shown that ganciclovir decreases lymphocyte proliferation in response to CMV antigen exposure.27-29 Despite decreased lymphoproliferation, polyfunctional CMV-specific T-cell responses remained largely unaffected by ganciclovir in vitro, and similar findings were reported for the antiviral maribavir.30
Letermovir restricts CMV replication by inhibiting CMV terminase, as compared with other antivirals (ie, ganciclovir) that disrupt DNA synthesis through inhibition of CMV polymerase.31,32 Although cytotoxic CMV-specific T-cell responses are not entirely dependent on endogenous viral gene expression,33 it is known that IE-1 expression remains uninhibited despite ganciclovir exposure and thus is readily accessible to host immune responses.10,34 Conversely, it is postulated that letermovir prophylaxis may allow for the development of more robust antiviral immune responses to later gene products (ie, pp65) given its novel mechanism.35 In vitro studies of letermovir support this concept by noting greater CMV DNA replication compared with ganciclovir and comparable CMV protein expression to placebo.32 It is plausible that accumulation of these proteins drive the proportional differences in T-cell responses that we observed in response to both antigens in letermovir recipients.
Furthermore, CMV prophylaxis leads to lower levels of CMV reactivation after HCT, which in turn leads to overall decreased viral exposure. Subclinical CMV reactivation on ganciclovir prophylaxis has been associated with stronger CMV-specific T-cell responses after HCT.5 We observed similar findings among letermovir prophylaxis recipients and provide greater resolution of the effects of CMV reactivation on CMV-specific T-cell polyfunctionality by adjusting for CMV kinetics after HCT. The observed decrease in absolute polyfunctional CD8+ T-cell responses to our nonspecific control antigen in letermovir recipients was unexpected. Because of the lack of evidence of letermovir-induced marrow suppression,1 it is possible that this was caused by imbalances within cohorts (eg, stem cell source, conditioning) given that SEB CD8+ PFSs were no different. In addition, SEB CD4+ PFSs were found to be higher in letermovir recipients.
Our study is the first, to our knowledge, to apply COMPASS to CMV-specific immunity, and it shows promise for identifying patients at risk for late, clinically significant CMV infection after HCT. COMPASS scores appeared complementary to previously used definitions of T-cell polyfunctionality (eg, IFN-γ plus ≥1 functional marker) and may be a useful analytical tool for evaluating multiple, CMV-specific T-cell functional responses simultaneously in an unbiased fashion. Using COMPASS, we observed the strongest association with decreased risk of late CMV infection in patients with upper quartile CD8+ PFS responses to IE-1. A similar observation of the protective effect of CD8+ T-cell responses to IE-1 against CMV reactivation was seen in other studies examining monofunctional IFN-γ responses after HCT.36,37 A study by Camargo et al12 described protective CMV-specific T-cell functional signatures against clinically significant CMV reactivation that could be further investigated with COMPASS.
It should be noted that a high COMPASS PFS was not always associated with lasting decreased risk of late CMV reactivation. For instance, 5 control patients had late clinically significant CMV reactivation despite having upper quartile COMPASS PFSs. Upon review, these patients had relapse of their underlying malignancy and/or reintroduction of immunosuppression. This outcome is in alignment with those in previous studies evaluating the association of CMV-specific T-cell immunity with late CMV infection6 and emphasizes the need to reexamine immunity after changes in the level of immunosuppression.
This study has limitations and strengths. First, the use of a nonrandomized comparative control cohort may make differences between groups in antigen responses difficult to interpret. Nevertheless, baseline characteristics, except underlying disease and conditioning, were similar between study groups. Furthermore, analyses were adjusted for other factors affecting CMV-specific T-cell reconstitution after HCT. Second, late CMV DNA PCR results were not available for all patients, partly because some letermovir recipients were part of a randomized controlled trial of at-home, dry-blood-spot CMV surveillance. Thus, our study was unable to examine the full impact of polyfunctional immunity after letermovir prophylaxis on late CMV infection because of the limited number of disease events. Finally, the differential protective role of IE-1 vs pp65 responses may not be readily interpretable because of overall small sample size.
In summary, letermovir prophylaxis was associated with decreased CMV-specific immune reconstitution after HCT in our study. CMV peak DNAemia and viral shedding were associated with stronger polyfunctional T-cell responses in letermovir recipients. Decreased CMV reactivation on letermovir prophylaxis provides a potential mechanism for the observed increase in clinically significant CMV infection after HCT in the original randomized controlled trial after the discontinuation of letermovir.1 COMPASS effectively measures polyfunctional CMV-specific T-cell responses, however, larger studies are needed to evaluate its effectiveness and accuracy in predicting CMV events. Measuring polyfunctional, CMV-specific T-cell immunity after HCT following the completion of letermovir prophylaxis or during periods of increased immunosuppression could be useful in predicting risk and help identify patients who may benefit from extended surveillance or prolonged prophylaxis.
Original data may be obtained by e-mail request to the corresponding author (mboeckh@fredhutch.org).
The online version of this article contains a data supplement.
The publication costs of this article were defrayed in part by page charge payment. Therefore, and solely to indicate this fact, this article is hereby marked “advertisement” in accordance with 18 USC section 1734.
There is a Blood Commentary on this article in this issue.
Acknowledgments
The authors thank Elsa Garnace for sample acquisition, Chris Davis for clinical data acquisition, and the Fred Hutch Vaccine and Infectious Disease Division (VIDD) administrative staff for support; the Boeckh Clinical Research team for tireless and extensive chart review; and the Fred Hutch VIDD/Infectious Disease Sciences (IDS) Biospecimen Repository for banking of research specimens.
This study was supported (in part) by US National Institutes of Health (NIH), National Heart, Lung, and Blood Institute grant K24 HL093294 (M.B.) and NIH, National Institute of Allergy and Infectious Diseases grant T32 AI118690 (D.Z.). Additional funding was provided by a Merck & Co Inc Investigator Study Program award (M.B).
Authorship
Contribution: D.Z. and M.B. were responsible for the design of this study; D.Z., M.B., and E.R.D. interpreted the data and performed the literature search; D.Z., E.R.D., and H.X. performed the data analyses and created the figures; D.Z., B.C.E., B.A., R.K., and T.S.-A. collected the data; and all authors contributed to the writing and revision of the paper and approved the final version.
Conflict-of-interest disclosure: All authors, except R.W., received grant support from The National Institutes of Health and Merck & Co Inc during the conduct of the study. E.R.D. received grants from Merck & Co Inc outside of the submitted work. R.K. received grants from the Bavarian Research Foundation during the conduct of the study. S.C.D. received grants from the Bill and Melinda Gates Foundation during the conduct of the study. M.B. has received grants and personal fees from Astellas, Gilead, Shire Pharmaceutical (now known as Takeda), VirBio, and Merck & Co Inc; grants from Lophius Biosciences; personal fees from GlaxoSmithKline, Moderna Therapeutics, Oxford Immunotec, Allovir, and SymBio; and personal fees and nonfinancial support from Helocyte and EvrysBio outside of the submitted work. The remaining author declares no competing financial interests.
Correspondence: Michael Boeckh, Fred Hutchinson Cancer Research Center, 1100 Fairview Ave, North Seattle, WA, 98109; e-mail: mboeckh@fredhutch.org.

This feature is available to Subscribers Only
Sign In or Create an Account Close Modal