

Key Points
Activated B cells that differentiate into plasmablasts downregulate the CD23 marker and IL-4 pathway after an initial IL-4 response.
CD23– cells, which are preplasmablasts, also lose CBLB expression and increase IRF4 levels to promote plasmablast differentiation.

Abstract
The terminal differentiation of B cells into antibody-secreting cells (ASCs) is a critical component of adaptive immune responses. However, it is a very sensitive process, and dysfunctions lead to a variety of lymphoproliferative neoplasias including germinal center–derived lymphomas. To better characterize the late genomic events that drive the ASC differentiation of human primary naive B cells, we used our in vitro differentiation system and a combination of RNA sequencing and Assay for Transposase-Accessible Chromatin with high-throughput sequencing (ATAC sequencing). We discovered 2 mechanisms that drive human terminal B-cell differentiation. First, after an initial response to interleukin-4 (IL-4), cells that were committed to an ASC fate downregulated the CD23 marker and IL-4 signaling, whereas cells that maintained IL-4 signaling did not differentiate. Second, human CD23– cells also increased IRF4 protein to levels required for ASC differentiation, but they did that independently of the ubiquitin-mediated degradation process previously described in mice. Finally, we showed that CD23– cells carried the imprint of their previous activated B-cell status, were precursors of plasmablasts, and had a phenotype similar to that of in vivo preplasmablasts. Altogether, our results provide an unprecedented genomic characterization of the fate decision between activated B cells and plasmablasts, which provides new insights into the pathological mechanisms that drive lymphoma biology.
Introduction
The production of antibody-secreting cells (ASCs) from B cells (that generate both cycling plasmablasts [PBs] and long-lived plasma cells [PCs]) is crucial for adaptive immunity and involves several complex molecular mechanisms that can be hijacked by tumoral processes that then give rise to germinal center (GC)–derived lymphomas.1-3 Terminal B-cell differentiation is an autonomous, stochastic process4,5 that occurs in the GC and outside the follicules.6 The collaboration of T cells and B cells has an impact on the rate of cell differentiation by modulating the levels of signals provided to the B cell.7,8 It was initially acknowledged that T follicular helper (Tfh) cells secreted interleukin-21 (IL-21), but these cells were subsequently shown to produce IL-4. In mice and in humans, IL-4 and IL-21 were shown to have both redundant and respective functions in B-cell differentiation that were linked to specific times and sites of action.9-13 Tfh cells are the dominant source of IL-4 in vivo; this cytokine drives B-cell expansion, maturation, and class switch recombination for murine and human antibodies. IL-4 activates STAT6 by phosphorylation, inducing expression of major histocompatibility complex class II, CD23 (encoded by FCER2), and the IL-4 receptor (IL-4R).14 This activation is critical for T-cell–dependent adaptive immune responses in vivo, as shown by the similar defects presented by Stat6 knockout (KO) and Il4ra KO mice.14,15 Tfh-produced IL-4 is also essential in follicular lymphoma16,17 in relation to activating STAT6 mutations18 and CD23 expression heterogeneity linked to differential prognosis.19 However, the mechanisms underlying the various actions of IL-4 have yet to be fully characterized, as well as whether these mechanisms are still active once B cells have committed to becoming PBs.
The cell identity distinction between B cells and PBs is maintained by mutually antagonistic interactions between regulatory factors20 ; of these, interferon regulatory factor 4 (IRF4) is essential for both GC B cells and PCs.21,22 In mice, GC B cells express Cbl/Cblb ubiquitin ligases that enable moderate B-cell receptor (BCR) and CD40L signals to promote B-cell clonal expansion and antibody affinity by mediating Irf4 protein ubiquitination and degradation. Once high affinity is achieved, strong BCR and CD40L signals induce a loss of Cbl/Cblb activities, which allows an increase in Irf4 protein levels and thus drives PB differentiation, GC egress, and high immunoglobulin production.23 It is not known whether this mechanism also operates in humans.
Our controlled in vitro model of human B-cell differentiation already enabled us to characterize the final steps in B cells to PB commitment on the molecular level8,24,25 and to demonstrate the role of 5-hydroxymethylation in this transition.25 We used this model in our study to characterize the precise time at which the fate of the B cell is decided. An integrated genomic analysis revealed that both the IL-4/STAT6 and CBLB ubiquitin ligase pathways are extinguished during the emergence of human PBs.
Methods
Additional details regarding the methods are given in supplemental Methods, available on the Blood Web site.
Purification of primary B cells
Peripheral blood mononuclear cells were obtained from the French Blood Bank (Établissement Français du Sang de Bretagne, Rennes, France). Healthy volunteers were recruited after approval by the French Ministry of Higher Education and Research (AC-2014-2315), and they provided informed consent in line with the Declaration of Helsinki. Human naive B cells (NBCs) were purified (purity >99%) by negative selection using magnetic cell separation (Miltenyi Biotech).
Cell culture and cytometry
Cell culture conditions, antibodies, flow cytometry, and fluorescence-activated cell sorting procedures have been described previously,24,25 except for the use of Violet Proliferation Dye 450 (BD Biosciences) to enable sorting of resting or proliferating day 4 cells (day 4hi/lo) and the use of the CaspGLOW Kit (eBioscience) to exclude active caspase-3–positive (apoptotic) cells. When indicated, cells were treated with the proteasome inhibitor MG132 (10 µM; Sigma-Aldrich) or cycloheximide (50 µg/mL; Sigma-Aldrich). Cytology analyses were done after May-Grünwald-Giemsa staining.
Phospho-STAT6 (pSTAT6) flow cytometry
On day 4, after 2 hours of starvation in fetal calf serum–free medium, cells were stimulated (or not) with 20 ng/mL IL-4 for 10 minutes, subsequently fixed with 1.6% paraformaldehyde, permeabilized with cold methanol, and then stained with a STAT6(pY641)-Alexa 488 monoclonal antibody (mAb). For cells collected on day 6, the following antibodies were added: CD38-APC, CD23-PE-Cy7, and active caspase-3–PE (all from BD Biosciences). Data were acquired on a CytoFLEX flow cytometer (Beckman Coulter) and analyzed by using Flowlogic software (Miltenyi Biotec).
qRT-PCR analysis
RNA was extracted and reversed transcribed into complementary DNA. Quantitative reverse transcriptase polymerase chain reaction (qRT-PCR) analyses were performed with TaqMan Gene Expression Master Mix and Assays-on-Demand sets (Invitrogen). Gene expression levels were quantified using ABL1 as an endogenous control. The 2–ΔΔCT method was used to determine the relative expression of each gene.
Western blots
Cell pellets were lysed in radioimmunoprecipitation assay buffer completed with protease inhibitors. After concentration was determined, proteins were separated by using a 4% to 12% acrylamide gel and were transferred onto nitrocellulose membranes. Gels were revealed with horseradish peroxidase–conjugated secondary antibodies. The following antibodies were used for biochemical assays: anti-CBLB (D3C12, #9498), anti-CBL (#2747), anti-IRF4 (#4964), p21 Waf1/Cip1 (12D1, #2947), anti-STAT6 (#9362) (all from Cell Signaling) and anti-BLIMP1 (3H2-E8, #NB600-235; BioTechne), anti-IL-4R (AF-230, R&D Systems), and anti-β-actin (#AC-15; Sigma-Aldrich).
Immunoprecipitation and ubiquitin enrichment assays
After protein extraction using an NP-40 lysis buffer, cell lysates were incubated overnight with 2 µg of rabbit mAb anti-IRF4 (D9P5H) or a rabbit mAb isotype control (DA1E; both from Cell Signaling). After incubation for 1 hour with Dynabeads Protein A (Thermo Fisher Scientific) and magnetic separation, immunoprecipitates were analyzed by western blotting.
For IRF4 ubiquitination analysis, day 4–activated B cells were cultured for 14 hours in the presence of cocktail 2 (IL-2 + IL-10 + IL-4), and 10 µM MG132 was added during the 4 last hours. Cell lysates were enriched for ubiquitinated proteins using the Signal-Seeker Ubiquitination Detection Kit (Cytoskeleton) and following the manufacturer’s instructions. After immunoprecipitation of ubiquitinated proteins during 2 hours with ubiquitination affinity beads or control beads, immunoprecipitates were analyzed by western blotting.
RNA-sequencing
Three independent paired experiments were performed. RNA was extracted and sent for library preparation and sequencing by Helixio (Clermont-Ferrand, France). Reads were aligned against the hg19 human genome using TopHat2,26 keeping only reads with a single alignment. Raw counts for each sample were obtained using HTSeq counts.27 Differential expression of filtered genes (HTSfilter, 11 803 genes) was analyzed using DESeq228 in R (version 3.3.1; https://www.r-project.org). Differentially expressed genes were selected with an adjusted value of P < .05 and a fold-change >2 after Wald’s test and Benjamini-Hochberg correction. Principal component analysis (PCA) was performed on normalized read counts for the fold-change–filtered genes. Canonical pathways and biological functions were generated in an Ingenuity Pathways Analysis.
ATAC-sequencing
Assay for Transposase-Accessible Chromatin with high-throughput sequencing (ATAC-seq) was performed on 1 set of day 4lo, P2/CD23+, P2/CD23–, and P1 cell populations, according to published methods.29 After fluorescence-activated cell sorting, 50 000 cells were manually counted and were treated with Tn5 transposase. Libraries were amplified and sequenced (2 × 75 bp, paired-ends; Illumina HiSeq4000) by IntegraGen (Evry, France). Reads were aligned against the hg19 human genome, using Bowtie1.30 Open regions were determined with Model-Based Analysis of ChIP-Seq2 (MACS2)31 and filtered with a value of q < 0.001. Read counts were determined by using HTSeq counts, and differentially opened (DO) regions were identified with DESeq228 and a likelihood ratio test P-value cutoff of .1. Read densities were calculated by creating a common set of regions, counting the number of reads overlapping with each feature, and normalizing by sequencing depth and region size.
Data analysis and statistics
ATAC-seq and RNA sequencing (RNA-seq) data were integrated by applying a cutoff distance between regions and transcription start sites of 500 kb. The best region and gene pairs were then determined by calculating the correlation between gene expression and ATAC-seq densities and keeping only pairs with Pearson’s r > 0.8. Graphical representations, data integration, and statistical analyses were generated with R and locally developed bash scripts. Unless otherwise indicated, groups were compared in a 2-tailed Wilcoxon’s test.
Results
Changes in transcriptional and chromatin landscapes show the CD23-based split in activated B-cell commitment
Human blood NBCs were differentiated in vitro into PBs.24 On day 4, cell division tracking using violet proliferation dye 450 (VPD 450) discriminated between VPDhi (day 4hi) and VPDlo (day 4lo) subsets and on day 6, together with the CD38 marker, showed 3 cell populations characterized previously24,25 and referred to as P1, P2, and P3 (Figure 1A). We determined that the nonapoptotic P2 cells contained CD23+ and CD23– subsets, respectively, denoted as P2/CD23+ and P2/CD23–. Only P2/CD23– cells were able to generate PBs, as shown previously25 (Figure 3D; supplemental Figure 4). To explain this divergent differentiation potential between P2/CD23+ and P2/CD23– cells, we conducted an integrated RNA-seq and ATAC-seq analysis.
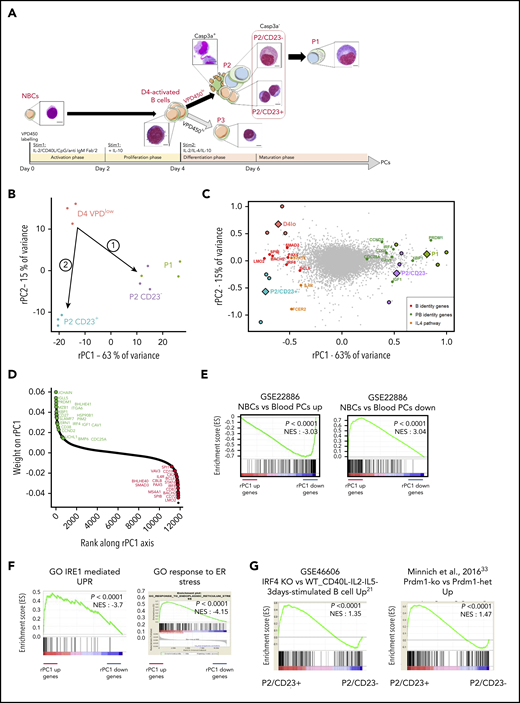
Transcriptomic and chromatin accessibility profiling of P2 cells shows a clear split in cell fate between P2/CD23+and P2/CD23–cells. (A) VPD-labeled NBCs were differentiated using a 2-step cell culture process that gave rise to 3 different cell populations (referred to as P1, P2, and P3) according to the VPD450 dilution and the CD38 expression on day 5 (D5) and D6.24 Active caspase-3–negative (Casp3a–) P2 cells split into CD23+ and CD23– subsets, and the P1 population arose from the latter.25 Representative cell morphologies during in vitro differentiation for each population are shown after Cytospin preparation and May-Grünwald-Giemsa staining (scale bar, 20 µm). (B) PCA of RNA-seq data from the D4lo, P2/CD23+, P2/CD23–, and P1 cell populations. P2/CD23+ and P2/CD23– clearly show different transcriptomic signatures and different differentiation abilities. (C) PCA of RNA-seq data from the D4lo, P2/CD23+, P2/CD23–, and P1 populations indicating the positions of samples (colored circles, with the mean shown by colored diamonds) and genes (gray dots). The position of selected B-cell identity genes (red dots), PC identity genes (green dots), and IL-4–dependent genes (orange dots) are indicated. (D) Ranking of genes according to their rPC1 weights; genes known to be related to PC identity are shown in green, and those known to be related to B-cell identity are shown in red. Note that both sets of genes are aggregated at opposite ends of the rPC1 axis. (E) GSEA for a signature (GSE22886) comparing NBCs with PCs collected from blood; “up” indicates genes specific for NBCs (left) and “down” indicates genes specific for PCs (right). (F) GSEAs for an IRE1-mediated unfolded protein response (UPR) Gene Ontology (GO) signature (left) and an endoplasmic reticulum (ER) stress response GO signature (right). (G) GSEA of signatures upregulated in activated B cells from Irf4-KO (left) and Prdm1-KO (right) mice for an RNA-seq comparison between P2 populations (P2/CD23+ vs P2/CD23–). het, heterozygous littermates; NES, normalized enrichment score.
Transcriptomic and chromatin accessibility profiling of P2 cells shows a clear split in cell fate between P2/CD23+and P2/CD23–cells. (A) VPD-labeled NBCs were differentiated using a 2-step cell culture process that gave rise to 3 different cell populations (referred to as P1, P2, and P3) according to the VPD450 dilution and the CD38 expression on day 5 (D5) and D6.24 Active caspase-3–negative (Casp3a–) P2 cells split into CD23+ and CD23– subsets, and the P1 population arose from the latter.25 Representative cell morphologies during in vitro differentiation for each population are shown after Cytospin preparation and May-Grünwald-Giemsa staining (scale bar, 20 µm). (B) PCA of RNA-seq data from the D4lo, P2/CD23+, P2/CD23–, and P1 cell populations. P2/CD23+ and P2/CD23– clearly show different transcriptomic signatures and different differentiation abilities. (C) PCA of RNA-seq data from the D4lo, P2/CD23+, P2/CD23–, and P1 populations indicating the positions of samples (colored circles, with the mean shown by colored diamonds) and genes (gray dots). The position of selected B-cell identity genes (red dots), PC identity genes (green dots), and IL-4–dependent genes (orange dots) are indicated. (D) Ranking of genes according to their rPC1 weights; genes known to be related to PC identity are shown in green, and those known to be related to B-cell identity are shown in red. Note that both sets of genes are aggregated at opposite ends of the rPC1 axis. (E) GSEA for a signature (GSE22886) comparing NBCs with PCs collected from blood; “up” indicates genes specific for NBCs (left) and “down” indicates genes specific for PCs (right). (F) GSEAs for an IRE1-mediated unfolded protein response (UPR) Gene Ontology (GO) signature (left) and an endoplasmic reticulum (ER) stress response GO signature (right). (G) GSEA of signatures upregulated in activated B cells from Irf4-KO (left) and Prdm1-KO (right) mice for an RNA-seq comparison between P2 populations (P2/CD23+ vs P2/CD23–). het, heterozygous littermates; NES, normalized enrichment score.
A PCA of paired RNA-seq data from day 4lo, P2/CD23+, P2/CD23–, and P1 cells showed that 78% of the variance was explained by the first 2 axes (rPC1 and rPC2). We traced 2 paths from day 4lo cells (the common progenitor) to P2/CD23+ and P2/CD23– cells (Figure 1B), which were also shown by a SLICER32 trajectory (supplemental Figure 1A). After placing both samples and genes on the RNA-seq PCA plot, the positions of the cell populations and of B-cell and PC identity genes25 led us to assign the rPC1 axis to PB differentiation (Figure 1C). Indeed, PC identity genes aggregated on the positive side of the rPC1 axis (corresponding to P2/CD23– and P1 populations), and B-cell identity genes aggregated on the negative side (associated with day 4lo and P2/CD23+ cells; Figure 1D). A gene set enrichment analysis (GSEA) of the ranked genes confirmed the enrichment of PC and NBC signatures at the positive and negative ends of the rPC1 axis, respectively (Figure 1E-F). A comparative GSEA of the 2 P2 populations showed that P2/CD23+ cells were enriched in gene signatures overexpressed in activated B cells from Irf421 and Blimp133 KO mice (Figure 1G).
We next performed ATAC-seq on day 4lo, P2/CD23+, P2/CD23–, and P1 cell populations. As expected, a comparison with the Gm12878 lymphoblast cell line chromHMM track34 showed that most ATAC-seq regions were active promoters and enhancers with a distribution that differed significantly from the genome as a whole (supplemental Figure 1A). These regions overlapped with open chromatin regions recently identified in mice35 and with enhancers linked to promoters (FANTOM5 database36 ). To identify potential regulatory regions, accessible regions were associated with genes (see “Methods”). The regions associated with PRDM1 and IRF4 (Figure 2A; supplemental Figure 1B) overlapped with binding sites for BACH2 and BCL637-40 and with enhancers and super-enhancers found in PBs25 and in a multiple myeloma cell line.41,42 The ATAC-seq read densities in our cell populations and unpublished data on NBCs confirmed that regions associated with genes at the positive end of the rPC1 axis opened up progressively during differentiation, whereas regions associated with genes at the negative end of the rPC1 axis tended to close (Figure 2B). In P1 cells, 5-hydroxymethylcytosine read densities increased for gene bodies at the positive end of the rPC1 axis and for the associated ATAC-seq regions.25 This suggests that rPC1-associated ATAC-seq regions were enhancers activated during terminal B-cell differentiation (supplemental Figure 1C).

ATAC-seq reveals a progressive commitment to alternative cell fates. (A) An Integrated Genomics Viewer (IGV) window, showing RNA-seq and ATAC-seq signals close to the PRDM1 locus in the different cell populations. Red boxes indicate ATAC-seq regions whose densities are correlated with PRDM1 RNA-seq expression. RNA-seq and ATAC-seq tracks are shown on the same scale to facilitate comparisons of the cell populations. Several features extracted from previously published research are also shown. The orange box on the left shows a region that closes with differentiation and in which a BCL6 TFBS was previously described,39 in agreement with the negative regulation of PRDM1 expression by BCL6. (B) A boxplot of ATAC-seq read densities in regions associated with the 200 genes with the highest score (top, 365 regions) or lowest score (bottom, 389 regions) on the RNA-seq rPC1 axis in the NBC, D4lo, P2/CD23+, P2/CD23–, and P1 populations. Note that densities increase with differentiation status for regions associated with PC differentiation genes (PC1 up) but decrease for NBC identity genes (PC1 down). (C) A heatmap of the 2658 DO ATAC-seq regions showing 6 clusters, each of which was specific for 1 or more cell populations. The numbers of regions per cluster are C1, 271; C2, 343; C3, 320; C4, 349; C5, 301; C6, 1074. (D) HOMER analysis of binding sites enriched in the different ATAC-seq DO clusters for selected TFs known to be involved in terminal B-cell differentiation or appearing in the top 10 TFs in 1 of the clusters (see supplemental Figure 2E). (E) Analysis using enrichr of genes associated with DO region clusters, showing an increasing enrichment of genes strongly expressed in PCs. Red bars indicate the significance threshold in hypergeometric or binomial tests (P < .05).
ATAC-seq reveals a progressive commitment to alternative cell fates. (A) An Integrated Genomics Viewer (IGV) window, showing RNA-seq and ATAC-seq signals close to the PRDM1 locus in the different cell populations. Red boxes indicate ATAC-seq regions whose densities are correlated with PRDM1 RNA-seq expression. RNA-seq and ATAC-seq tracks are shown on the same scale to facilitate comparisons of the cell populations. Several features extracted from previously published research are also shown. The orange box on the left shows a region that closes with differentiation and in which a BCL6 TFBS was previously described,39 in agreement with the negative regulation of PRDM1 expression by BCL6. (B) A boxplot of ATAC-seq read densities in regions associated with the 200 genes with the highest score (top, 365 regions) or lowest score (bottom, 389 regions) on the RNA-seq rPC1 axis in the NBC, D4lo, P2/CD23+, P2/CD23–, and P1 populations. Note that densities increase with differentiation status for regions associated with PC differentiation genes (PC1 up) but decrease for NBC identity genes (PC1 down). (C) A heatmap of the 2658 DO ATAC-seq regions showing 6 clusters, each of which was specific for 1 or more cell populations. The numbers of regions per cluster are C1, 271; C2, 343; C3, 320; C4, 349; C5, 301; C6, 1074. (D) HOMER analysis of binding sites enriched in the different ATAC-seq DO clusters for selected TFs known to be involved in terminal B-cell differentiation or appearing in the top 10 TFs in 1 of the clusters (see supplemental Figure 2E). (E) Analysis using enrichr of genes associated with DO region clusters, showing an increasing enrichment of genes strongly expressed in PCs. Red bars indicate the significance threshold in hypergeometric or binomial tests (P < .05).
A DESeq228 analysis of the ATAC-seq data revealed 2658 DO regions. Unsupervised hierarchical clustering defined 6 clusters that were specific for 1 or 2 cell populations (C1-C6; Figure 2C; supplemental Figure 2A-C). A transcription factor binding site (TFBS) enrichment analysis using MEME-AME43 and HOMER44 analysis tools revealed that the potential regulators differed for each cluster consistently with the progression of B-cell differentiation (Figure 2D; supplemental Figure 2E). For example, C1 (associated with day 4lo cells) was enriched in TFBSs for SPIB, PU.1, and NF-kB, in keeping with an activated B-cell state, whereas C6 was enriched in IRF4 binding sites, in line with the plasmablastic nature of P1 cells. We observed a weak enrichment in BACH2 binding sites (mainly in C2 and C3) and no significant enrichment in PAX5 binding sites, perhaps because we focused on late-stage differentiation.8,45 IRF4 and PU.1:IRF8 motifs were strongly enriched in C5 and C6, fitting with the regulatory balance between IRF8 and IRF4.46,47 PRDM1 TFBSs were significantly enriched in C6 only and at a lower level than IRF4 TFBSs, confirming that IRF4 is required earlier than PRDM1 in terminal B-cell differentiation.21 Interestingly, STAT6 binding sites were highly enriched in C2 and C3, associated respectively with the P2/CD23+ population and both P2 populations, whereas these sites were lost in C4, C5, and C6, corresponding to later differentiation states (Figure 2D).
Genes were associated with regions in each cluster, and annotation with GREAT48 and enrichr49 tools confirmed that each cluster corresponded to a different stage in differentiation. C6 was the largest cluster and was most strongly enriched in PC-expressed genes and genes upregulated during the differentiation of NBCs into PCs (Figure 2E; supplemental Figure 2D-E; supplemental Table 1).
To complete our investigation of the chromatin landscape and transcriptomic changes, a systematic evaluation of epigenetic factors referenced in an extensive database50 revealed that among the 398 differentially expressed genes between P2/CD23+ and P2/CD23– cells, we found only 7 of 95 histone genes (all overexpressed in P2/CD23– cells) and 8 of 720 epigenetic factor genes (4 overexpressed in each cell population). Epigenetic factors overexpressed in P2/CD23– cells were mostly linked to gene expression (PRDM1, GADD45A, ZMYND11), whereas those overexpressed in P2/CD23+ had either an ambiguous or repressing function (DEK, SATB1, ZNF516). A GSEA showed no enrichment in epigenetic processes (Gene Ontology [GO], Kyoto Encyclopedia of Genes and Genomes [KEGG], and Reactome databases) in P2/CD23+ cells and only limited enrichment in P2/CD23– cells, mainly as a result of histone gene overexpression (data not shown).
Altogether, these findings confirmed that P2/CD23+ cells were unable to differentiate into PBs and stayed in an activated B-cell state, whereas P2/CD23– cells committed toward the PC lineage. The fates of these 2 cell populations seemed regulated mainly by different transcription factors (TFs) (eg, STAT6 for P2/CD23+ cells and IRF4 for P2/CD23– cells) and not by differential expression of epigenetic factors.
Increase in IRF4 levels in PB-committed cells is concomitant with a downregulation of CBLB expression
We noted above the transcriptomic similarity between P2/CD23+ cells and Irf4-KO activated B cells, which showed an enrichment in IRF4 TFBSs as differentiation progressed (Figures 1G and 2D). In mouse GC B cells, the quantity of Irf4 was shown to be regulated by Cbl and Cblb.23 The expression of CBL in our in vitro model was quite stable, but that of CBLB diminished strongly in P2/CD23– and P1 cells whereas IRF4 expression was induced (Figure 3A). The inability of P2/CD23+ cells to differentiate might therefore be a result of sustained expression of CBLB and a reduction in IRF4 protein levels. These differences between cell populations in gene expression, including BLIMP1/PRDM1, were confirmed by qRT-PCR (supplemental Figure 3A). In a western blot analysis of the cell populations (which agreed with the mRNA data), CBL expression was relatively stable throughout differentiation. We observed a negative correlation between IRF4 expression and CBLB expression in our cell populations, especially for cells collected beyond day 4 (Figure 3B). We first assessed IRF4 protein half-life and observed stable levels after several hours of cycloheximide treatment in primary cells (Figure 3C) and in the OCI-LY7 cell line (supplemental Figure 3B). IRF4 protein levels did not increase after proteasome inhibition (Figure 3D), and protein ubiquitination assays revealed very low levels of ubiquitinated forms of IRF4 in day 4 activated B cells 8 hours after adding the second stimulation (Figure 3E). This latter effect was observed at day 6 in P2/CD23– and P1 cells (expressing very low levels of CBLB) rather than in P2/CD23+ cells (expressing low levels of IRF4 at this point; supplemental Figure 3C). No physical interaction of CBLB and IRF423 could be shown in our system after endogenous IRF4 immunoprecipitation (Figure 3F). After short interfering RNA downregulation of CBLB in day 4lo cells, there was no increase in IRF4 protein levels in P2/CD23+ cells (data not shown) and only a slight increase in the proportion of P1 cells on day 6 (supplemental Figure 3D). The accessibility of an ATAC-seq region linked to the CBLB promoter36 was correlated with CBLB expression. Furthermore, recent EZH2 and H3K27me3 profiling data51 from a similar in vitro model52 highlighted the presence of the repressing histone mark H3K27me3 at the promoter and in the first intron of CBLB in pre-PBs and PBs (Figure 3G). Overall, these results suggest that although a downregulation of CBLB occurs at the last stage of human B-cell differentiation concomitant with an increase in IRF4 expression, CBL/CBLB-mediated ubiquitin degradation is not a major IRF4 regulation pathway in our system.
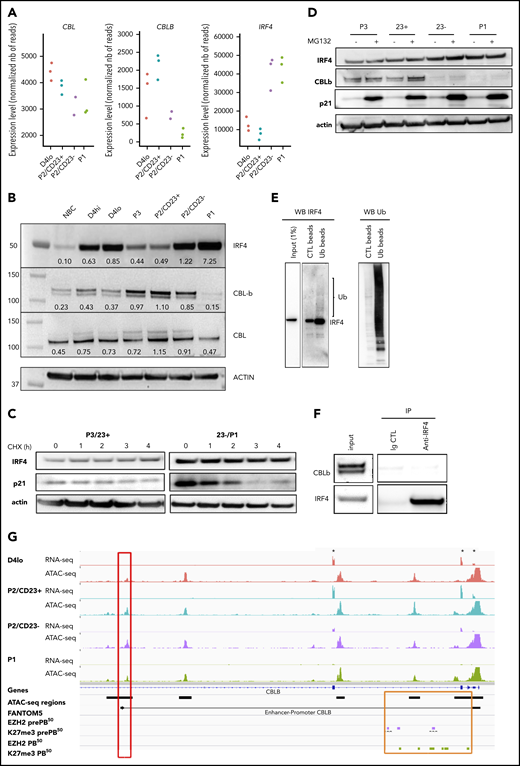
Increase in IRF4 levels in PB-committed cells is concomitant with a downregulation of CBLB expression. (A) CBL, CBLB, and IRF4 mRNA expression levels as measured by RNA-seq in the different cell populations (n = 3 paired samples). (B) IRF4, CBLB, and CBL protein expression assessed using western blots in NBCs, D4 cells, and different cell subsets on D6. The western blot (WB) is representative of 2 independent experiments. (C) IRF4 protein expression after treatment with cycloheximide (CHX; 50 µg/mL) to inhibit protein synthesis at D6. We could not detect any degradation of IRF4 after 4 hours. Positive control: p21, a protein known to be degraded by the proteasome pathway. Data are representative of 3 experiments. (D) IRF4 protein expression after MG132 treatment (10 µM for 4 hours) to inhibit proteasome degradation at D6. We could not detect any accumulation of IRF4 protein. Positive control: p21. Data are representative of 3 experiments. (E) Ubiquitination of IRF4 after ubiquitin immunoprecipitation in activated B cells (D4lo plus 8 hours of IL-2, IL-4, and IL-10). Western blots of IRF4 (left), with an enrichment in IRF4 in immunoprecipitated ubiquitin lysate compared with input and control and of ubiquitin (Ub; right) as control. Data are representative of 2 experiments. (F) CBLB detection by western blot after IRF4 immunoprecipitation in activated (D4 plus 14 hours) B cells. Although CBLB and IRF4 could be detected in input lysate and immunoprecipitation of IRF4 was successful (enrichment compared with input), CBLB could not be detected as interacting with IRF4. Data are representative of 2 experiments. (G) An IGV browser window showing RNA-seq and ATAC-seq signals close to the start of the CBLB locus in the different cell populations. Asterisks denote the first 3 exons of CBLB. The red box indicates an ATAC-seq region whose density is correlated with CBLB expression and that is known to interact with the CBLB promoter (according to FANTOM536 ). The orange box indicates the promoter and the first intronic regions, including the ATAC-seq regions. They acquired the repressive H3K27me3 mark at the pre-PB stage of differentiation, and they kept it at the PB stage51 (purple and green rectangles, respectively). Ig CTL, immunoglobulin control.
Increase in IRF4 levels in PB-committed cells is concomitant with a downregulation of CBLB expression. (A) CBL, CBLB, and IRF4 mRNA expression levels as measured by RNA-seq in the different cell populations (n = 3 paired samples). (B) IRF4, CBLB, and CBL protein expression assessed using western blots in NBCs, D4 cells, and different cell subsets on D6. The western blot (WB) is representative of 2 independent experiments. (C) IRF4 protein expression after treatment with cycloheximide (CHX; 50 µg/mL) to inhibit protein synthesis at D6. We could not detect any degradation of IRF4 after 4 hours. Positive control: p21, a protein known to be degraded by the proteasome pathway. Data are representative of 3 experiments. (D) IRF4 protein expression after MG132 treatment (10 µM for 4 hours) to inhibit proteasome degradation at D6. We could not detect any accumulation of IRF4 protein. Positive control: p21. Data are representative of 3 experiments. (E) Ubiquitination of IRF4 after ubiquitin immunoprecipitation in activated B cells (D4lo plus 8 hours of IL-2, IL-4, and IL-10). Western blots of IRF4 (left), with an enrichment in IRF4 in immunoprecipitated ubiquitin lysate compared with input and control and of ubiquitin (Ub; right) as control. Data are representative of 2 experiments. (F) CBLB detection by western blot after IRF4 immunoprecipitation in activated (D4 plus 14 hours) B cells. Although CBLB and IRF4 could be detected in input lysate and immunoprecipitation of IRF4 was successful (enrichment compared with input), CBLB could not be detected as interacting with IRF4. Data are representative of 2 experiments. (G) An IGV browser window showing RNA-seq and ATAC-seq signals close to the start of the CBLB locus in the different cell populations. Asterisks denote the first 3 exons of CBLB. The red box indicates an ATAC-seq region whose density is correlated with CBLB expression and that is known to interact with the CBLB promoter (according to FANTOM536 ). The orange box indicates the promoter and the first intronic regions, including the ATAC-seq regions. They acquired the repressive H3K27me3 mark at the pre-PB stage of differentiation, and they kept it at the PB stage51 (purple and green rectangles, respectively). Ig CTL, immunoglobulin control.
Differences in IL-4 responsiveness dictate the fates of activated B cells vs plasmablasts
We hypothesized that the rPC2 axis could also explain differences and similarities between P2 cell populations. The ATAC-seq densities of regions associated with genes at the negative end of the rPC2 axis (associated with P2/CD23+ cells) showed a specific increase in this population (Figure 4A). Gene ranking and a GSEA of the negative end of the rPC2 axis revealed an enrichment in IL-4 response genes53,54 (Figure 4B-C). IL-4R target genes (FCER2, IL4R, and STAT6) were expressed more in P2/CD23+ than in P2/CD23– cells (Figure 1C; supplemental Figure 4A). Hence, the split in the fate of P2 cells may be the result of a differential response to IL-4 (added on day 4 in our in vitro system).
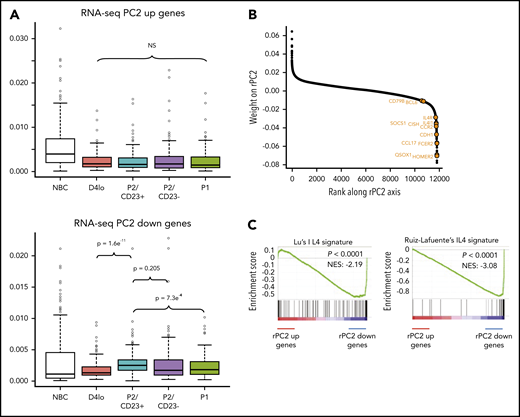
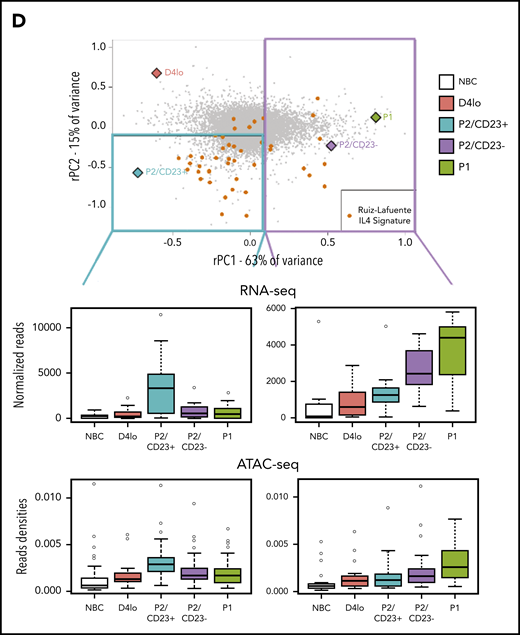
P2/CD23+and P2/CD23–cells show a differential response to IL-4. (A) Boxplot of ATAC-seq read densities for regions associated with the 200 genes with the highest scores (top, 384 regions) and lowest scores (bottom, 426 regions) on the RNA-seq PC2 axis during NBC differentiation. Note that regions associated with the genes from the positive end of the rPC2 axis are open in NBCs but closed during differentiation, whereas regions associated with genes from the negative end of the rPC2 axis are more open in P2/CD23+ cells only (in agreement with the position of this population at the lower end of the rPC2 axis). (B) Ranking of genes according to their rPC2 weights; known IL-4/STAT6 response genes are indicated in orange. (C) GSEA of genes ranked according to their rPC2 weights for 2 IL-4 signatures (B cells in the presence or absence of IL-4). (D) Top panel: positions of genes from Ruiz-Lafuente’s IL-4 signature associated with P2/CD23+ and P2/CD23– cells (orange dots and left cyan diamonds and right purple diamonds, respectively) on the RNA-seq PCA distribution. Middle panels: boxplots of RNA-seq data for these genes in NBCs and the different in vitro cell populations. Bottom panels: ATAC-seq densities of regions associated with genes from the IL-4 pathway and associated with P2/CD23+ (left) or P2/CD23– (right); the observed changes in chromatin accessibility are suggestive of a differential response to IL-4. NS, not significant.
P2/CD23+and P2/CD23–cells show a differential response to IL-4. (A) Boxplot of ATAC-seq read densities for regions associated with the 200 genes with the highest scores (top, 384 regions) and lowest scores (bottom, 426 regions) on the RNA-seq PC2 axis during NBC differentiation. Note that regions associated with the genes from the positive end of the rPC2 axis are open in NBCs but closed during differentiation, whereas regions associated with genes from the negative end of the rPC2 axis are more open in P2/CD23+ cells only (in agreement with the position of this population at the lower end of the rPC2 axis). (B) Ranking of genes according to their rPC2 weights; known IL-4/STAT6 response genes are indicated in orange. (C) GSEA of genes ranked according to their rPC2 weights for 2 IL-4 signatures (B cells in the presence or absence of IL-4). (D) Top panel: positions of genes from Ruiz-Lafuente’s IL-4 signature associated with P2/CD23+ and P2/CD23– cells (orange dots and left cyan diamonds and right purple diamonds, respectively) on the RNA-seq PCA distribution. Middle panels: boxplots of RNA-seq data for these genes in NBCs and the different in vitro cell populations. Bottom panels: ATAC-seq densities of regions associated with genes from the IL-4 pathway and associated with P2/CD23+ (left) or P2/CD23– (right); the observed changes in chromatin accessibility are suggestive of a differential response to IL-4. NS, not significant.
When positioned on the RNA-seq PCA plot, the genes from a B-cell–specific IL-4 response signature54 were predominantly located in the P2/CD23+ quadrant, and few genes were close to the P2/CD23– and P1 populations (Figure 4D, top). The positions of the genes were consistent with their expression levels in these cell populations (Figure 4D, middle) and with the accessibility of ATAC-seq regions associated with both sets of genes (Figure 4D, bottom). When day 4lo, P2/CD23+, and P2/CD23– populations were compared for IL-4 response signatures by GSEA, P2/CD23+ showed the greatest enrichment and day 4lo cells showed the lowest enrichment (supplemental Figure 4). Interestingly, the IL-4R signaling in B lymphocytes signature containing signaling pathway members only, showed that the pathway was completely silenced in P2/CD23– cells but not in day 4lo cells (supplemental Figure 4B). Accordingly, we observed multimodal downregulation of the IL-4/STAT6 pathway in P2/CD23– and P1 cells, with decreases in STAT6 and IL4R mRNA expression (Figure 5A), STAT6 and IL-4R protein levels (Figure 5B), and STAT6 phosphorylation (Figure 5C). These data are consistent with the changes in chromatin accessibility and the loss of STAT6 TFBS enrichment in C4-C6 clusters (Figure 2D). Overall, these results indicate that after an early response to IL-4 (see “D4lo+ 30 min IL-4” in Figure 5C), downregulation of the IL-4 signaling pathway is required in P2/CD23– cells for the last step in PB commitment. Conversely, a sustained IL-4 response (Figure 5A-C) maintained the P2/CD23+ cells in an activated state and dampened their capacity to differentiate (Figure 5D). Indeed, cell-sorted day 5 P2/CD23+ cells were able to generate more P1 cells in the absence of IL-4 (Figure 5D, bottom left). By using a pan-caspase inhibitor treatment (QVD-OPH), we showed that this result was independent of the increase of apoptosis observed in the presence of IL-4 (Figure 5D, bottom right).

IL4/STAT6 pathway is inactivated in P2/CD23–cells and inhibits differentiation of P2/CD23+cells. (A) IL4R and STAT6 mRNA expression levels as assessed by RNA-seq in the different cell populations (n = 3 paired samples). (B) STAT6 and IL-4R protein expression as quantified by western blotting in NBCs, D4 cells, and different cell subsets on D6. The western blot is representative of 3 independent experiments. (C) The strength of pSTAT6 signaling (assessed by flow cytometry) in IL4 nonstimulated or stimulated (stim) D4 cells (at 10 or 30 minutes) and in different cell subsets on D6. The data are representative of 3 independent experiments. (D) Top left, experiment scheme: after a short stimulation with cocktail 2 (IL-2 + IL-10 + IL-4), P2/CD23+ cells were sorted and cultured for 40 hours either with cocktail 2 (+IL-4) or only with IL-2 and IL-10 (without IL-4). Top right, strength of pSTAT6 signaling (assessed by flow cytometry) in both cell populations showing an activation of STAT6 only in IL-4–treated cells. Bottom left, number of CASP3-negative cells, showing an effect of IL-4 on cell survival (left). Treatment with the pan-caspase inhibitor QVD-OPH relieves this effect (right). Bottom right, number of plasmablasts (assessed by flow cytometry) obtained after 40 hours of culture without (left) and with (right) QVD-OPH showing a significant increase of generated plasmablasts in the condition without IL-4. FACS, fluorescence-activated cell sorting.
IL4/STAT6 pathway is inactivated in P2/CD23–cells and inhibits differentiation of P2/CD23+cells. (A) IL4R and STAT6 mRNA expression levels as assessed by RNA-seq in the different cell populations (n = 3 paired samples). (B) STAT6 and IL-4R protein expression as quantified by western blotting in NBCs, D4 cells, and different cell subsets on D6. The western blot is representative of 3 independent experiments. (C) The strength of pSTAT6 signaling (assessed by flow cytometry) in IL4 nonstimulated or stimulated (stim) D4 cells (at 10 or 30 minutes) and in different cell subsets on D6. The data are representative of 3 independent experiments. (D) Top left, experiment scheme: after a short stimulation with cocktail 2 (IL-2 + IL-10 + IL-4), P2/CD23+ cells were sorted and cultured for 40 hours either with cocktail 2 (+IL-4) or only with IL-2 and IL-10 (without IL-4). Top right, strength of pSTAT6 signaling (assessed by flow cytometry) in both cell populations showing an activation of STAT6 only in IL-4–treated cells. Bottom left, number of CASP3-negative cells, showing an effect of IL-4 on cell survival (left). Treatment with the pan-caspase inhibitor QVD-OPH relieves this effect (right). Bottom right, number of plasmablasts (assessed by flow cytometry) obtained after 40 hours of culture without (left) and with (right) QVD-OPH showing a significant increase of generated plasmablasts in the condition without IL-4. FACS, fluorescence-activated cell sorting.
Interestingly, the ATAC-seq region linked to the CBLB promoter (Figure 3G) contained a potential STAT6 binding site. A meta-analysis of STAT6 chromatin immunoprecipitation sequencing data55-57 could not confirm this; however, STAT6 binding sites were found in regulatory regions around the CBLB locus, including its promoter (supplemental Figure 5).
Committed CD23– B cells are preplasmablasts
To assess differences between committed P2/CD23– cells and P1 cells, we identified 183 differentially expressed genes (supplemental Table 2); 35 were upregulated in P1 cells (including the PC marker CD38), and 148 were upregulated in P2/CD23– cells. Most of the latter were B-cell identity genes (eg, BACH2, CIITA, and CBLB), as shown by their position on the RNA-seq PCA plot (Figure 6A). A GSEA showed that P2/CD23– cells were similar to the previously described52 pre-PBs and had a specific molecular phenotype (supplemental Figure 6A).
![P2/CD23–cells are pre-PBs rather than totally committed PBs. (A) Distribution on the RNA-seq PCA graph of genes upregulated in P1 vs P2/CD23– (green dots) or upregulated in P2/CD23– (purple dots). Note that although expression levels are lower in P2/CD23– than in less differentiated cell subsets, the genes upregulated in this population (relative to P1) are mainly B-cell identity genes. The position of the CD38-encoding gene is indicated. The green dot on the lower left side is FCER2 (encoding CD23), which is weakly expressed by P1 cells. (B) A volcano plot of ATAC-seq reads comparing P2/CD23– and P1 cells for all regions (gray dots). The fold changes and P values for DO regions associated with genes upregulated in P1 vs P2/CD23– are indicated by green dots (including a region close to CD38, red arrow). Regions associated with genes upregulated in P2/CD23– vs P1 are indicated by violet diamonds. (C) Boxplots of read densities for regions associated with genes upregulated in P2/CD23– cells (left side, 288 regions) or P1 cells (right side, 59 regions). The statistical significance of the difference between P2/CD23– and P1 populations was assessed in a 2-tailed Wilcoxon rank sum test with continuity correction. Wilcoxon test: 48 933; 95% confidence interval [CI], 1.8e−4 to 5.4e−4; location shift estimate, 3.7e−4; P = 1.3e−4 for regions associated with genes upregulated in P2/CD23– cells. W: 719; 95% CI, −1.97e−3 to −9.4e−4; location shift estimate, −1.41e−3; P = 3.9e−8 for regions associated with genes upregulated in P1 cells. (D) Chromatin accessibility at IGH locus during differentiation. The boxplot shows DO region cluster C6 read densities (n = 1074) in NBCs and in the 4 cell populations of interest. Dots indicate the read densities of the IGHM locus (red dots), IGHA1 locus (red triangles), and the enhancer hs3 in the 3′ RR2 regulatory region (red diamonds). IGHM is the locus that varied most and was fully open in P1 cells only. (E) An IGV browser window showing RNA-seq and ATAC-seq signals in the different cell populations for the regions depicted in D close to the IGH locus. The left panel shows the hs3 enhancer of the 3′ RR2 regulatory region58; the middle panel shows the first coding exons of IGHA1 and an upstream potential regulatory ATAC-seq region that opens in PBs only (Region_48456); the right panel shows the first coding exons of IGHM and an upstream potential regulatory ATAC-seq region that opens in PBs only (Region_48462).](https://ash.silverchair-cdn.com/ash/content_public/journal/blood/137/9/10.1182_blood.2020005083/2/m_bloodbld2020005083f6.png?Expires=1767760910&Signature=PpCPy~6HSpaMmF~WltvPIqHmABm2haI2k~Xih~88bkFfRNyVd5yg5oEX-obc5XiQxvHhyCSwYNc9U9WB4qBU7WH47YKNpVtUIZzyQcZNMqR9dub7H-Yh7BkRbqzFCKDHvBVzXspVb~C9sIBZbvqQ3rFJ2k3VfX2xKZdS0ewzImETkLo~YSATKiWLMRmqhowPDSmexx2boAJjGGx5cgIdFTeDm6YpPsRqIYrpniCmPDIv5d7LOFuVyQtr3UsY2lpNlMsfPajtFM0E41qidi9nymrjWR7-y9Pz8KhH50B89L~a-hiREs2FefH~i88mUBxwgQNmnblA9lzL0650C9CwJg__&Key-Pair-Id=APKAIE5G5CRDK6RD3PGA)
P2/CD23–cells are pre-PBs rather than totally committed PBs. (A) Distribution on the RNA-seq PCA graph of genes upregulated in P1 vs P2/CD23– (green dots) or upregulated in P2/CD23– (purple dots). Note that although expression levels are lower in P2/CD23– than in less differentiated cell subsets, the genes upregulated in this population (relative to P1) are mainly B-cell identity genes. The position of the CD38-encoding gene is indicated. The green dot on the lower left side is FCER2 (encoding CD23), which is weakly expressed by P1 cells. (B) A volcano plot of ATAC-seq reads comparing P2/CD23– and P1 cells for all regions (gray dots). The fold changes and P values for DO regions associated with genes upregulated in P1 vs P2/CD23– are indicated by green dots (including a region close to CD38, red arrow). Regions associated with genes upregulated in P2/CD23– vs P1 are indicated by violet diamonds. (C) Boxplots of read densities for regions associated with genes upregulated in P2/CD23– cells (left side, 288 regions) or P1 cells (right side, 59 regions). The statistical significance of the difference between P2/CD23– and P1 populations was assessed in a 2-tailed Wilcoxon rank sum test with continuity correction. Wilcoxon test: 48 933; 95% confidence interval [CI], 1.8e−4 to 5.4e−4; location shift estimate, 3.7e−4; P = 1.3e−4 for regions associated with genes upregulated in P2/CD23– cells. W: 719; 95% CI, −1.97e−3 to −9.4e−4; location shift estimate, −1.41e−3; P = 3.9e−8 for regions associated with genes upregulated in P1 cells. (D) Chromatin accessibility at IGH locus during differentiation. The boxplot shows DO region cluster C6 read densities (n = 1074) in NBCs and in the 4 cell populations of interest. Dots indicate the read densities of the IGHM locus (red dots), IGHA1 locus (red triangles), and the enhancer hs3 in the 3′ RR2 regulatory region (red diamonds). IGHM is the locus that varied most and was fully open in P1 cells only. (E) An IGV browser window showing RNA-seq and ATAC-seq signals in the different cell populations for the regions depicted in D close to the IGH locus. The left panel shows the hs3 enhancer of the 3′ RR2 regulatory region58 ; the middle panel shows the first coding exons of IGHA1 and an upstream potential regulatory ATAC-seq region that opens in PBs only (Region_48456); the right panel shows the first coding exons of IGHM and an upstream potential regulatory ATAC-seq region that opens in PBs only (Region_48462).
P2/CD23–cells are pre-PBs rather than totally committed PBs. (A) Distribution on the RNA-seq PCA graph of genes upregulated in P1 vs P2/CD23– (green dots) or upregulated in P2/CD23– (purple dots). Note that although expression levels are lower in P2/CD23– than in less differentiated cell subsets, the genes upregulated in this population (relative to P1) are mainly B-cell identity genes. The position of the CD38-encoding gene is indicated. The green dot on the lower left side is FCER2 (encoding CD23), which is weakly expressed by P1 cells. (B) A volcano plot of ATAC-seq reads comparing P2/CD23– and P1 cells for all regions (gray dots). The fold changes and P values for DO regions associated with genes upregulated in P1 vs P2/CD23– are indicated by green dots (including a region close to CD38, red arrow). Regions associated with genes upregulated in P2/CD23– vs P1 are indicated by violet diamonds. (C) Boxplots of read densities for regions associated with genes upregulated in P2/CD23– cells (left side, 288 regions) or P1 cells (right side, 59 regions). The statistical significance of the difference between P2/CD23– and P1 populations was assessed in a 2-tailed Wilcoxon rank sum test with continuity correction. Wilcoxon test: 48 933; 95% confidence interval [CI], 1.8e−4 to 5.4e−4; location shift estimate, 3.7e−4; P = 1.3e−4 for regions associated with genes upregulated in P2/CD23– cells. W: 719; 95% CI, −1.97e−3 to −9.4e−4; location shift estimate, −1.41e−3; P = 3.9e−8 for regions associated with genes upregulated in P1 cells. (D) Chromatin accessibility at IGH locus during differentiation. The boxplot shows DO region cluster C6 read densities (n = 1074) in NBCs and in the 4 cell populations of interest. Dots indicate the read densities of the IGHM locus (red dots), IGHA1 locus (red triangles), and the enhancer hs3 in the 3′ RR2 regulatory region (red diamonds). IGHM is the locus that varied most and was fully open in P1 cells only. (E) An IGV browser window showing RNA-seq and ATAC-seq signals in the different cell populations for the regions depicted in D close to the IGH locus. The left panel shows the hs3 enhancer of the 3′ RR2 regulatory region58 ; the middle panel shows the first coding exons of IGHA1 and an upstream potential regulatory ATAC-seq region that opens in PBs only (Region_48456); the right panel shows the first coding exons of IGHM and an upstream potential regulatory ATAC-seq region that opens in PBs only (Region_48462).
This differential expression was sustained by differences in chromatin accessibility: DO regions associated with P1 upregulated genes (including CD38) were fully open in P1 cells only, and were all in clusters C5 and C6. Conversely, regions associated with genes upregulated in P2/CD23– cells tended to close during differentiation (Figure 6B-C) and were found in C1, C2, and C3. A TFBS analysis of ATAC-seq regions associated with genes upregulated in either of the cell populations highlighted different families of TFs for P2/CD23– and P1 cells (supplemental Figure 6B). The only common TFBS was PU.1:IRF8, an important regulator of terminal B-cell differentiation.46,47 A differential TFBS analysis showed an enrichment of thyroid hormone receptor alpha motifs in P1 cells and of several motifs in P2/CD23– cells, including 1 corresponding to TBX21, consistent with TBX21 overexpression in these cells (supplemental Table 2; supplemental Figure 6C).
One hallmark of PB differentiation is immunoglobulin production. We therefore looked at ATAC-seq regions within the immunoglobulin heavy chain coding locus. The region with the greatest fold-change in accessibility was located at the IGHM locus and belongs to the P1-specific cluster C6. Its accessibility differed significantly when comparing P1 and P2/CD23– cells and was greater in P2/CD23– cells than in P2/CD23+ cells (Figure 6D). The same dynamics were observed at the IGHA1 promoter and at the hs3 enhancer of the 3′ RR2 regulatory region58 (Figure 6D-E). Overall, these data showed that P2/CD23– cells were still imprinted by their former activated B-cell identity and were precursors of PBs.52
Discussion
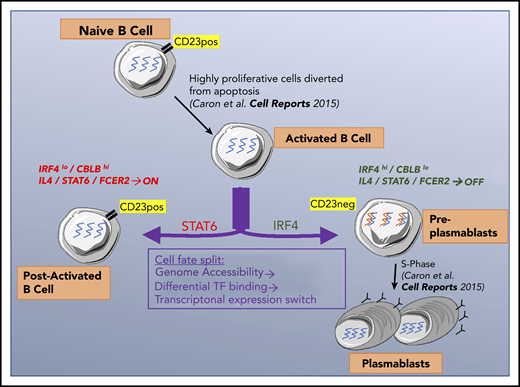
In late B-cell differentiation, a cell can become a post-activated B cell or produce 2 antibody-secreting cells. We showed previously25 that B cells that had committed to becoming PBs downregulate expression of the CD23 cell surface marker. This finding enabled us to characterize the split in the cell fate by comparing P2/CD23+ and P2/CD23– populations: CD23–downregulation reflected the necessary inhibition of the IL-4/STAT6 signaling, and P2/CD23– cells increased IRF4 mRNA and protein expression, which promoted their commitment to the PB lineage.21-23
Our chromatin accessibility analysis suggested that molecular modifications sustained the observed transcriptional changes and were not related to major changes in the expression of epigenetic factors. This is consistent with the fact that the activity of epigenetic factors important for B-cell differentiation, such as EZH2,51 is controlled by posttranslational modifications.59 The TFBS analysis in the 6 clusters of DO regions indicated a coherent dynamic genomic landscape throughout B-cell differentiation. Interestingly, 2 key identity genes (BACH2 and PRDM1) were involved, both of which act on opposite sides of the same axis. This finding is in agreement with our previous results showing that BACH2 acts as a lock on the differentiation of B cells into PCs but is released early by IL-2–driven mechanisms.8 This release is stochastic, however, and depends on the output of signal integration. The P2/CD23+ cells may not have been stimulated above a certain threshold; hence, they maintained high levels of BACH2 expression and could not differentiate. In accordance with these findings, the transcriptome of the P2/CD23+ cells was similar to that seen in Irf4-KO or Prdm1-KO murine B cells, which are unable to differentiate.21,33
IL-4 has been described as a key cytokine in B-cell differentiation, with roles in the early extrafollicular production of short-lived PBs and in promotion of the GC B-cell identity.10-13 We found that prolonged IL-4 signaling in P2/CD23+ cells impaired PC differentiation, in line with previous observations that IL-4 can both promote and inhibit B-cell differentiation.60,61 In fact, IL-4 is able to induce both BCL6 and IRF4. Both factors promote the GC B-cell identity in a pre-GC context but later act antagonistically; BCL6 maintains the GC reaction, whereas IRF4 induces B-cell egress from the GC.10-13,21 Therefore, just as a transient decrease in Tfh help is necessary to commit GC B-cell precursors to their GC fate,62 a drop in IL-4 signaling in committed cells may be required for them to become a PB. Overall, the emergence of 2 cell populations with highly divergent fates results from the differential response to Tfh cytokines and signal integration linked to the heterogeneity of postactivated B cells, which is detectable very early in the differentiation process, as demonstrated with IL-2 priming.8
Our second major finding concerns the differential expression of the CBLB ubiquitin ligase in P2/CD23+ vs P2/CD23– populations, and its impact on IRF4 protein levels. Li et al23 showed in mice that Cbl/Cblb promotes Irf4 degradation in low-affinity GC B cells. Strong CD40 and BCR signals trigger the degradation of Cbl/Cblb, leading to elevated Irf4 levels and the egress of PBs from the GC. In human primary B cells, we observed that CBL mRNA and protein levels were stable, IRF4 and CBLB expression levels were inversely correlated, and IRF4 protein levels were quite stable. However, contrary to the mouse study, ubiquitinated forms of IRF4 and IRF4/CBLB interactions were very hard to prove in our system (Figure 3; supplemental Figure 3). Moreover, we could not detect any increase in IRF4 levels and only a slight effect on PB numbers after CBLB short interfering RNA inhibition. In our system, it is therefore likely that ubiquitination is not the primary regulating pathway of levels of IRF4 (a very stable protein; Figure 3C-D), which may be more related to an increase in IRF4 transcription levels between P2/CD23+ and P2/CD23– cells. This discrepancy with the mouse GC B-cell model could be the result of either species differences in molecular mechanisms or the fact that our system does not faithfully model GC B cells. Given these differences, it may be interesting to test in humans the role of CBL/CBLB on antigen processing recently described in mice.63 Interestingly, complete downregulation of CBLB was achieved only in P1 cells but not in P2/CD23– cells. This was consistent with our findings indicating that P2/CD23– cells are similar to pre-PB cells described in vivo and characterized by a specific molecular signature; hence, these cells are 1 step away from becoming PBs.25,52
Our comparative TFBS analysis of ATAC-seq regions in P2/CD23– vs P1 populations raised 2 points warranting further investigation. First, the only differential TF motif identified in the P1 cells was related to the thyroid hormone receptor. It was shown that thyroid hormone regulates plasma cell differentiation both in vitro64 and in vivo65 ; however, the timing and the underlying molecular mechanisms were not investigated. Second, we identified an enrichment in TBX21 (also known as T-bet) motifs and TBX21 overexpression specifically in P2/CD23– cells. Interestingly, CD23–/T-bet+ B-cell subsets were reported in autoimmunity, chronic infections, and aging, both in mice and in humans.66-72 These CD21–/lo/T-bet+ atypical B cells were described to be or to give rise to pre-ASCs69,70,72 in agreement with the pre-PB nature of the P2/CD23– cells. Interestingly, several genes described in these T-bet+ B cells, such as TLR7 or FCRL5 were also upregulated in P2/CD23– cells, whereas the most common co-marker of these B-cell subsets, CD11c (encoded by ITGAX), was not (supplemental Figure 6C). Hence, an investigation of the heterogeneity of the P2/CD23– cell population is required, especially at the single-cell level. Our observation of IL-4/STAT6 pathway extinction in the final step of PB commitment is in line with IL-4 pathway extinction,66 Antagonism by IL-4 of IL-21–driven T-bet upregulation67 and the repressive effect of IL-4 on pre-ASC differentiation of T-bet+ B-cell subsets69,72 suggest a common requirement of IL-4 signaling extinction for further ASC differentiation of these different B-cell subsets.
Our data shed new light on the mechanisms involved in B-cell fate (Figure 7). For CD23– cells committed to differentiation into PCs, the concomitant extinction of IL-4/STAT6 signaling and increase in IRF4 expression is essential. Both pathways act in opposite manners on PC differentiation. These findings are relevant for follicular lymphomas, known to be IL-4 dependent and to present modifications of the IL-4/STAT6 pathway.
The data supporting this study are available within the article and its supplemental information files, or upon request to the corresponding author Thierry Fest at thierry.fest@univ-rennes1.fr. Sequencing data have been deposited in the Gene Expression Omnibus: GSE136990.
The online version of this article contains a data supplement.
The publication costs of this article were defrayed in part by page charge payment. Therefore, and solely to indicate this fact, this article is hereby marked “advertisement” in accordance with 18 USC section 1734.
Acknowledgments
The authors thank David Fraser at Biotech Communication for editing services.
This work was funded by an internal grant from the Hematology Laboratory, Pôle de Biologie, Centre Hospitalier Universitaire de Rennes, Rennes, France, and by a grant from Association Pour la Recherche Contre le Cancer (PJA 20181207839). A.P. received fellowships from Région Bretagne and from Ligue Nationale de Lutte Contre le Cancer.
Cell sorting was performed at the Biosit Flow Cytometry and Cell Sorting Facility CytomeTRI (University of Rennes 1, Rennes, France).
Authorship
Contribution: A.P. performed cell culture, molecular, and protein experiments, designed certain experiments, and wrote the first draft of the manuscript; F.C. prepared ATAC-seq libraries, analyzed and integrated omics data, created tools for analysis, and wrote and revised the manuscript; G.C. performed cell culture, cytometry, protein, and cell sorting experiments and revised the manuscript; M.H. helped with experiments needed for revision; F.D. helped with protein analyzes; T.F. designed the cell differentiation model, performed RNA-seq Ingenuity Pathways Analysis, supervised the project, and wrote and revised the manuscript; and all authors read and approved the revised manuscript.
Conflict-of-interest disclosure: The authors declare no competing financial interests.
Correspondence: Thierry Fest, INSERM U1236, Faculté de Médecine, University Rennes 1, 2 Avenue du Pr Léon Bernard, CS 34317, F-35043 Rennes Cedex, France; e-mail: thierry.fest@univ-rennes1.fr.

This feature is available to Subscribers Only
Sign In or Create an Account Close Modal