

Key Points
Low-HSF1-pSer326 is a favorable prognostic protein in patients treated with BTZ-containing chemotherapy.
Addition of BTZ to standard chemotherapy significantly improves outcome in low-HSF1-pSer326 pediatric patients with AML.

Abstract
Bortezomib (BTZ) was recently evaluated in a randomized phase 3 clinical trial by the Children’s Oncology Group (COG) that compared standard chemotherapy (cytarabine, daunorubicin, and etoposide [ADE]) vs standard therapy with BTZ (ADEB) for de novo pediatric acute myeloid leukemia (AML). Although the study concluded that BTZ did not improve outcome overall, we examined patient subgroups benefiting from BTZ-containing chemotherapy using proteomic analyses. The proteasome inhibitor BTZ disrupts protein homeostasis and activates cytoprotective heat shock responses. Total heat shock factor 1 (HSF1) and phosphorylated HSF1 (HSF1-pSer326) were measured in leukemic cells from 483 pediatric patients using reverse phase protein arrays. HSF1-pSer326 phosphorylation was significantly lower in pediatric AML compared with CD34+ nonmalignant cells. We identified a strong correlation between HSF1-pSer326 expression and BTZ sensitivity. BTZ significantly improved outcome of patients with low-HSF1-pSer326 with a 5-year event-free survival of 44% (ADE) vs 67% for low-HSF1-pSer326 treated with ADEB (P = .019). To determine the effect of HSF1 expression on BTZ potency in vitro, cell viability with HSF1 gene variants that mimicked phosphorylated (S326A) and nonphosphorylated (S326E) HSF1-pSer326 were examined. Those with increased HSF1 phosphorylation showed clear resistance to BTZ vs those with wild-type or reduced HSF1-phosphorylation. We hypothesize that HSF1-pSer326 expression could identify patients who benefit from BTZ-containing chemotherapy.
Introduction
Despite significant improvements in long-term survival, patients with pediatric acute myeloid leukemia (AML) still fare poorly compared with pediatric cases of acute lymphocytic leukemia.1 After induction therapy, ∼90% of children achieve complete remission (CR), but 50% will eventually relapse.2 Curability after relapse is poor, with only one-third being cured.3 This scenario indicates that new therapeutic strategies are needed to further improve outcome. The proteasome inhibitor bortezomib (BTZ) is effective in multiple myeloma4,5 and mantle cell lymphoma.6 Adult AML clinical trials have also shown that BTZ can be safely combined with standard AML chemotherapy.7-9 The Children’s Oncology Group (COG) recently evaluated BTZ in a phase 3 clinical trial randomizing de novo AML patients to receive cytarabine arabinoside/daunorubicin/etoposide (ADE) with BTZ (ADEB) or without BTZ. The trial was closed early, after inclusion of 950 of 1150 planned patients, when results suggested that the addition of BTZ did not improve overall survival (OS), event-free survival (EFS), or treatment-related mortality.10 As part of a preplanned analysis, we examined protein expression to determine if there were patients with specific proteomic patterns who benefited from BTZ-containing chemotherapy.
BTZ is a proteasome inhibitor that specifically targets the β5-subunit of the 26S proteasome, disturbing cellular protein homeostasis. This results in a toxic buildup of misfolded proteins in the cytosol and proteomic stress that can result in cell death. With BTZ treatment, cells activate their adaptive mechanisms, including the endoplasmic reticulum–mediated unfolded protein response and the heat shock response. The heat shock response is a protective and pro-survival mechanism that maintains protein stability by inducing protein chaperones, allowing malignant cells to survive proteotoxic stress. The heat shock response is mediated by the evolutionarily conserved heat shock factor 1 (HSF1). High levels of HSF1 correlate with unfavorable prognosis in solid cancers, including breast, lung, and colon cancer. However, no role for HSF1 has yet been ascertained in AML.11
In response to a wide range of stresses, HSF1 is activated and translocates to the nucleus, where it binds to heat shock–responsive DNA elements and upregulates genes encoding heat shock proteins (HSPs).12 One of the important phosphorylation sites responsible for this activation is serine domain 326 (HSF1-pSer326), which is phosphorylated via the upstream kinases p38,13 MEK,14 and mammalian target of rapamycin.15,16 Emerging evidence in multiple myeloma17 and non–small cell lung carcinoma18 shows that HSPs, including HSF1-pSer326, are upregulated after BTZ treatment and that knockdown of HSF1 increases sensitivity to BTZ.19-21 Others report that defects in the ubiquitin-proteasome system lead to activation of members of the heat shock family.22 This outcome suggests that HSF1 and BTZ act in opposing circumstances, which implies that activation of the heat shock response via activation of HSF1 could limit the efficacy of BTZ. We sought to determine if the level of HSF1-pSer326 modulated the effectiveness of BTZ-containing chemotherapy when used in the treatment of pediatric AML. Using reverse phase protein arrays (RPPAs), we measured protein expression levels of HSF1-pSer326 in peripheral blood samples from 483 pediatric patients with AML treated on the COG clinical trial AAML1031 (#NCT01371981). We determined a significant and clinically relevant correlation between low HSF1-pSer326 expression and outcome in children with pediatric AML treated with BTZ-containing chemotherapy.
Methods
Pediatric AML patient samples
Peripheral blood samples were obtained from 483 de novo pediatric AML patients who participated in the COG AAML1031 phase 3 clinical trial and CD34+ bone marrow (BM) samples obtained from 30 healthy donors (20 pediatric CD34+ samples and 10 adult CD34+ samples). Samples from adults were included to allow future comparison with adult AML samples, which were published previously.23 Patient samples from the AAML1031 were acquired during routine diagnostic assessments before (ie, at time of diagnosis) and at 10 and 24 hours after the start of chemotherapy. Samples were collected between July 2011 and February 2017. Written informed consent was obtained in accordance with the Declaration of Helsinki. Table 1 presents the associated demographic characteristics.
Patient characteristics (N = 410)
| All cases | Low-HSF1-pSer326 | Middle- HSF1-pSer326 | High- HSF1-pSer326 | P | |
|---|---|---|---|---|---|
| Total | 100% | 31.7% | 34.9% | 33.4% | |
| Age | |||||
| <1 y | 12.2% | 13.9% | 14.0% | 8.8% | .32 |
| 2-10 y | 33.4% | 36.2% | 28.0% | 36.5% | .23 |
| >11 y | 54.4% | 50.0% | 58.0% | 54.7% | .41 |
| Female sex | 49.0% | 52.3% | 49.7% | 45.3% | .51 |
| Race* | |||||
| American Indian or Alaska Native | 1.1% | 0.9% | 2.3% | 0% | .20 |
| Asian | 4.7% | 4.3% | 4.7% | 5.0% | .96 |
| Black | 11.8% | 6.8% | 13.2% | 15.1% | .12 |
| White | 82.2% | 88.0% | 79.8% | 79.0% | .13 |
| Multiple races | 0.3% | 0% | 0% | 0.8% | .35 |
| Ethnicity† | |||||
| Hispanic | 17.1% | 13.6% | 19.0% | 18.5% | .45 |
| Not Hispanic | 82.9% | 86.4% | 81.0% | 81.5% | |
| Cytogenetics | |||||
| t(8;21) | 15.9% | 10.0% | 14.0% | 23.4% | .01 |
| inv(16) | 13.9% | 16.2% | 16.8% | 8.8% | .10 |
| Normal karyotype | 27.8% | 33.8% | 22.4% | 27.7% | .11 |
| t(9;11)(p22;q23)/11q23 | 17.6% | 15.4% | 17.5% | 19.7% | .65 |
| −5, −7, or +8 | 7.8% | 9.2% | 7.0% | 7.3% | .76 |
| Other | 17.1% | 15.4% | 22.4% | 13.1% | .10 |
| NPM1, mutant | 11.2% | 10.0% | 11.9% | 11.7% | .87 |
| CEBPα, mutant | 9.5% | 16.2% | 7.0% | 5.8% | .01 |
| FLT3-ITD, mutant | 22.4% | 20.8% | 19.6% | 27.0% | .28 |
| High allelic ratio FTL3-ITD (≥ 0.4), yes | 14.6% | 13.1% | 14.0% | 16.8% | .67 |
| Risk stratification, high‡ | 29.8% | 31.0% | 25.9% | 32.6% | .45 |
| CR | 84.9% | 86.2% | 82.5% | 86.1% | .62 |
Unknown values were not considered in P value calculations and are excluded from the results.
N = 45 patients have unknown race and are excluded from the results.
N = 18 patients have unknown ethnicity and are excluded from the results.
AAML1031 protocol risk group definition: low risk, inv(16)/t(16;16) or t(8;21), or NPM or CEBPα mutation; high risk, FLT3/ITD+ with high allelic ratio ≥0.4, or monosomy 5/del5q or 7, without low-risk features; and risk status unknown for 10 of 410.
Outcome data were available for 410 of the patients enrolled on the AAML1031 study. A total of 164 patients received standard ADE induction therapy, 210 patients received ADE in combination with BTZ (ADEB), and 36, with known FLT3-ITD mutations, received ADE + sorafenib (ADES). Because we are particularly interested in the additional effect of BTZ, and as the patients treated with ADE and ADES had no statistically significant difference in outcome, patients treated with ADE and ADES were combined for proteomic analysis (N = 200). Three hundred forty-eight (85%) patients achieved CR by the end of course 2, thirty-one (7.6%) patients were refractory or died (failed therapy), 156 (45%) patients relapsed after remission, and 286 were still alive at the end of their follow-up (70%). Patients had mutation data available for CEBPα, NPM1, and FLT3-ITD.
Cell lines
HEK 293T cells were purchased from the DSMZ (Braunschweig, Germany). They were cultured in Dulbecco’s modified Eagle medium containing 10% fetal calf serum (Thermo Fisher Scientific, Waltham, MA), 1% penicillin, and streptomycin and maintained at 37°C in a humidified atmosphere of 5% carbon dioxide.
RPPA methodology
The methodology and validation of the RPPA technique are fully described elsewhere.24-27 Briefly, fresh samples were isolated by centrifugation using lymphocyte separation solution (MilliporeSigma, Burlington, MA) and enriched for leukemic cells by CD3/CD19 depletion (Miltenyi Biotec, Cologne, Germany). Protein preparations were normalized to a concentration of 1 × 10⁷ cells/mL and printed in 5 serial dilutions onto slides along with normalization and expression controls. Samples were printed on 2 slides per antibody, each containing 1152 samples (ie, patient samples, controls). Given the high interarray and intra-array reproducibility and high staining precision of RPPA, no replicate samples were used.27 Slides were probed with 300 antibodies listed in supplemental Table 1 (available on the Blood Web site), including a primary antibody validated against HSF1 phosphorylated at serine 326 (Abcam, Cambridge, United Kingdom) and HSF1-total (Cell Signaling Technology, Danvers, MA). Stained slides were analyzed by using MicroVigene software version 3.0 (VigeneTech, Inc, Carlisle, MA). SuperCurve algorithms were used to generate a single value from the 5 serial dilutions.28 Loading controls29 and topographical normalization30 procedures were performed to account for protein concentration and background staining variations on each array. Replicate-based normalization31 was used to align samples from 2 different slides. Overlapping samples (n = 98) between the 2 slides had an average Pearson’s correlation coefficient of 0.88 (standard deviation, 0.07). Of the 300 antibodies, 2 were excluded due to a poor Pearson’s correlation coefficient (CDX2 and PSMB9). Based on significant differences in protein expression of paired samples that were collected in different preservative tubes (ie, heparin vs Cell Save), 3 antibodies were excluded (H2AX-pSer140, MYH9-pSer1943, and PRKAA1_2-pTyr172), leaving 293 antibodies in addition to total and HSF1-pSer326 for analysis. For each protein, the median expression levels of the 30 normal BM CD34+ samples were subtracted from the expression in the patient samples to obtain relative protein expression levels.
Quality control
To exclude low-quality samples, samples were removed that showed a greater number of proteins with extreme levels of expression, using a cutoff value of +3 standard deviation mean protein expression. Twenty-two (1.4%) of the 1524 samples did not met the quality control criteria and were excluded (T.M.H., F.W.H., A.D.v.D., G.N.J., D. Morrison, T. Bhatla, L. Hogan, E. Romanos-Sirakis, J. Meyer, W. L. Carroll, Y.Q., T. Wang, Q. Mo, and S.M.K., manuscript submitted April 2020).
Gene expression profiling
Ribodepleted RNA-sequencing data were generated as previously described.32 Expression data were available for 390 of 483 RPPA patients and for 1063 eligible patients enrolled in the clinical trial. HSF1 gene expression was compared with 21 927 other genes.
Western blotting
Western blot analysis was performed as previously described.33 Antibodies were used targeting HSF1-total (catalog #4353; 1:1,000; Cell Signaling Technology), HSF1-pSer326 (catalog #ab76076; 1:10 000; Abcam), and Actin β (catalog #Sc-47778; 1:2,000; Santa Cruz Biotechnology, Dallas, TX).
HSF1 and HSF1 mutants’ construction and overexpression
pIRES-puro3 expression vectors were used containing an empty vector, RNA sequence targeting HSF1 S326A or HSF1 S326E mutants. The full method has been described elsewhere.34
Cell viability and chemicals
Quantification of leukemia cell viability was conducted by using water-soluble tetrazolium-1 cell proliferation assays as described previously.33 Cells were seeded at a density of 20 000 cells per 100 µL/well in a 96-well plate format and treated with appropriate inhibitor concentrations. The compounds used were BTZ (Bio-Connect Services, Huissen, The Netherlands) and etoposide (Accord Healthcare, Durham, NC).
Statistical analysis
Outcome data for each patient were calculated from June 30, 2019, with a median follow-up period of 4.4 years (range, 0.3-7.5 years). Estimates of OS and EFS were calculated by using the Kaplan-Meier method. OS and EFS were defined as time from study entry until death or until relapse, secondary malignancy, or death, respectively. Relapse risk (RR) was calculated by using methods of competing events and was defined as the time from the end of 2 courses of induction (for patients in CR) to relapse, where deaths without a relapse were considered competing events. The significance of predictor variables was tested with the log-rank statistic for OS, EFS, and with Gray’s statistic for RR. Cox proportional hazards models were used to estimate hazard ratios for univariable and multivariable analyses of OS and EFS. Competing risk regression models were used for analyses of RR. Outcome according to treatment arm was based on an intention-to-treat analysis.
Relative HSF1-pSer326 expression was initially examined for continuous vs step-wise correlations with outcome (supplemental Figure 1). HSF1-pSer326 protein expression negatively correlated with outcome in a step-wise fashion in ADEB-treated patients. Based on this observation, patients were divided according to relative HSF1-pSer326 expression into thirds. Proportions between the 3 clusters (low, medium, and high HSF1-pSer326) and categorical clinical variables were compared by using Pearson’s χ2 test. The medians of the continuous variables were compared by using the Kruskal-Wallis test. Pearson’s correlation analyses were performed to investigate correlations between HSF1-pSer326 protein expression levels and the other 294 proteins assessed on the RPPA and between gene expression data of HSF1 and 21 927 other genes. P values were adjusted by using false discovery rate correction. All statistical analyses were performed in R Version 1.3.959 (2009-2015, (RStudio, Inc., Boston, MA) or SAS version 9.4 (SAS Institute, Inc., Cary, NC).
Results
Heterogeneous protein expression of HSF1-pSer326 in pediatric AML samples
Relative protein expression levels of HSF1-total and HSF1-pSer326 were analyzed by using RPPA in myeloblast cells from 483 de novo pediatric AML patients and 20 pediatric and 10 adult CD34+ samples from healthy donors. Samples were collected at time of diagnosis before chemotherapy. HSF1-total was significantly lower in pediatric AML cells compared with CD34+ BM cells from healthy donors (P = 7.6E-09) (Figure 1A). Likewise, expression of HSF1-pSer326 was statistically lower in pediatric AML cells compared with nonmalignant CD34+ cells (P = 2.2E-12) (Figure 1B). To assess the correlation between expression of HSF1-total and HSF1-pSer326, Pearson’s correlation analysis was performed. This resulted in a modest correlation of 0.34 (P = 8.4 E-15); most variation in HSF1 phosphorylation intensities was observed in the patients who expressed higher levels of HSF1-total (Figure 1C).
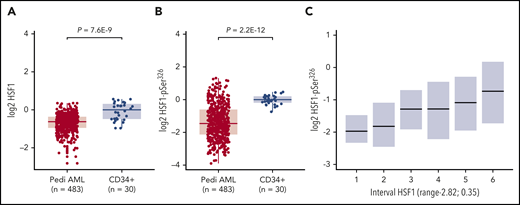
RPPA protein expression levels for HSF1-total and HSF1-pSer326. RPPA protein expression levels for the 483 de novo pediatric AML patients and 30 CD34+ BM samples, for HSF1-total (A) and HSF1-pSer326 (B). (C) Correlation between HSF1-total and HSF1-pSer326 protein expression. HSF1-total was divided into 6 equally sized groups. Boxplots represent the dispersion of HSF1-pSer326 expression. Lower HSF1-total samples express lower levels of HSF1-pSer326, whereas higher HSF1-total levels are associated with higher levels of HSF1-pSer326 and show more variation in HSF1-pSer326 phosphorylation.
RPPA protein expression levels for HSF1-total and HSF1-pSer326. RPPA protein expression levels for the 483 de novo pediatric AML patients and 30 CD34+ BM samples, for HSF1-total (A) and HSF1-pSer326 (B). (C) Correlation between HSF1-total and HSF1-pSer326 protein expression. HSF1-total was divided into 6 equally sized groups. Boxplots represent the dispersion of HSF1-pSer326 expression. Lower HSF1-total samples express lower levels of HSF1-pSer326, whereas higher HSF1-total levels are associated with higher levels of HSF1-pSer326 and show more variation in HSF1-pSer326 phosphorylation.
Low-HSF1-pSer326 protein expression is prognostically favorable in patients receiving BTZ
Among all patients (ADE and ADEB combined), HSF1-total expression was in general not predictive for OS, EFS, or CR duration. However, patients with the highest one-third HSF1-total protein expression experienced inferior OS and EFS compared with the lowest two-thirds (P = .032, P = .035, respectively), and a trend toward a higher RR (P = .078) (supplemental Figure 2A-C). Analysis of HSF1-pSer326 expression also showed no significant differences in outcome associated with increasing-HSF1-pSer326 expression levels (OS, P = .140; EFS, P = .203; RR, P = .375) (supplemental Figure 2D-F).
However, a very different picture emerged when the effect of HSF1-pSer326 level was assessed separately within the ADE or ADEB treatment groups (Figure 2). For those treated with ADE alone, the relative HSF1-pSer326 protein expression had no effect on OS, EFS, or RR (OS, P = .698; EFS, P = .572; RR, P = .535). In contrast, for those receiving BTZ-containing chemotherapy, the level of HSF1-pSer326 affected all 3 outcome measures; patients with middle or high HSF-pSer326 expression had stepwise decreases in OS and EFS associated with a corresponding increase in the relapse rate compared with those with low-HSF1-pSer326 (OS, P = .011; EFS, P = .002; RR, P = .006). The 5-year OS was 83% in the low-HSF1-pSer326 patients, vs 73% and 60% for the middle- and high-HSF1-pSer326 patients, respectively. The 5-year EFS decreased from 67% in low HSF1-pSer326 to 38% for high-HSF1-pSer326, and RR increased from 27% to 54%. This suggests that low-HSF1-pSer326 correlates with more favorable outcome in ADEB-treated pediatric AML patients. Although a similar trend was observed for HSF1-total, the effect was less strong compared with HSF1-pSer326 (supplemental Figure 3).
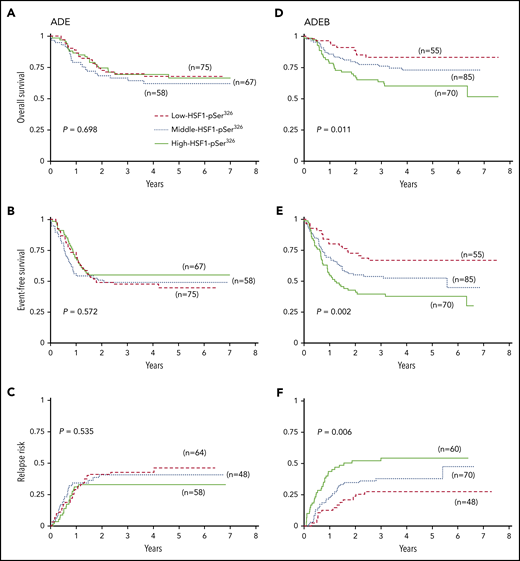
Kaplan-Meier survival curves for OS, EFS, and RR. (A) OS, (B) EFS, and (C) RR for patients treated without the addition of BTZ (left). (D) OS, (E) EFS, and (F) RR for patients treated with the addition of BTZ to ADE (right). Dashed red lines indicate low-HSF1-pSer326 patients, dotted blue lines represent middle-HSF1-pSer326, and solid green lines represent the high-HSF1-pSer326.
Kaplan-Meier survival curves for OS, EFS, and RR. (A) OS, (B) EFS, and (C) RR for patients treated without the addition of BTZ (left). (D) OS, (E) EFS, and (F) RR for patients treated with the addition of BTZ to ADE (right). Dashed red lines indicate low-HSF1-pSer326 patients, dotted blue lines represent middle-HSF1-pSer326, and solid green lines represent the high-HSF1-pSer326.
BTZ with ADE is beneficial in low-HSF1-pSer326 but not in high-HSF1-pSer326 patients
To evaluate whether the addition of BTZ to ADE therapy improved outcome compared with ADE alone, clinical outcome for low- and high-HSF1-pSer326 was compared between ADE and ADEB. Notably, the addition of BTZ significantly improved EFS and decreased the RR for those with low HSF1-pSer326 (5-year OS, 68% vs 83% [P = .056]; 5-year EFS, 44% vs 67% [P = .019]; 5-year RR, 46% vs 27%, [P = .049]) (Figure 3A-C). However, in high-HSF1-pSer326 patients, the trend was reversed: EFS decreased from 55% to 38% in the patients with BTZ (P = .035), and RR increased from 33% to 54% (P = .024) (Figure 3D-F). Therefore, the addition of BTZ improved the outcome of those with low-HSF1-pSer326, but as levels of HSF1-pSer326 rise, this beneficial effect is negated.
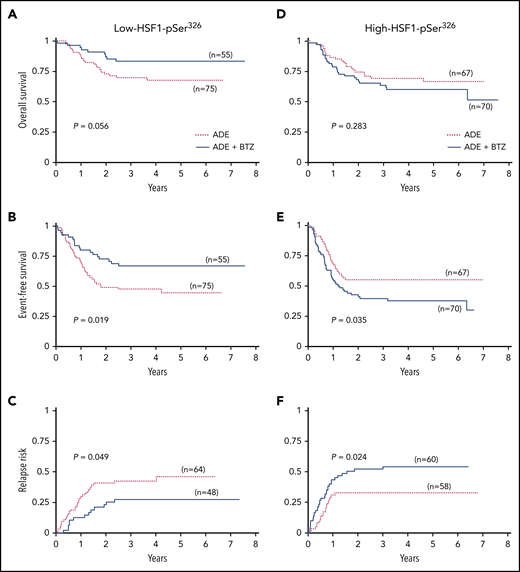
Kaplan-Meier survival curves for low-HSF1-pSer326 and high-HSF1-pSer326 treated with ADE vs ADEB. (A) OS, (B) EFS, and (C) RR for low-HSF1-pSer326 patients (left). (D) OS, (E) EFS, and (F) RR for high-HSF1-pSer326 patients (right). Dotted red lines indicate treatment with ADE alone, and solid blue lines represent the ADEB-treated patients.
Kaplan-Meier survival curves for low-HSF1-pSer326 and high-HSF1-pSer326 treated with ADE vs ADEB. (A) OS, (B) EFS, and (C) RR for low-HSF1-pSer326 patients (left). (D) OS, (E) EFS, and (F) RR for high-HSF1-pSer326 patients (right). Dotted red lines indicate treatment with ADE alone, and solid blue lines represent the ADEB-treated patients.
HSF1-pSer326 expression is independent of most clinical and patient characteristics
Because we observed a strong correlation with HSF1-pSer326 levels and outcome in the ADEB-treated patients, we evaluated for associations between HSF1-pSer326 levels and various demographic and clinical features (Table 1). Among these, 5 reported differences between the cohorts. CEBPα was most frequently mutated in patients with low-HSF1-pSer326 (16.2% vs 9.5% overall; P = .01); however, the good-risk translocation (8;21) was unexpectedly enriched in the high-HSF1-pSer326 patients (23.4% vs 15.9% overall; P = .01). Median peripheral blast percentage (52.5% vs 62%; P = .014), white blood cell count (34.6 × 10³/µL vs 55.4; P = .015), and absolute number of peripheral blasts (14.59 vs 27.9; P = .004) were all higher in the high-HSF1-pSer326 patients compared with the low- and middle-HSF1-pSer326 patients (supplemental Table 2).
HSF1-pSer326 as an independent predictor of survival in ADEB-treated patients
Univariable and multivariable analyses were next performed to determine if HSF1-pSer326 was an independent prognostic marker for OS, EFS, or RR in ADEB-treated patients. Independent predictors from univariate analysis were HSF1-pSer326 expression and the AAML1031 risk group stratification (supplemental Table 3). In multivariable analysis, both HSF1-pSer326 and AAML1031 risk remained an independent prognostic variable for OS and EFS, whereas HSF1-pSer326 was the only independent prognostic variable for RR (Table 2). For patients treated without BTZ, HSF1-pSer326 was not found to be an independent prognostic marker.
Multivariable analysis in ADEB-treated patients for OS, EFS, and RR.
| OS from study entry | EFS from study entry | RR from end of course 2 | |||||||||
|---|---|---|---|---|---|---|---|---|---|---|---|
| n | HR | 95% CI | P | HR | 95% CI | P | n | HR | 95% CI | P | |
| HSF1-pSer326 | |||||||||||
| Low | 52 | 1 | 1 | 48 | 1 | ||||||
| Middle | 83 | 2.10 | 0.89-4.95 | .090 | 1.92 | 1.07-3.43 | .028 | 70 | 1.60 | 0.84-3.04 | .156 |
| High | 69 | 3.58 | 1.56-8.22 | .003 | 2.94 | 1.65-5.24 | <.001 | 60 | 2.76 | 1.45-5.29 | .002 |
| Risk group | |||||||||||
| Low | 155 | 1 | 1 | 146 | 1 | ||||||
| High | 49 | 2.66 | 1.55-4.58 | <.001 | 2.18 | 1.42-3.34 | <.001 | 32 | 1.48 | 0.82-2.66 | .194 |
HR, hazard ratio.
HSF1-pSer326 sensitivity to BTZ in vitro
To determine if HSF1 phosphorylation affected BTZ potency in vitro, HSF1 variants34 were expressed in 293T cells. One HSF1 variant mimicked the nonphosphorylated-HSF1 state by replacing the phosphorylatable serine 326 (S326) with an unmodifiable (inert) alanine (S326A). The second mimicked the phosphorylated HSF1-pSer326 state by substituting glutamic acid (S326E), which simulates active pSer326. Cell viability assays were performed to assess the effect of HSF1 phosphorylation ON/OFF state on cell survival. Cells with overexpressed HSF1 S326E (increased/ON-state HSF1-pSer326 expression) were more resistant to BTZ, whereas cells that expressed HSF1 S326A (decreased/OFF-state HSF1-pSer326 expression) were more sensitive to BTZ compared with empty vector (Figure 4A). These 2 mutations of HSF1-pSer326 site had no effect on etoposide potency, suggesting that the serine 326 phosphorylation site is crucial for BTZ sensitivity (Figure 4B). To assess the effect of the 2 mutants on HSF1-pSer326, western blot analysis was used to quantify HSF1-pSer326 protein expression in each construct (Figure 4C).
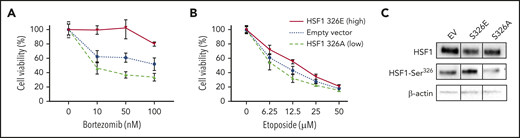
Reproduction HSF1-pSer326 sensitivity to BTZ in 293T cells. To assess the effect of high and low HSF1-pSer326 expression on BTZ (A) and etoposide (B) sensitivity, 293T cells were transfected with two HSF1-pSer326 mutants that mimicked high (solid line) and low (dashed line) HSF1-pSer326 patients, in addition to an empty vector as control (dotted line). (C) Effect of the 2 mutants on HSF1-pSer326 protein expression was confirmed by using western blot analysis.
Reproduction HSF1-pSer326 sensitivity to BTZ in 293T cells. To assess the effect of high and low HSF1-pSer326 expression on BTZ (A) and etoposide (B) sensitivity, 293T cells were transfected with two HSF1-pSer326 mutants that mimicked high (solid line) and low (dashed line) HSF1-pSer326 patients, in addition to an empty vector as control (dotted line). (C) Effect of the 2 mutants on HSF1-pSer326 protein expression was confirmed by using western blot analysis.
Effect of chemotherapy on HSF1-pSer326 expression is dependent on the relative abundance of HSF1-pSer326
HSF1 is a stress protein, and it has previously been shown that HSF1-pSer326 increases with BTZ treatment in multiple myeloma.21,35 To compare HSF1-pSer326 protein expression after chemotherapy in patients with high-HSF1-pSer326 vs low-HSF1-pSer326, we compared expression levels in pretreatment peripheral blood samples vs those collected at 10 and 24 hours after the start of chemotherapy. We observed that among patients with lower pretreatment expression of HSF1-pSer326 (Figure 5), expression levels increased after treatment (median + 0.7 log2) but did not reach the pretreatment levels observed in high HSF1-pSer326 patients. Those with high pretreatment HSF1-pSer326 had no change in the level of HSF1-pSer326 over time. These patterns were unaffected by which treatment arm was received (ADE vs ADEB) (supplemental Figure 4).
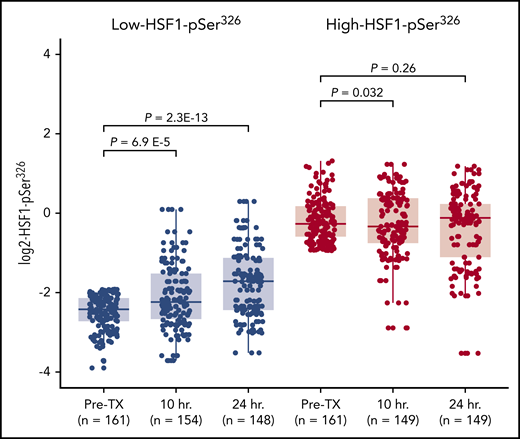
Change in HSF1-pSer326 protein expression after chemotherapy. This figure shows the change in HSF1-pSer326 expression following chemotherapy over time. Low-HSF1-pSer326 patients (pretreatment) are shown in light gray; high-HSF1-pSer326 patients (pretreatment) are shown in dark gray.
Change in HSF1-pSer326 protein expression after chemotherapy. This figure shows the change in HSF1-pSer326 expression following chemotherapy over time. Low-HSF1-pSer326 patients (pretreatment) are shown in light gray; high-HSF1-pSer326 patients (pretreatment) are shown in dark gray.
HSF1-pSer326 strongly correlated with translation and ribosomal proteins
The pediatric AML RPPA identified 90 of the other 294 analyzed proteins that were significantly correlated with HSF1-pSer326 (r ≥ 0.25 or r ≤ −0.25, P < .05/294 < 0.00017); 59 were negatively correlated, and 31 (including HSF1-total) were positively correlated (Figure 6; supplemental Table 4). Of the positively correlated proteins, 24 (77%) of 31 were proteins that had undergone posttranslational modifications, vs only 5 (8%) of 59 negatively correlated proteins, suggesting that the predominant method of HSF1-pSer326 effect is through pathway activation rather than by altering total protein expression. Proteins that were significantly correlated with HSF1-pSer326 included proteins involved in protein translation and ribosomal processes (eg, EIF4EBP1-pTyr37_46, EIF4E, RPS6-pSer235_236), as well as phospho-MAP kinase (known to be responsible for phosphorylation of HSF1), phospho-SMAD2, phospho-GSK3, phospho-MDM2, and phospho-AKT.
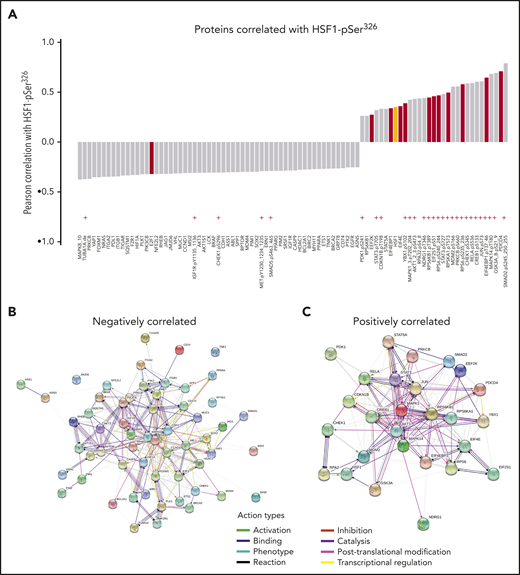
Proteins significantly correlated with HSF1-pSer326. (A) List of proteins significantly correlated with HSF1-pSer326 protein expression. Antibodies indicated with a red “+” are directed against posttranslationally modified sites. Proteins shown in red are involved in initiation or elongation of protein translation or in ribosomal processes. Total HSF1 is highlighted in yellow. (B-C) STRING network analysis of the positively and negatively correlated proteins.
Proteins significantly correlated with HSF1-pSer326. (A) List of proteins significantly correlated with HSF1-pSer326 protein expression. Antibodies indicated with a red “+” are directed against posttranslationally modified sites. Proteins shown in red are involved in initiation or elongation of protein translation or in ribosomal processes. Total HSF1 is highlighted in yellow. (B-C) STRING network analysis of the positively and negatively correlated proteins.
To determine if similar pathways could be identified computationally, Search Tool for the Retrieval of Interacting Genes/Proteins (STRING; https://string-db.org/) network analysis was performed using the proteins that were correlated with HSF1-pSer326. This resulted in a protein:protein enrichment P value <1.0−16. STRING analysis revealed that HSF1-pSer326 associations were enriched for proteins associated with protein binding, translation regulation, RNA binding, ribonucleoprotein complex binding, translation factor activity, and heat shock protein binding (supplemental Table 5).
HSF1-pSer326 protein relationships to HSF1 transcript expression
To compare HSF1 transcript levels with HSF1-total protein abundance, we correlated HSF1 messenger RNA levels from 390 pediatric AML patients with HSF1 transcripts to HSF1-total and HSF1-pSer326 RPPA protein data. This resulted in a Pearson’s correlation coefficient between messenger RNA and protein profiles of 0.18 for HSF1-total (P = .00028), corresponding to previous studies which showed that the correlation between high-throughput genomic and proteome analyses is low and varies between 0.17 and 0.40 (supplemental Figure 5A).36-40 As expected, correlation between HSF1 messenger RNA and HSF1-pSer326 protein levels was even less marked (R = 0.079; P = .12) (supplemental Figure 5B) as gene expression profiling (GEP) cannot assess posttranslational modifications.
Although HSF1-total protein expression by RPPA and HSF1 gene expression by RNA-sequencing did not correlate, we next wanted to determine if proteins correlated with HSF1-pSer326 also tracked with HSF1 gene expression. Correlations between HSF1 and 21 927 genes were examined in a large cohort of 1063 pediatric patients with AML enrolled on the AAML1031 clinical trial (including 390 of our 1063 cases). This resulted in 228 significantly correlated genes with a correlation coefficient ≥0.45 (supplemental Table 6). Among the 90 proteins with expression correlated to HSF1-pSer326, gene expression was available for 85 genes (10 of 90 proteins were not measured by GEP and for 4, the antibody measured 2 or 3 isoforms; eg, for protein GSK3A_B-pSer21_9, we had gene expression data for both GSK3A and GSK3B available). Among the 31 of 90 positively correlated RPPA proteins, only AKT1, AKT2, MAPK3, MDM2, and EIF4EBP1 had a correlation coefficient ≥0.35 with GEP. Among the 59 negatively correlated proteins, genes CASP9, MUC1, and TUBA1A had the strongest correlation (≥0.35) with HSF1-pSer326.
Discussion
This article shows, for the first time, that response to BTZ-containing chemotherapy in pediatric AML is associated with HSF1-pSer326 phosphorylation. Using 483 samples obtained from the AAML1031 phase 3 clinical trial in pediatric AML, we measured protein abundance for HSF1-total and HSF1-pSer326 in samples that were collected at time of diagnosis (pretreatment). A heterogeneous expression of HSF1-pSer326 was observed, whereas expression of HSF1-total was much more homogeneously expressed. The greatest variation in expression was observed in patients who expressed higher levels of HSF1-total, making intuitive sense as a given amount of HSF1-total is needed to be expressed before it can be phosphorylated. When patient outcomes were examined based on treatment arm, we observed that, in patients treated with BTZ-containing chemotherapy (ADEB), a significant amount of stratification was present, with outcome improving for those with lower HSF1-pSer326 but with worse survival for those with high HSF1-pSer326 expression. In patients treated with ADE alone, no stratification in outcome based on HSF1-pSer326 expression was observed. For those patients with low-HSF-pSer326, the addition of BTZ to standard chemotherapy significantly improved outcome, whereas EFS and RR significantly worsened in high-HSF1-pSer326 patients after the addition of BTZ. These results were supported in vitro where BTZ sensitivity was altered by using gene constructs creating obligate phosphorylated and nonphosphorylatable forms of HSF1. Results showed that cells with constitutively active HSF1 were much less sensitive to BTZ than cells transfected with nonphosphorylated HSF1. These data imply that HSP activity (phosphorylation), and by extension the resulting downstream consequences, contribute to the regulation of BTZ.
We hypothesize that patients with low-HSF1-pSer326 are more sensitive to BTZ, as reduced activity of HSF1 would be less likely to protect the cells from the pro-apoptotic effects of BTZ-containing chemotherapy. In addition, the observation that cells with high baseline HSF1-pSer326 expression were not able to further upregulate their phosphorylation suggests that their stress response was already fully activated, thereby acting as a potential BTZ resistance mechanism. High-HSF1-pSer326 could reflect high pretreatment cell stress. These leukemia cells would be used to high levels of proteotoxic stress and would be less sensitive to increased cell stress caused by BTZ. Further experiments are required to test these hypotheses.
Although survival rates of pediatric AML have greatly improved over the last decades, curability remains low, with an OS of ∼65% to 70%, indicating that better therapies are needed to improve outcomes. Although the AAML1031 study recently concluded that BTZ should not be used in children with de novo AML in combination with standard chemotherapy,10 as it failed to improve 3-year EFS or OS, we wanted to identify a subgroup of patients that did benefit from the addition of BTZ, to improve outcome. The crucial observation of our study is that the addition of BTZ improved the survival of a significant percentage of patients and that there is an adverse effect associated with the addition of BTZ to a second subset of patients. Lacking the means to identify one subset from the other, the overall conclusion that the addition of BTZ did not improve clinical outcome missed this finding, creating a type II or false-negative error. The BTZ-sensitive cohort had an increase in the EFS from 44% to 67% (+23%) at 5 years. If this was achieved in the one-third of patients with the BTZ-sensitive HSF1-pSer326 profile, then 8 additional patients per 100 diagnosed with AML would be alive and event-free after 5 years, a significant improvement in the cure rate. Given the decrease in survival with the BTZ addition in high-HSF1-pSer326 patients, this again emphasizes the need for clear predictive cutoff points, when utilizing HSF1-pSer326 in the process of therapy selection. We would envision this being done with a more direct assay than RPPA, such as an enzyme-linked immunosorbent assay or other protein-based method that is quick and has good sensitivity and specificity. Antibodies are currently available for assembling such an assay.
Because we are in an era in which there are increasingly more targeted therapies and where genetics define smaller and smaller subsets of patients, it becomes more important to match the right patient to the right drug(s). To choose therapies most beneficial for each patient, an enzyme-linked immunosorbent assay could be used to identify patients most likely to benefit from BTZ-containing chemotherapy. This assay would quickly quantify HSF1-pSer326 protein expression and could identify which patients might benefit from additional BTZ therapy. For those patients who do not fall into this category, the development of a (phosphorylation) HSF1 inhibitor should be continued35,41 to effectively suppress the function of HSF1 and in turn sensitize high-HSF1-pSer326 patients to the BTZ addition. Although this approach first requires testing, it could expand the cohort of patients benefiting from BTZ. Potentially, these inhibitors could also be used to augment sensitivity of low-HSF1-pSer326 patients who are already sensitive. Despite testing in several phase 1 clinical trials, however, HSF1 inhibitors have been difficult to use in the clinic. Although exhibiting potent anticancer effects, in vitro, their lack of specificity often results in off-target effects. Utilization of a useful inhibitor would therefore require further in vitro and in vivo studies. Testing in combination with other compounds should be considered, as that may increase effectiveness and limit toxicity.
In summary, decreased expression of HSF1-pSer326 correlated with increased response to BTZ-containing chemotherapy in pediatric AML and suggests that the HSF1-pSer326 abundance may be important in BTZ-containing chemotherapy selection.
Data will be provided in the data supplement. Data will also be deposited to "www.leukemiaatlas.org."
The online version of this article contains a data supplement.
The publication costs of this article were defrayed in part by page charge payment. Therefore, and solely to indicate this fact, this article is hereby marked “advertisement” in accordance with 18 USC section 1734.
Acknowledgments
The authors thank Yoshihiko Hirohashi (Sapporo Medical University School of Medicine, Sapporo, Japan) for the mammalian expression plasmids encoding the HSF1 mutations.
T.M.H. was funded by the National Institutes of Health, National Cancer Institute COG Grants (U10 CA98543, U10 CA98413, U10 CA180886, 1U24-CA196173, and U10 CA180899), the St Baldrick’s Foundation, the National Institutes of Health, National Cancer Institute grant R01-CA164024, and a grant from Takeda Pharmaceuticals. F.W.H. was funded by the Junior Scientific Masterclass, the Van der Meer Boerema Foundation, and the Ter Meulen Grant of the Royal Netherlands Academy of Arts and Sciences.
Authorship
Contribution: F.W.H., E.S.J.M.d.B., S.W.M.B., S.M.K., and T.M.H. designed and supervised the research; F.W.H., A.D.v.D., Y.Q., and G.N.J. performed research; A.S.G., R.A., E.A.K., T.A.A., S.M.K, and T.M.H. collected data; F.W.H., P.P.R., R.B.G., A.R.L., S.M., S.M.K., and T.M.H. analyzed data; and F.W.H., S.M.K., and T.M.H. wrote the paper.
Conflict-of-interest disclosure: T.M.H. receives research funding from Takeda Pharmaceuticals. The remaining authors declare no competing financial interests.
Correspondence: Terzah M. Horton, Department of Pediatrics, Baylor College of Medicine/Dan L. Duncan Cancer Center and Texas Children’s Cancer and Pediatric Centers, 1102 Bates, Suite 750, Houston, TX 77030; e-mail: tmhorton@txch.org.

This feature is available to Subscribers Only
Sign In or Create an Account Close Modal