

Key Points
The pediatric DRI stratified children with AML and ALL into clinically distinct risk groups based on pretransplantation information.
Risk stratification was based on age at transplant, cytogenetics, and disease status including minimal residual disease at transplant.

Abstract
A disease risk index (DRI) that was developed for adults with hematologic malignancy who were undergoing hematopoietic cell transplantation is also being used to stratify children and adolescents by disease risk. Therefore, to develop and validate a DRI that can be used to stratify those with AML and ALL by their disease risk, we analyzed 2569 patients aged <18 years with acute myeloid (AML; n = 1224) or lymphoblastic (ALL; n = 1345) leukemia who underwent hematopoietic cell transplantation. Training and validation subsets for each disease were generated randomly with 1:1 assignment to the subsets, and separate prognostic models were derived for each disease. For AML, 4 risk groups were identified based on age, cytogenetic risk, and disease status, including minimal residual disease status at transplantation. The 5-year leukemia-free survival for low (0 points), intermediate (2, 3, 5), high (7, 8), and very high (>8) risk groups was 78%, 53%, 40%, and 25%, respectively (P < .0001). For ALL, 3 risk groups were identified based on age and disease status, including minimal residual disease status at transplantation. The 5-year leukemia-free survival for low (0 points), intermediate (2-4), and high (≥5) risk groups was 68%, 51%, and 33%, respectively (P < .0001). We confirmed that the risk groups could be applied to overall survival, with 5-year survival ranging from 80% to 33% and 73% to 42% for AML and ALL, respectively (P < .0001). This validated pediatric DRI, which includes age and residual disease status, can be used to facilitate prognostication and stratification of children with AML and ALL for allogeneic transplantation.
Medscape Continuing Medical Education online
In support of improving patient care, this activity has been planned and implemented by Medscape, LLC and the American Society of Hematology. Medscape, LLC is jointly accredited by the Accreditation Council for Continuing Medical Education (ACCME), the Accreditation Council for Pharmacy Education (ACPE), and the American Nurses Credentialing Center (ANCC), to provide continuing education for the healthcare team.
Medscape, LLC designates this Journal-based CME activity for a maximum of 1.00 AMA PRA Category 1 Credit(s)™. Physicians should claim only the credit commensurate with the extent of their participation in the activity.
Successful completion of this CME activity, which includes participation in the evaluation component, enables the participant to earn up to 1.0 MOC points in the American Board of Internal Medicine’s (ABIM) Maintenance of Certification (MOC) program. Participants will earn MOC points equivalent to the amount of CME credits claimed for the activity. It is the CME activity provider’s responsibility to submit participant completion information to ACCME for the purpose of granting ABIM MOC credit.
All other clinicians completing this activity will be issued a certificate of participation. To participate in this journal CME activity: (1) review the learning objectives and author disclosures; (2) study the education content; (3) take the post-test with a 75% minimum passing score and complete the evaluation at http://www.medscape.org/journal/blood; and (4) view/print certificate. For CME questions, see page 1001.
Disclosures
Associate Editor Catherine M. Bollard served as advisor or consultant for Cabaletta Bio, Catamaran Bio, Inc. and Mana Therapeutics and owns stocks, stock options, or bonds from Neximmune Inc. and Repertoire Immune Medicines. CME questions author Laurie Barclay, freelance writer and reviewer, Medscape, LLC and the authors declare no competing financial interests.
Learning objectives
Upon completion of this activity, participants will be able to:
Describe development of the pediatric disease risk index (DRI) for stratifying children and adolescents with acute myeloid (AML) and acute lymphoblastic (ALL) leukemia undergoing hematopoietic cell transplantation (HCT) into risk groups according to patient and disease characteristics
Determine validation of the pediatric DRI for stratifying children and adolescents with AML and ALL undergoing HCT into risk groups according to patient and disease characteristics
Identify clinical implications of the pediatric DRI for stratifying children and adolescents with AML and ALL undergoing HCT into risk groups according to patient and disease characteristics
Release date: February 18, 2021; Expiration date: February 18, 2022
Introduction
Despite an overall improvement in outcomes in the most recent decade, disease relapse remains the major cause of failure after hematopoietic cell transplantation (HCT). Disease characteristics, such as primary diagnosis, cytogenetic abnormalities, and disease status, affect the risk of relapse and, subsequently, survival after HCT. In adults with hematologic malignancy, these disease attributes were used to derive a disease risk index (DRI), a tool to categorize patients into 4 distinct risk groups for overall survival.1,2 The DRI assigned adults with acute myeloid leukemia (AML) with favorable cytogenetics and in complete remission to low risk, and those with AML, intermediate-risk cytogenetics in complete remission, and acute lymphoblastic leukemia (ALL) in first complete remission to intermediate risk. Other combinations of disease status for ALL and AML, regardless of cytogenetic risk are assigned high or very high risk.2 Characteristics that determine survival after transplantation in adults with AML and ALL may differ in children and adolescents. Notable differences between adults and children include the effect of age on survival after transplantation3 and the indication and timing of transplantation. Chemotherapy alone remains the accepted standard for treatment of standard-risk AML and ALL in children and adolescents.3,4 Transplantation is generally reserved for those in whom chemotherapy fails but who achieve a subsequent remission or are in the first complete remission of high-risk leukemia.5,6 In an analysis of 280 patients aged <18 years with hematologic malignancy who were enrolled in the Mount Sinai Acute GVHD International Consortium, the DRI (that was developed for adults with hematologic malignancy)1,2 did not distinguish survival differences between intermediate- and high-risk groups (hazard ratio [HR] 1.3; 95% confidence interval [CI], 0.70-2.20) but survival was lower for the very-high-risk group (HR, 3.2; 95 CI, 1.6-6.4, P = .008).7 Therefore, in the current analyses, we sought to develop a prognostic tool (pediatric DRI) to stratify children and adolescents with AML and ALL who undergo HCT into risk groups based on patient and disease characteristics that are known when patients and their families are counseled on treatment options. We chose leukemia-free survival as the primary end point, because leukemia relapse is the predominant cause of treatment failure in children and adolescents with AML and ALL, but also validated the pediatric DRI for overall survival.8,9
Methods
Patients
Data were obtained from the Center for International Blood and Marrow Transplant Research, a voluntary working group from transplantation centers that report data on consecutive transplantations. Patients are followed longitudinally. Data are collected on standardized reporting forms and subjected to audit. Written informed consent for data collection and research was obtained in accordance with the Declaration of Helsinki of 1975. Included were 2569 patients aged <18 years with AML or ALL who received their first allogeneic transplant between 2008 and 2017 in the United States. Transplantations used bone marrow, peripheral blood, or umbilical cord blood from HLA-matched siblings, HLA-mismatched relatives, or HLA-matched or -mismatched unrelated donors, and all received myeloablative conditioning regimens. The modest number of patients prohibited us from developing training and validation groups for myelodysplastic syndrome, juvenile myelomonocytic leukemia, chronic myeloid leukemia, and Hodgkin and non-Hodgkin lymphoma, and those patients were excluded from the current analysis. This study was approved by the Institutional Review Board of the National Marrow Donor Program.
Outcomes
Leukemia-free survival was the primary end point and was defined as survival in remission. Death and leukemia recurrence or persistence were considered events (treatment failure). Molecular, cytogenetic, or hematologic recurrence was considered a recurrence. Overall survival was a secondary end point, and death from any cause was considered an event. Surviving patients were censored at the last follow-up.
Statistical analysis
Patients with AML (n = 1224) or ALL (n = 1345) were randomly assigned (1:1) to training and validation subsets. The training subset was used to develop a prognostic scoring system, and the validation subset was used to assess the prognostic ability of the scoring system. The Cox proportional hazards model with a stepwise selection procedure was used to identify significant variables for leukemia-free survival.10 Patient and disease characteristics tested include: age, sex, recipient cytomegalovirus serostatus, performance score, HCT comorbidity index, cytogenetic risk, and disease status, including minimal residual disease (MRD) at transplantation. For ALL, the effect of immunophenotype (B- or T-cell lineage) was examined. The models also considered a potential effect of donor/graft type. Forward selection and backward elimination procedures were used to confirm significant variables (2-sided P ≤ .05). The age cutoffs at 3 years for AML and 2 years for ALL were determined statistically by using the maximum likelihood approach. To determine the optimal age cutoff, we examined each year (1, 2, … years) to identify the cutoff that produced the maximum likelihood. The proportional hazards assumption for each variable was tested, and interaction terms were examined. Scores were assigned based on the final Cox model. A score of 0 was assigned to the reference group and integers closest to the relative magnitude of the log(hazard ratio [HR]) associated with patient and disease characteristics were assigned to each characteristic. As an example, if a variable has 3 groups with HRs 1, 1.5, and 1.8, where the first group is the reference, The log(HRs) for the other groups are 0, 0.41, and 0.59, respectively. The ratio of 0.41 to 0.59 is ∼2:3 and will be assigned score 2 and score 3 to in second and third groups, respectively. Because the score assigned to risk factors was different in ALL and AML, separate models were derived for each disease. Scores were grouped approximately based on the percentiles of associated HRs (<25th, 25th-50th, 50th-75th, and >75th percentiles for AML, and <33th, 33th-67th, and >67 percentiles for ALL) into low-, intermediate, high-, and very-high-risk groups for AML and into low-, intermediate- and high-risk groups for ALL. Brier scores were used to assess the score’s predictive ability.11,12 Analyses were performed with SAS 9.4 (SAS Institute Inc, Cary, NC) and the R package.13
Results
Patient, disease, and transplant characteristics
The characteristics of training and validation subsets of patients with AML and ALL are shown in Tables 1 and 2. Most patients with AML were aged ≥3 years at transplantation; were cytomegalovirus seropositive; and had an HCT comorbidity score ≤2, intermediate- or poor-risk cytogenetics, and an MRD− first or second complete remission Table 1). Cytogenetic risk was assigned according to published criteria.12 Approximately half of transplantations used HLA-matched donors. Non–total body irradiation (TBI)–containing conditioning regimens were more commonly used than TBI-containing regimens, and the predominant graft-versus-host disease (GVHD) prophylaxis included a calcineurin inhibitor with mycophenolate or methotrexate (Table 1). Most patients with ALL were aged ≥2 years at transplantation, were cytomegalovirus seropositive, and had an HCT comorbidity score ≤2, intermediate-risk cytogenetics, and an MRD− first or second complete remission (Table 2). Cytogenetic risk was assigned according to published criteria.13 Approximately half of transplants were derived from HLA-matched donors, with TBI-containing conditioning regimens, and a calcineurin inhibitor with mycophenolate or methotrexate GVHD prophylaxis was predominant. The median (interquartile range [IQR]) follow-up of patients with AML in training and validation subsets were 48 months (5-128) and 48 months (11-123), respectively. The corresponding follow-up for patients with ALL was 45 (3-125) and 39 (6-123) months.
AML: patient, disease, and transplantation characteristics
| Variable | Training cohort | Validation cohort | P |
|---|---|---|---|
| Patients, n | 612 | 612 | |
| Age at transplantation, y* | .47 | ||
| <3 y | 152 (25) | 163 (27) | |
| ≥3 y | 460 (75) | 449 (73) | |
| Sex | .69 | ||
| Male | 321 (52) | 328 (54) | |
| Female | 291 (48) | 284 (46) | |
| Hematopoietic comorbidity index score | .35 | ||
| ≤2 | 505 (83) | 507 (83) | |
| ≥3 | 107 (17) | 103 (17) | |
| Not reported | 0 | 2 (< 1) | |
| Performance score | .64 | ||
| 90-100 | 517 (84) | 527 (86) | |
| ≤80 | 90 (15) | 79 (13) | |
| Not reported | 5 (1) | 6 (1) | |
| Cytomegalovirus serostatus | .16 | ||
| Negative | 239 (39) | 207 (34) | |
| Positive | 365 (60) | 395 (65) | |
| Not reported | 8 (1) | 10 (2) | |
| Cytogenetic risk† | .80 | ||
| Favorable | 53 (9) | 47 (8) | |
| Intermediate | 377 (62) | 401 (66) | |
| Poor | 167 (27) | 150 (25) | |
| Not reported | 15 (2) | 14 (2) | |
| Disease status | .44 | ||
| 1st complete remission MRD+ | 91 (15) | 84 (14) | |
| 1st complete remission MRD− | 205 (33) | 223 (36) | |
| 1st complete remission | 24 (4) | 24 (4) | |
| 2nd complete remission MRD+ | 42 (7) | 42 (7) | |
| 2nd complete remission MRD− | 135 (22) | 134 (22) | |
| 2nd complete remission | 15 (2) | 13 (2) | |
| Not in remission | 96 (15) | 92 (15) | |
| Donor | .06 | ||
| HLA-matched sibling | 114 (19) | 143 (23) | |
| HLA-mismatched relative | 54 (9) | 35 (6) | |
| HLA-matched unrelated | 177 (29) | 167 (27) | |
| 1-locus mismatched unrelated | 66 (11) | 60 (10) | |
| 6-8/8 HLA-matched cord blood | 109 (18) | 129 (21) | |
| ≤5/8 HLA-matched cord blood | 92 (15) | 78 (13) | |
| Conditioning regimen | .82 | ||
| TBI/cyclophosphamide | 43 (7) | 49 (8) | |
| TBI/cyclophosphamide/fludarabine | 76 (12) | 67 (11) | |
| TBI/cyclophosphamide+other | 23 (4) | 23 (4) | |
| TBI+other | 29 (5) | 24 (4) | |
| Busulfan/cyclophosphamide | 261 (43) | 276 (45) | |
| Busulfan/melphalan | 42 (7) | 33 (5) | |
| Fludarabine/busulfan/thiotepa | 138 (23) | 140 (23) | |
| GVHD prophylaxis | .89 | ||
| Ex vivo T-cell depletion/CD34 selection | 36 (6) | 30 (5) | |
| Posttransplantation CY, with or without other(s) | 28 (5) | 23 (4) | |
| Calcineurin inhibitor+mycophenolate | 217 (35) | 210 (34) | |
| Calcineurin inhibitor+methotrexate | 264 (43) | 285 (47) | |
| Calcineurin inhibitor, with or without other | 50 (8) | 50 (8) | |
| Other | 17 (2) | 14 (2) | |
| Transplantation period | .91 | ||
| 2008-2012 | 221 (36) | 223 (36) | |
| 2013-2017 | 391 (64) | 389 (64) |
Data are the number of patients (percentage of subgroup), unless stated otherwise.
CY, cyclophosphamide.
Age distribution. Training cohort: n = 152 (25%) aged <3 y, n = 117 (19%) aged 3-6 y, n = 122 (20%) aged 7-11 y, and n = 221 (36%) aged 12-18 y. Validation cohort, n = 163 (27%) aged <3 y, n = 115 (19%) aged 3-6 y, n = 118 (19%) aged 7-11 y, and n = 216 (35%) aged 12-18 y.
Cytogenetic risk: favorable (inv(16), t(16;16), t(15;17), and t(8;21)) without complex abnormality; poor (−5/5q, −7/7q, FLT3/internal tandem duplication with high allelic ratio, t(6;9), 3q); intermediate (all others).
ALL: patient, disease, and transplantation characteristics
| Variable | Training cohort n (%) | Validation cohort n (%) | P |
|---|---|---|---|
| Patients, n | 673 | 672 | |
| Age at transplantation, y* | .81 | ||
| <2 y | 35 (5) | 33 (5) | |
| ≥2 y | 638 (95) | 639 (95) | |
| Sex | .22 | ||
| Male | 407 (60) | 428 (64) | |
| Female | 266 (40) | 244 (36) | |
| Hematopoietic comorbidity index score | .61 | ||
| ≤2 | 561 (83) | 560 (83) | |
| ≥3 | 112 (17) | 111 (17) | |
| Not reported | 0 | 1 (<1) | |
| Performance score | .93 | ||
| 90-100 | 560 (83) | 556 (83) | |
| ≤80 | 102 (15) | 106 (16) | |
| Not reported | 11 (2) | 10 (1) | |
| Cytomegalovirus serostatus | .59 | ||
| Negative | 247 (37) | 265 (39) | |
| Positive | 420 (62) | 401 (60) | |
| Not reported | 6 (1) | 6 (1) | |
| Cytogenetic risk† | .21 | ||
| Intermediate | 394 (59) | 376 (56) | |
| Poor | 235 (35) | 262 (39) | |
| Not reported | 44 (7) | 34 (5) | |
| Disease status | .61 | ||
| 1st complete remission MRD+ | 89 (13) | 82 (12) | |
| 1st complete remission MRD− | 173 (26) | 165 (25) | |
| 1st complete remission | 8 (1) | 13 (2) | |
| 2nd complete remission MRD+ | 71 (11) | 85 (13) | |
| 3rd complete remission MRD+ | 20 (3) | 13 (2) | |
| 2nd complete remission MRD− | 215 (32) | 220 (33) | |
| 3rd complete remission MRD− | 44 (7) | 50 (7) | |
| ≥2nd complete remission | 21 (3) | 23 (3) | |
| Not in remission | 32 (5) | 21 (3) | |
| Donor | .83 | ||
| HLA-matched sibling | 123 (18) | 132 (20) | |
| HLA-mismatched relative | 61 (9) | 56 (8) | |
| HLA-matched unrelated | 168 (25) | 167 (25) | |
| 1-locus mismatched unrelated | 64 (10) | 69 (10) | |
| 6-8/8 HLA-matched cord blood | 145 (22) | 152 (23) | |
| ≤5/8 HLA-matched cord blood | 112 (17) | 96 (14) | |
| Conditioning regimen | .78 | ||
| TBI/cyclophosphamide | 251 (37) | 227 (34) | |
| TBI/cyclophosphamide/fludarabine | 158 (23) | 176 (26) | |
| TBI/cyclophosphamide+other | 166 (25) | 164 (24) | |
| TBI+other | 58 (9) | 68 (10) | |
| Busulfan/cyclophosphamide | 13 (2) | 13 (2) | |
| Busulfan/melphalan | 10 (1) | 8 (1) | |
| Fludarabine/busulfan/thiotepa | 17 (3) | 16 (2) | |
| GVHD prophylaxis | .15 | ||
| Ex vivo T-cell depletion/CD34 selection | 42 (6) | 33 (5) | |
| Post-transplantation CY, with or without other(s) | 21 (3) | 36 (5) | |
| Calcineurin inhibitor+mycophenolate | 247 (37) | 238 (40) | |
| Calcineurin inhibitor+methotrexate | 304 (45) | 306 (46) | |
| Calcineurin inhibitor, with or without other | 46 (7) | 47 (8) | |
| Other | 13 (2) | 12 (2) | |
| Transplantation period | .52 | ||
| 2008-2012 | 196 (29) | 185 (28) | |
| 2013-2017 | 477 (71) | 487 (72) |
Data are the number of patients (percentage of subgroup), unless stated otherwise.
CY, cyclophosphamide.
Age distribution. Training cohort: n = 35 (5%) aged <2 y, n = 190 (28%) aged 2-6 y, n = 201 (30%) aged 7-11 y, and n = 247 (37%) aged 12-18 y. Validation cohort: n = 33 (4%) aged <2 y, n = 180 (27%) aged 2-6 y, n = 228 (34%) aged 7-11 y, and n = 231 (34%) aged 12-18 y.
Cytogenetic risk: poor ((t9;22), iAMP21, abnormal 17p, loss of 13q, and 11q23 [infant]); intermediate (all others).
Development of a prognostic scoring system
Table 3 summarizes the variables relevant to leukemia-free survival identified in multivariate analyses of 612 patients with AML and 673 patients with ALL (training subset). Three independent predictors were associated with lower leukemia-free survival of AML. These include age <3 years, intermediate- or poor-risk cytogenetics, and second complete remission and MRD positivity or relapse at transplantation. Intermediate- and poor-risk cytogenetics were grouped, because we did not observe a significant difference between the 2 categories (HR, 1.12; 95% CI, 0.86-1.45; P = .41). Based on the magnitude of the log(HR), weighted points were assigned for age, cytogenetic risk, and disease status, the combination of which ranged from 0 to 12 points. Two independent predictors were associated with lower leukemia-free survival for ALL, including age <2 years, second complete remission, and MRD positivity or negativity and relapse at transplantation. Weighted points were assigned for age and disease status and ranged from 0 to 8 points. Patient characteristics that were studied and not associated with leukemia-free survival for AML and ALL included sex, hematopoietic comorbidity score, performance score, and cytomegalovirus serostatus. Immunophenotype, B-and T-cell lineage, and cytogenetic risk were not associated with leukemia-free survival in ALL. An effect of donor type was examined for both AML and ALL. The effect of predictors associated with leukemia-free survival is independent of the effect of donor type.
Development of prognostic scoring system
| Variable | HR (95% CI) | P | Points |
|---|---|---|---|
| AML | |||
| Age, y | .0031 | ||
| ≥3 | 1.00 | 0 | |
| <3 | 1.45 (1.13-1.86) | 2 | |
| Disease status | <.0001 | ||
| 1st complete remission MRD− | 1.00 | 0 | |
| 1st complete remission MRD+ | 1.08 (0.76-1.55) | 0 | |
| 2nd complete remission MRD− | 0.89 (0.63-1.26) | 0 | |
| 2nd complete remission MRD+ | 1.81 (1.18-2.77) | 3 | |
| Not in remission | 2.55 (1.87-3.46) | 5 | |
| Cytogenetic risk | .0083 | ||
| Favorable | 1.00 | 0 | |
| Intermediate/poor | 2.37 (1.36-4.11) | 5 | |
| ALL | |||
| Age, y | .0042 | ||
| ≥2 | 1.00 | 0 | |
| <2 | 2.05 (1.25-3.36) | 3 | |
| Disease status | .0001 | ||
| 1st complete remission MRD− | 1.00 | 0 | |
| 1st complete remission MRD+ | 1.04 (0.67-1.62) | 0 | |
| ≥2nd complete remission MRD− | 1.52 (1.09-2.11) | 2 | |
| ≥2nd complete remission MRD+ | 2.17 (1.46-3.21) | 4 | |
| Not in remission | 2.57 (1.52-4.33) | 5 |
Validation of prognostic scoring system
We used the prognostic scoring system to calculate a risk score for patients in the training subset for whom complete data were available for the 3 independent predictors of leukemia-free survival for AML (n = 37 patients excluded for whom MRD status was not reported). Based on these data, we applied the risk score to the validation subset (Table 4). Similarly, using the prognostic scoring system developed for ALL, we calculated a risk score for patients in the training subset and thereafter applied it to the validation subset (n = 36 patients excluded for whom MRD status was not reported). In a subset analysis of patients aged 12 to 18 years, we confirmed the predictability of the DRI for AML (Brier score, 0.164; P = .0002) and ALL (Brier score, 0.174; P = .019). The clinical characteristics that constitute the risk groups for a pediatric DRI are summarized in Table 5.
Leukemia-free survival by risk group in the training and validation subsets
| Training subset | Validation subset Brier score* | |||||
|---|---|---|---|---|---|---|
| Risk group | n | HR (95% CI) | P | n | HR (95% CI) | P |
| AML | ||||||
| Low | 34 | 1.00 | <.0001 | 29 | 1.00 | <.0001 |
| Intermediate | 291 | 1.91 (0.93-3.91) | .0764 | 308 | 3.05 (1.25-7.45) | .0114 |
| High | 144 | 3.22 (1.56-6.662) | .0016 | 138 | 4.87 (1.97-12.02) | .0006 |
| Very high | 93 | 5.65 (2.72-11.73) | <.0001 | 92 | 8.10 (3.26-20.11) | <.0001 |
| ALL | ||||||
| Low | 238 | 1.00 | <.0001 | 227 | 1.00 | <.0001 |
| Intermediate | 364 | 1.56 (1.19-2.04) | .0014 | 379 | 1.72 (1.29-2.28) | .0002 |
| High | 42 | 2.90 (1.88-4.48) | <.0001 | 30 | 3.55 (2.15-5.85) | <.0001 |
n, number evaluable.
AML, 0.154; ALL, 0.152.
Risk groups: pretransplantation clinical characteristics
| Risk group | Age, y | Disease status | Cytogenetic risk |
|---|---|---|---|
| AML | |||
| Low | ≥3 | 1st CR MRD− | Favorable |
| 1st CR MRD+ | |||
| 2nd CR MRD− | |||
| Intermediate | ≥3 | 1st CR MRD− | Intermediate/poor |
| 1st CR MRD+ | |||
| 2nd CR MRD− | |||
| 2nd CR MRD+ | Favorable | ||
| Not in remission | Favorable | ||
| <3 | 1st CR MRD− | Favorable | |
| 1st CR MRD+ | |||
| 2nd CR MRD− | |||
| 2nd CR MRD+ | |||
| High | ≥3 | 2nd CR MRD+ | Intermediate/poor |
| <3 | 1st CR MRD− | Intermediate/poor | |
| 1st CR MRD+ | |||
| 2nd CR MRD− | |||
| Not in remission | Favorable | ||
| Very high | ≥3 | Not in remission | Intermediate/poor |
| <3 | 2nd CR MRD+ | Intermediate/poor | |
| Not in remission | |||
| ALL | |||
| Low | ≥2 | 1st CR MRD− | Any |
| 1st CR MRD+ | |||
| Intermediate | ≥2 | ≥2nd CR MRD− | Any |
| ≥2nd CR MRD+ | |||
| <2 | 1st CR MRD− | Any | |
| 1st CR MRD+ | |||
| High | ≥2 | Not in remission | Any |
| <2 | ≥2nd CR MRD− | Any | |
| ≥2nd CR MRD+ | |||
| Not in remission |
We applied the risk score to the validation subset to examine whether the prognostic groupings for leukemia-free survival could be applied for overall survival after transplantation for AML and ALL. Our analysis confirmed that the risk groups could be applied for prognostication for overall survival. For AML, compared with patients with low risk, overall survival was lower for those with intermediate risk (HR, 2.71; 95% CI, 1.10-6.65; P = .0298), high risk (HR, 4.36; 95% CI, 1.76-10.84; P = .0015), and very high risk (HR, 7.65; 95% CI, 3.07-19.07; P < .0001). Similarly, for ALL, compared with patients with low risk, survival was lower for those with intermediate-risk (HR, 1.54; 95% CI, 1.13-2.11; P = .0068) and high risk (HR, 3.30; 95% CI, 1.92-5.68; P < .0001). The 5-year probabilities of leukemia-free and overall survival of AML and ALL are presented in Figure 1, by their respective risk groups. Further exploration of the observed differences in leukemia-free survival between risk groups confirmed that leukemia recurrence was the predominant cause of treatment failure (Table 6).
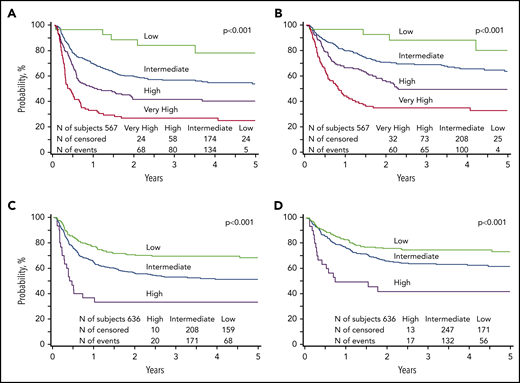
Leukemia-free and overall survival. (A) The 5-year probability of leukemia-free survival for AML in the validation subset stratified by low (78%; 95% CI, 59-93), intermediate (53%; 95% CI, 47-60), high (40%; 95% CI, 32-49), and very high (25%; CI, 16-34) risk groups. (B) The 5-year probability of overall survival for AML in the validation subset stratified by low (80%; 95% CI, 59-95), intermediate (64%; 95% CI, 57-70), high (50%; 95% CI, 41-59), and very high (33%; 95% CI, 24-44) risk groups. (C) The 5-year probability of leukemia-free survival for ALL in the validation subset stratified by low (68%; 95% CI, 62-75), intermediate (51%; 95% CI, 46-57), and high (33%; 95% CI, 18-51) risk groups. (D) The 5-year probability of overall survival for ALL in the validation subset stratified by low (73%; 95% CI, 67-79), intermediate (62%; 95% CI, 56-67), and high (42%; 95% CI, 25-60) risk groups.
Leukemia-free and overall survival. (A) The 5-year probability of leukemia-free survival for AML in the validation subset stratified by low (78%; 95% CI, 59-93), intermediate (53%; 95% CI, 47-60), high (40%; 95% CI, 32-49), and very high (25%; CI, 16-34) risk groups. (B) The 5-year probability of overall survival for AML in the validation subset stratified by low (80%; 95% CI, 59-95), intermediate (64%; 95% CI, 57-70), high (50%; 95% CI, 41-59), and very high (33%; 95% CI, 24-44) risk groups. (C) The 5-year probability of leukemia-free survival for ALL in the validation subset stratified by low (68%; 95% CI, 62-75), intermediate (51%; 95% CI, 46-57), and high (33%; 95% CI, 18-51) risk groups. (D) The 5-year probability of overall survival for ALL in the validation subset stratified by low (73%; 95% CI, 67-79), intermediate (62%; 95% CI, 56-67), and high (42%; 95% CI, 25-60) risk groups.
Five-year incidence of relapse and nonrelapse mortality
| Risk group | Relapse, % (range) | Nonrelapse mortality, % (range) |
|---|---|---|
| AML | ||
| Good | 14 (2-32) | 8 (1-23) |
| Intermediate | 31 (26-37) | 15 (11-20) |
| High | 48 (40-57) | 12 (7-18) |
| Very high | 58 (48-68) | 18 (10-27) |
| ALL | ||
| Good | 16 (11-21) | 16 (11-22) |
| Intermediate | 34 (28-39) | 15 (12-19) |
| High | 47 (29-65) | 20 (8-36) |
Discussion
In a cohort of >2500 children and adolescents with ALL and AML, we developed and validated a prognostic scoring system that we will call the pediatric DRI. The index was validated for leukemia-free and overall survival for stratification of patients undergoing transplantation into distinct risk groups, considering patient and disease characteristics that are known before transplantation. Patients with AML were stratified into 4 groups based on age, cytogenetic risk, and disease status at transplantation. Patients with ALL were stratified into 3 groups based on age and disease status at transplantation, independent of cytogenetic risk. Key questions for any prognostic scoring system include its clinical impact and deliverability. In the current analyses, the observed differences in leukemia-free and overall survival between the risk groups, mostly driven by a difference in relapse, were statistically and clinically significant, lending support for the strength of the prognostic information. A unique feature of the current analyses was our ability to examine residual disease status separately in first and second remissions of AML and ALL. Importantly, the current analyses confirm that the adult DRI that is also used for prognostication for pediatric transplantation does not hold in the pediatric population for low- and intermediate-risk groups for either AML or ALL.
The very young at transplantation (<3 years for AML and <2 years for ALL), a relatively small proportion of our study population, fell into groups at the highest risk for poor leukemia-free and overall survival, implying that transplantation in remission, including achieving MRD negativity does not extend survival for these patients. This group includes cases of infant ALL known to have poor outcomes and may be better served with the newer leukemia-specific treatment.14-16 Cytogenetic abnormalities not accounted for in our analysis, such as NUP98, and CBFA2T3 fusions are more common in the very young with AML and carry an adverse prognosis.4,17-21 Thus, they too may benefit from targeted treatments, with or without transplantation.22,23 Data from the Therapeutically Applicable Research to Generate Effective Treatments (TARGET) study confirm that pediatric AML is molecularly diverse and lend support for the development of personalized treatments.24
Disease status and cytogenetic risk were strongly predictive of leukemia-free and overall survival for AML. Residual disease status at the end of the first induction is an independent predictor of outcome,25,26 but its pretransplantation impact is less established.27-30 In our analysis, patients with AML who underwent transplantation in the first or second remission and were MRD− were assigned the same weighted score. A higher score was assigned when MRD was detected in the second remission but not in the first, emphasizing the importance of MRD status beyond the first remission. The adverse effect of residual disease positivity has been reported in adult AML.31 As the landscape of cytogenetic and molecular risk assessment for pediatric AML evolves, the prognostic scoring developed through the current analysis will have to be reevaluated and refined.24
Pretransplantation residual disease status was also strongly predictive of leukemia-free and overall survival of patients with ALL in the second or third remission. Patients in the first remission with and without residual disease were assigned the same weighted point. Patients in the second or third remission were assigned a higher score when residual disease was positive compared with when it was negative (HR, 1.43; 95% CI, 1.02-2.00; P = .0368), lending strong support for the adverse effect of residual disease positivity beyond the first remission. Our findings are consistent with a recent report from the Italian Association of Pediatric Haematology and Oncology (AIEOP) in which the effect of low levels of residual disease had a very strong negative impact only in patients who underwent transplantation in the second or subsequent remissions.32 Most reports of pretransplantation residual disease status in ALL have been limited to patients in the second or subsequent remissions.33,34 A recent international multicenter observational study confirmed that residual posttransplantation disease positivity had a significant adverse effect on relapse and that this factor is more relevant prognostically than pretransplantation residual disease, especially if the pretransplantation MRD level was low.35 In that report, detection of residual disease by quantitative polymerase chain reaction was also more sensitive than detection by flow cytometry.
We recognized the limitations of our analyses, but felt compelled to develop and validate a pediatric DRI, given the adoption of the adult DRI for pediatric transplantation.7,36,37 Our data collection form did not ask for a method of detection of residual disease before 2013, but thereafter, flow cytometry was used. As all transplants in the current analysis occurred in the United States, we assumed that the method of detection was flow cytometry before 2013. We considered residual disease as “positive” or “negative,” which prevented any further assessment of leukemia burden, a limitation of our data collection. However, the risk assessment tool we developed is intended for pretransplantation risk stratification. Indeed, posttransplantation events, such as GVHD and remission status including residual status, are determinants of a successful outcome but are not known before transplantation. Consequently, events that occur after transplantation cannot be incorporated into a risk model that is intended for ascertainment of risk before transplantation. Despite the limitation, our findings are consistent with reports regarding pretransplantation disease status assessed in centralized laboratories.32-34 As more sensitive techniques for the detection of MRD (eg, next-generation sequencing) become widely available, an effect of MRD status in first remission will have to be reevaluated.38 Our population included transplantations over a 12-year period that were randomly divided into training and validation groups. The effect of the transplantation period was examined, but none was found (AML, P = .78; ALL, P = .32). An alternate approach to developing the prognostic model in an earlier period and validating in a later period was not entertained a priori, as this approach prohibits examining for a period effect. Finally, we do not see this DRI as a fixed tool and recommend refinement as new information becomes available.
Age at transplantation and disease status, including residual disease at transplantation and, for AML, cytogenetic risk were the strongest predictors of leukemia-free and overall survival, independent of donor type. Donor selection should follow published guidelines, and the most suitable donor should be chosen for transplantation.39,40 The transplantation conditioning regimen is modifiable and, outside of a clinical trial, is chosen by the treating physician or institution. A recent study of AML from the United States reported no difference in leukemia-free or overall survival among the commonly used regimens.41 Although others have shown an advantage with TBI-containing regimens for ALL,35 in the current analyses, 95% of transplantation conditioning regimens for ALL included TBI, and that frequency prevented us from examining for an effect of non-TBI containing regimens. Reduced-intensity conditioning regimens for AML and ALL were excluded a priori based on the relatively limited use of these regimens in pediatrics. In summary, we have demonstrated clinical reliability and deliverability of a relatively simple tool that can be used for prognostication before transplantation. This simple tool, which is independent of donor type, can stratify heterogenous populations of children and adolescents in HCT trials based on their risk (relapse or mortality). Examples include trials of GVHD prophylaxis and treatment and treatment trials for other transplantation-specific complications and provision of a uniform assignment protocol for leukemia-free and overall survival for donor selection trials. A composite of age and disease status, rather than consideration of these factors individually, will improve trial efficiency. The DRI may also be used for uniform assignment of patients to facilitate comparison across transplantation centers, as in the annual report of center-specific analyses that compares survival across centers in the United States. Finally, a risk score built on 2 biologic factors, age and disease status, is likely to be applicable to children and adolescents with AML and ALL worldwide.
The data set is available at https://www.cibmtr.org/ReferenceCenter/PubList/PubDsDownload/Pages/default.aspx.
The publication costs of this article were defrayed in part by page charge payment. Therefore, and solely to indicate this fact, this article is hereby marked “advertisement” in accordance with 18 USC section 1734.
Acknowledgments
The Center for International Blood and Marrow Transplant and Research (CIBMTR) is supported primarily by Public Health Service Grant/Cooperative Agreement 5U24-CA076518 from the National Institutes of Health, National Cancer Institute (NCI), National Heart, Lung and Blood Institute (NHLBI), and National Institute of Allergy and Infectious Diseases (NIAID), and contract HHSH250201200016C with the Health Resources and Services Administration/Department Health and Human Services (HRSA/DHHS).
The views expressed in this article do not reflect the official policy or position of the National Institutes of Health, Health Resources and Services Administration, or any other agency of the US Government. N.N.S. is an employee of the US government and the work is in the public domain in the United States.
Authorship
Contribution: M.Q., K.W.A., C.L.K., and M.E. designed the study; M.H.J. and K.W.A. analyzed and interpreted the data; M.Q. drafted the manuscript; K.W.A., C.L.K., M.H.J., N.N.S., C.D., K.M., B.D.F., M.R.V., W.L., J.T., J.L., J.C., A.W., U.K., B.T., K.R.S., G.A.Y., and M.E. critically reviewed the manuscript; and all authors approved the final version of the manuscript.
Conflict-of-interest disclosure: The authors declare no competing financial interests.
Correspondence: Mary Eapen, Department of Medicine, Medical College of Wisconsin, 8701 Watertown Plank Rd, Milwaukee, WI 53226; e-mail: meapen@mcw.edu.
