

Key Points
Neighborhood poverty and public insurance are associated with inferior HCT outcomes in pediatric malignant disease.

Abstract
Social determinants of health, including poverty, contribute significantly to health outcomes in the United States; however, their impact on pediatric hematopoietic cell transplantation (HCT) outcomes is poorly understood. We aimed to identify the association between neighborhood poverty and HCT outcomes for pediatric allogeneic HCT recipients in the Center for International Blood and Marrow Transplant Research database. We assembled 2 pediatric cohorts undergoing first allogeneic HCT from 2006 to 2015 at age ≤18 years, including 2053 children with malignant disease and 1696 children with nonmalignant disease. Neighborhood poverty exposure was defined a priori per the US Census definition as living in a high-poverty ZIP code (≥20% of persons below 100% federal poverty level) and used as the primary predictor in all analyses. Our primary outcome was overall survival (OS), defined as the time from HCT until death resulting from any cause. Secondary outcomes included relapse and transplantation-related mortality (TRM) in malignant disease, acute and chronic graft-versus-host disease, and infection in the first 100 days post-HCT. Among children undergoing transplantation for nonmalignant disease, neighborhood poverty was not associated with any HCT outcome. Among children undergoing transplantation for malignant disease, neighborhood poverty conferred an increased risk of TRM but was not associated with inferior OS or any other transplantation outcome. Among children with malignant disease, a key secondary finding was that children with Medicaid insurance experienced inferior OS and increased TRM compared with those with private insurance. These data suggest opportunities for future investigation of the effects of household-level poverty exposure on HCT outcomes in pediatric malignant disease to inform care delivery interventions.
Introduction
Hematopoietic cell transplantation (HCT) remains a cornerstone of curative therapy for children with cancer and other life-threatening diseases. Use of pediatric HCT is increasing steadily in the modern era,1 as indications for HCT rise with the expansion of potential donor sources and reduced-intensity conditioning regimens and advent of novel cellular therapies, including gene therapy and chimeric antigen receptor T-cell therapy. Concurrently, steady advances in the identification of children at increased risk for transplantation-related mortality (TRM) and morbidity based on donor, disease and recipient biologic characteristics have led to improved outcomes.2 Despite these achievements, mortality after pediatric HCT remains significant, and efforts to identify novel risk factors for inferior outcomes are essential.3
Social determinants of health, including poverty, are widely recognized as major contributors to both adult and pediatric health outcomes in the United States.4-6 Although studies in both pediatric oncology7-10 and adult HCT11-13 indicate that socioeconomic status is an independent predictor of inferior survival outcomes, including both relapse and overall survival (OS), limited data exist on the relevance of socioeconomic status in pediatric HCT.
One in 5 US children lives in a household with an income below the federal poverty level (FPL),14,15 and children living in household poverty are more likely to experience medical comorbidities (eg, asthma and diabetes), higher rates of infectious disease, and hospitalization.8,16,17 Such pre-HCT health disparities may plausibly put children at higher risk of HCT-associated complications, including infection, graft-versus-host disease (GVHD), end-organ dysfunction, and death. However, household-level poverty measures are not routinely collected as part of pediatric HCT research.
Population-based studies in childhood cancer suggest that neighborhood-level poverty significantly mediates7 previously described racial and ethnic survival disparities.8,10,18,19 In adult populations, the resource-intense, highly centralized infrastructure of HCT has translated to documented socioeconomic disparities in access to HCT.20-23 Furthermore, among adults who successfully receive HCT, survival disparities based on neighborhood-level poverty exposure have been identified.13 Whether these neighborhood poverty–associated outcome disparities extrapolate to pediatric HCT recipients has not been investigated.
Understanding whether poverty affects survival outcomes for children who have successfully accessed HCT as a curative therapy is essential as indications for HCT steadily expand. We aimed to identify the association between neighborhood poverty and survival outcomes for pediatric allogeneic HCT recipients, including OS and TRM. We additionally aimed to explore the association between neighborhood poverty and GVHD and infection.
Patients and methods
Data source
The Center for International Blood and Marrow Transplant Research (CIBMTR) is a voluntary working group of >450 HCT centers worldwide that contribute detailed data on consecutive allogeneic and autologous HCT procedures to a statistical center at the Medical College of Wisconsin and the National Marrow Donor Program’s coordinating center. Centers that participate in the CIBMTR report all transplantations consecutively. Participants are followed longitudinally. Data quality is ensured by the completion of computerized checks for discrepancies, physicians’ review of submitted data, and onsite audits. Studies conducted by the CIBMTR are performed in compliance with all applicable federal regulations pertaining to the protection of human research participants. Protected health information used in the performance of CIBMTR research is collected and maintained per the CIBMTR’s capacity as a public health authority under the Health Insurance Portability and Accountability Act Privacy Rule.
Data collected by the CIBMTR include disease type, age, sex, pretransplantation disease stage and chemotherapy responsiveness, diagnosis date, graft type, conditioning regimen, post-HCT disease progression and survival, development of subsequent malignancy, and cause of death. More detailed disease and pre- and post-HCT clinical information is collected for a subset of CIBMTR patients sampled using a weighted randomization scheme. Data are collected at specific intervals, including pre-HCT, 100 days post-HCT, 6 months post-HCT, and annually for the first 6 years post-HCT and biennially thereafter or until death.
Cohort selection
We used the CIBMTR database to assemble 2 independent cohorts of pediatric HCT recipients who underwent first allogeneic HCT from 2006 to 2015 at age ≤18 years. Only patients undergoing transplantation at a US center and with available ZIP code and day-100 post-HCT data forms were eligible for this analysis. Patients were excluded if they had not provided consent (n = 204), received a transplant from an identical twin donor (n = 25), had an indeterminable HLA match (n = 10), underwent transplantation for a rare HCT condition (n = 25), or underwent transplantation at a center that failed data quality audits (n = 158).
The malignant disease cohort included 2053 children who received myeloablative conditioning for any malignancy. The nonmalignant disease cohort included 1696 children who received either myeloablative or reduced-intensity conditioning for any nonmalignant disease except autoimmune disorders.
Neighborhood poverty
Neighborhood-level poverty was the primary exposure of interest. Neighborhood poverty was defined a priori by linkage of a child’s residential ZIP code at the time of HCT to US Census data and used as the primary predictor in all analyses.24 ZIP codes were categorized as high-poverty neighborhoods (≥20% of persons living below 100% FPL) or low-poverty neighborhoods (<20% of persons below 100% FPL) in concert with US Census definitions and prior literature.24-27 Children living in high-poverty neighborhoods were a priori considered exposed to neighborhood poverty.
Outcomes
Our primary outcome of interest was OS, defined as the time from HCT until death resulting from any cause. TRM was defined as death in complete remission. Posttransplantation relapse of malignant disease was treated as a competing risk for TRM, and therefore, this outcome could only be evaluated in the malignant disease cohort.
Secondary outcomes included grade 2 to 4 acute GVHD (aGVHD) and chronic GVHD (cGVHD) according to the Glucksberg grading criteria,28 with death as a competing risk. Surviving patients were censored at the date of subsequent transplantation or last contact. In the subset of patients undergoing transplantation from 2008 to 2015, we additionally explored infection (bacterial, fungal, or viral) in the first 100 days post-HCT, with death as a competing risk. Subcohort analysis was necessary for this exploratory aim because infection data were not consistently available before 2008 as a result of changes in CIBMTR data collection strategies.
Covariates
Sociodemographic
Patient characteristics included age at HCT (<4, 4-9, or 10-18 years), sex (male or female), ethnicity (Hispanic or non-Hispanic), race (White, Black, or other), and performance score (Karnofsky/Lansky based on age) before transplantation (<80 or ≥80). Insurance status at the time of HCT was categorized as Medicaid (sole coverage by public insurance [Medicaid or Children’s Health Insurance Program]), private (commercial, dual coverage by commercial and public insurance, or military), and uninsured (domestic or foreign national uninsured). Uninsured patients were excluded from multivariable statistical models because of their very small numbers.
Disease and transplantation
For the malignant disease cohort, disease types were categorized as acute myeloid leukemia/myelodysplastic syndrome, acute lymphoblastic leukemia and other acute leukemias, chronic myeloid leukemia, and lymphoma (Hodgkin and non-Hodgkin). Disease status was categorized based on prior CIBMTR publications13 (early, intermediate, or advanced). For the nonmalignant disease cohort, disease types were categorized as severe aplastic anemia, inherited abnormalities of erythrocyte differentiation of function, severe combined immunodeficiencies and other immune system disorders, inherited disorders of metabolism and osteopetrosis, and histiocytic disorders.
Transplantation-related variables included year of transplantation categorized by timeframe (2006-2008, 2009-2011, or 2012-2015), donor age, donor/recipient sex match (male/male, male/female, female/male, female/female, cord blood recipient male, or cord blood recipient female), recipient cytomegalovirus status (negative or positive), conditioning intensity (myeloablative conditioning: total-body irradiation or chemotherapy; additionally for the nonmalignant disease cohort only: reduced-intensity conditioning or no conditioning). HLA matching status was categorized using National Marrow Donor Program classifications that allow adjustment for donor/recipient HLA compatibility while concurrently accounting for best available typing resolution combined with stem cell source (HLA-identical sibling bone marrow [BM], HLA-identical sibling peripheral blood [PB], cord blood, other related BM, other related PB, well-matched unrelated BM, well-matched unrelated PB, partially matched unrelated BM, partially matched unrelated PB, or mismatched unrelated BM or PB).29 GVHD prophylaxis was categorized as ex vivo T-cell depletion with CD34 selection, cyclophosphamide with other, tacrolimus based, cyclosporin based, and other.
Statistical analysis
Patient sociodemographic and disease and transplantation characteristics were summarized for the overall cohort and by neighborhood poverty using descriptive statistics. Differences in characteristics between the low– and high–neighborhood poverty groups were evaluated with χ2 and Wilcoxon rank-sum tests for categorical and continuous variables, respectively.
Associations between neighborhood poverty exposure and transplantation outcomes were evaluated using marginal Cox proportional hazards models allowing inclusion of other covariates. The marginal model was chosen to make adjustments for a center effect, which was significant. Proportionality assumption was tested for all potential predictors. In cases where the proportionality assumption was violated, a time-dependent covariate was considered. After backward model selection, only covariates at a .05 level of significance were retained in the final models. For each outcome, the main effect of neighborhood poverty exposure was tested for an interaction with each of the other covariates entered into the models, none of which were found to be significant.
After the final regression models were developed, adjusted probabilities for OS and cumulative incidence of TRM (malignant disease cohort only), relapse (malignant disease cohort only), aGVHD, cGVHD, and infections were determined by estimating the appropriate event probability over time for each patient and later averaging the obtained curves of all patients belonging to the group of interest.30
All analyses were performed using SAS software (version 9.4; SAS Institute, Inc., Cary, NC), and a value of P < .05 was considered statistically significant.
Results
Characteristics of study patients
The malignant disease cohort (Table 1) included 2053 children who received myeloablative conditioning for any malignancy, with a median duration of follow-up of 74 months (range, 3-126 months). Two hundred ninety-nine children (15%) lived in high-poverty neighborhoods, and more than one-third (n = 711; 35%) were insured by Medicaid (Table 1). When compared with children living in low-poverty neighborhoods, those living in high-poverty neighborhoods were more likely to be Black (26% vs 9%), Hispanic (49% vs 24%), and insured by Medicaid (55% vs 31%). There were no significant differences in disease or transplantation characteristics between neighborhood poverty groups (Table 1).
Malignant disease cohort: patient, disease, and transplantation characteristics for children age 0-18 y who underwent first allogeneic HCT for malignant disease in the United States from 2006-2015 stratified by neighborhood poverty
| Characteristic | n (%) | P | ||
|---|---|---|---|---|
| Total | Low-poverty neighborhood* | High-poverty neighborhood* | ||
| No. of patients | 2053 (100) | 1754 (85) | 299 (15) | |
| No. of centers | 90 | 89 | 62 | |
| Follow-up of survivors, mo | ||||
| Median | 74 | 73 | 76 | |
| Range | 3-126 | 3-126 | 6-125 | |
| Age at transplantation, y | .10 | |||
| <4 | 511 (25) | 430 (25) | 81 (27) | |
| 4-9 | 636 (31) | 533 (30) | 103 (34) | |
| 10-18 | 906 (44) | 791 (45) | 115 (38) | |
| Male sex | 1183 (58) | 1008 (57) | 175 (59) | .73 |
| Race | <.001 | |||
| White | 1578 (77) | 1398 (80) | 180 (60) | |
| Black | 227 (11) | 150 (9) | 77 (26) | |
| Other | 167 (8) | 149 (8) | 18 (6) | |
| Missing | 81 (4) | 57 (3) | 24 (8) | |
| Ethnicity | <.001 | |||
| Non-Hispanic | 1469 (72) | 1319 (75) | 150 (50) | |
| Hispanic | 565 (28) | 417 (24) | 148 (49) | |
| Missing | 19 (<1) | 18 (1) | 1 (<1) | |
| Insurance type | <.001 | |||
| Private | 1205 (58) | 1098 (63) | 107 (36) | |
| Medicaid | 711 (35) | 547 (31) | 164 (55) | |
| Uninsured | 16 (<1) | 11 (<1) | 5 (2) | |
| Missing | 121 (5) | 98 (6) | 23 (8) | |
| Performance score before HCT | .71 | |||
| ≥80 | 1924 (94) | 1642 (94) | 282 (94) | |
| <80 | 71 (3) | 63 (4) | 8 (3) | |
| Missing | 58 (3) | 49 (3) | 9 (3) | |
| Diagnosis† | .17 | |||
| AML + MDS | 1016 (49) | 883 (50) | 133 (44) | |
| ALL + other acute leukemia | 911 (44) | 763 (44) | 148 (49) | |
| CML | 64 (3) | 57 (3) | 7 (2) | |
| Lymphoma | 62 (3) | 51 (3) | 11 (4) | |
| Disease status at transplantation‡ | .71 | |||
| Early | 916 (45) | 788 (45) | 128 (43) | |
| Intermediate | 800 (39) | 685 (39) | 115 (39) | |
| Advanced | 277 (13) | 232 (13) | 45 (15) | |
| NA (malignant disease) | 57 (3) | 47 (3) | 10 (3) | |
| Missing (malignant disease) | 3 (<1) | 2 (<1) | 1 (< 1) | |
| Donor graft type | .07 | |||
| HLA-identical sibling BM | 216 (11) | 187 (11) | 29 (10) | |
| HLA-identical sibling PB | 37 (2) | 31 (2) | 6 (2) | |
| Cord blood | 1050 (51) | 893 (51) | 157 (53) | |
| Other related BM | 47 (2) | 42 (2) | 5 (2) | |
| Other related PB | 39 (2) | 26 (1) | 13 (4) | |
| Well-matched unrelated BM | 329 (16) | 288 (16) | 41 (14) | |
| Well-matched unrelated PB | 104 (5) | 93 (5) | 11 (4) | |
| Partially matched unrelated BM | 122 (6) | 100 (6) | 22 (7) | |
| Partially matched unrelated PB | 69 (3) | 59 (3) | 10 (3) | |
| Mismatched unrelated BM/PB | 40 (2) | 35 (2) | 5 (2) | |
| Donor age, y | .60‖ | |||
| Median | 32 | 31 | 34 | |
| Range | 16-61 | 16-61 | 19-58 | |
| Sex match (donor/recipient) | .66 | |||
| Male/male | 355 (17) | 306 (17) | 49 (16) | |
| Male/female | 231(11) | 200 (11) | 31 (10) | |
| Female/male | 234 (11) | 193 (11) | 41 (14) | |
| Female/female | 182 (9) | 161 (9) | 21 (7) | |
| Cord blood/male | 594 (29) | 509 (29) | 85 (28) | |
| Cord blood/female | 456 (22) | 384 (22) | 72 (24) | |
| Missing | 1 (< 1) | 1 (< 1) | 0 | |
| Recipient CMV | .10 | |||
| Negative | 910 (44) | 786 (45) | 124 (41) | |
| Positive | 1123 (55) | 954 (54) | 169 (57) | |
| Missing | 20 (1) | 14 (< 1) | 6 (2) | |
| Conditioning intensity (myeloablative) | .59 | |||
| TBI | 1278 (62) | 1096 (62) | 182 (61) | |
| Chemotherapy | 775 (38) | 658 (38) | 117 (39) | |
| GVHD prophylaxis | .44 | |||
| Ex vivo T-cell depletion + CD34 selection | 104 (5) | 83 (5) | 21 (7) | |
| Post-HCT cyclophosphamide + other(s) | 16 (<1) | 15 (<1) | 1 (<1) | |
| Tacrolimus based | 746 (36) | 631 (36) | 115 (38) | |
| Cyclosporin based | 1148 (56) | 991 (56) | 157 (53) | |
| Other | 15 (<1) | 13 (<1) | 2 (<1) | |
| Missing | 24 (1) | 21 (1) | 3 (1) | |
| Year of transplantation | .27 | |||
| 2006-2008 | 938 (46) | 801 (45) | 137 (46) | |
| 2009-2011 | 656 (32) | 570 (32) | 86 (29) | |
| 2012-2015 | 459 (22) | 383 (22) | 76 (25) | |
ALL, acute lymphoblastic leukemia; AML, acute myeloid leukemia; CML, chronic myeloid leukemia; CMV, cytomegalovirus; MDS, myelodysplastic syndrome; TBI, total-body irradiation.
Neighborhood poverty defined by linkage of a child’s residential ZIP code at the time of HCT to US Census3 and categorized as high-poverty neighborhood (≥20% of persons living below 100% FPL) or low-poverty neighborhood (<20% of persons below 100% FPL).1-4
Absolute n for disease subtype by neighborhood poverty group. Low poverty: AML (n = 686), MDS (n = 197), ALL (n = 724), CLL (n = 2), other acute leukemia (n = 37), Hodgkin lymphoma (n = 2), non-Hodgkin lymphoma (n = 49); high poverty: AML (n = 108), MDS (n = 25), ALL (n = 138), other acute leukemia (n = 10), non-Hodgkin lymphoma (n = 11).
Disease status defined as follows: early: AML/ALL (first complete remission), CML (first chronic phase), MDS (refractory anemia/refractory anemia with ringed sideroblasts/pre-HCT marrow blasts <5%); intermediate: AML/ALL (≥second complete remission), CML (accelerated phase or ≥second chronic phase); advanced: AML/ALL (active relapsed disease/primary induction failure), CML (blast phase), MDS (refractory anemia with excess blasts/chronic myelomonocytic leukemia or marrow blasts ≥5%).
Kruskal-Wallis test used for hypothesis testing; all others used Pearson χ2 test.
The nonmalignant disease cohort (Table 2) included 1696 children who underwent HCT for nonmalignant disease, with a median duration of follow-up of 72 months (range, 3-136 months). Two hundred twenty-eight children (13%) lived in high-poverty neighborhoods, and more than one-third (n = 597; 35%) were insured by Medicaid (58%; Table 2). Children living in high-poverty neighborhoods were more likely to be Black (36% vs 17%), Hispanic (35% vs 18%), and insured by Medicaid (58% vs 32%) when compared with those living in low-poverty neighborhoods.
Nonmalignant disease cohort: patient, disease, and transplantation characteristics for children age 0-18 y who underwent first allogeneic HCT for nonmalignant disease in the United States from 2006-2015 stratified by neighborhood poverty
| Characteristic | n (%) | P | ||
|---|---|---|---|---|
| Total | Low-poverty neighborhood* | High-poverty neighborhood* | ||
| No. of patients | 1696 (100) | 1468 (87) | 228 (13) | |
| No. of centers | 88 | 84 | 59 | |
| Follow-up of survivors, mo | 72 | 73 | 71 | |
| Median | ||||
| Range | 3-136 | 3-136 | 11-122 | |
| Age at transplantation, y | .93 | |||
| <4 | 828 (49) | 719 (49) | 109 (48) | |
| 4-9 | 475 (28) | 409 (28) | 66 (29) | |
| 10-18 | 393 (23) | 340 (23) | 53 (23) | |
| Male sex | 1049 (62) | 901 (61) | 148 (65) | .31 |
| Race | <.001 | |||
| White | 1118 (66) | 1003 (68) | 115 (50) | |
| Black | 332 (20) | 250 (17) | 82 (36) | |
| Other | 168 (10) | 150 (10) | 18 (8) | |
| Missing | 78 (4) | 65 (4) | 13 (6) | |
| Ethnicity | <.001 | |||
| Not Hispanic | 1324 (78) | 1179 (80) | 145 (64) | |
| Hispanic | 344 (20) | 264 (18) | 80 (35) | |
| Missing | 28 (<1) | 25 (2) | 3 (1) | |
| Insurance type | <.001 | |||
| Private | 1020 (60) | 936 (64) | 84 (37) | |
| Medicaid | 597 (35) | 465 (32) | 132 (58) | |
| Uninsured | 15 (< 1) | 14 (<1) | 1 (<1) | |
| Missing | 64 (4) | 53 (4) | 11 (5) | |
| Performance score before HCT | .89 | |||
| ≥80 | 1527 (90) | 1323 (90) | 204 (89) | |
| <80 | 107 (6) | 91 (6) | 16 (7) | |
| Missing | 62 (4) | 54 (4) | 8 (4) | |
| Disease | .005 | |||
| Severe aplastic anemia | 297 (18) | 257 (18) | 40 (18) | |
| Inherited abnormality of erythrocytes or platelets | 446 (26) | 383 (26) | 63 (28) | |
| SCID and other immune system disorders | 492 (29) | 422 (29) | 70 (31) | |
| Inherited disorders of metabolism or osteopetrosis | 270 (16) | 251 (17) | 19 (8) | |
| Histiocytic disorders | 191 (11) | 155 (11) | 36 (16) | |
| Donor graft type | .59 | |||
| Cord blood | 733 (43) | 634 (43) | 99 (43) | |
| HLA-identical sibling BM | 311 (18) | 264 (18) | 47 (21) | |
| HLA-identical sibling PB | 13 (<1) | 13 (<1) | 0 | |
| Other related BM | 72 (4) | 62 (4) | 10 (4) | |
| Other related PB | 51 (3) | 44 (3) | 7 (3) | |
| Well-matched unrelated BM | 310 (18) | 272 (19) | 38 (17) | |
| Well-matched unrelated PB | 51 (3) | 47 (3) | 4 (2) | |
| Partially matched unrelated BM | 101 (6) | 89 (6) | 12 (5) | |
| Partially matched unrelated PB | 29 (2) | 24 (2) | 5 (2) | |
| Mismatched unrelated BM/PB | 25 (1) | 19 (1) | 6 (3) | |
| Donor age (unrelated only), y | .51† | |||
| Median | 30 | 30 | 31 | |
| Range | 19-60 | 18-59 | 19-54 | |
| Sex match (donor/recipient) | .45 | |||
| Male/male | 341 (20) | 287 (20) | 54 (24) | |
| Male/female | 202 (12) | 182 (12) | 20 (9) | |
| Female/male | 258 (15) | 222 (15) | 36 (16) | |
| Female/female | 162 (10) | 143 (10) | 19 (8) | |
| Cord blood/male | 450 (27) | 392 (27) | 58 (25) | |
| Cord blood/female | 283 (17) | 242 (16) | 41 (18) | |
| Recipient CMV | .03 | |||
| Negative | 808 (48) | 711 (48) | 97 (43) | |
| Positive | 834 (49) | 716 (49) | 118 (52) | |
| Missing | 54 (3) | 41 (3) | 13 (6) | |
| Conditioning intensity (myeloablative) | .62 | |||
| TBI | 14 (<1) | 11 (<1) | 3 (1) | |
| Chemotherapy | 885 (52) | 770 (52) | 115 (50) | |
| Reduced-intensity conditioning/NST | 753 (44) | 651 (44) | 102 (45) | |
| No conditioning given | 44 (3) | 36 (2) | 8 (4) | |
| GVHD prophylaxis | .01 | |||
| Ex vivo T-cell depletion + CD34 selection | 128 (8) | 104 (7) | 24 (11) | |
| Postcyclophosphamide + other(s) | 14 (<1) | 13 (<1) | 1 (<1) | |
| Tacrolimus based | 511 (30) | 425 (29) | 86 (38) | |
| Cyclosporin based | 942 (56) | 833 (57) | 109 (48) | |
| Other | 40 (2) | 37 (3) | 3 (1) | |
| Missing | 61 (4) | 56 (4) | 5 (2) | |
| ATG/alemtuzumab | .71 | |||
| ATG + alemtuzumab | 7 (<1) | 7 (<1) | 0 | |
| ATG alone | 992 (58) | 861 (59) | 131 (57) | |
| Alemtuzumab alone | 487 (29) | 422 (29) | 65 (29) | |
| No ATG or alemtuzumab | 201 (12) | 171 (12) | 30 (13) | |
| Missing | 9 (<1) | 7 (<1) | 2 (<1) | |
| Year of transplantation | .79 | |||
| 2006-2008 | 660 (39) | 575 (39) | 85 (37) | |
| 2009-2011 | 516 (30) | 447 (31) | 69 (30) | |
| 2012-2015 | 520 (31) | 446 (30) | 74 (33) | |
ATG, antithymocyte globulin; CMV, cytomegalovirus; NST, nonmyeloablative stem cell transplantation; SCID, severe combined immunodeficiency; TBI, total-body irradiation.
Neighborhood poverty defined by linkage of a child’s residential ZIP code at the time of HCT to US Census3 and categorized as high-poverty neighborhood (≥20% of persons living below 100% FPL) or low-poverty neighborhood (<20% of persons below 100% FPL).
Kruskal-Wallis test used for hypothesis testing; all others used Pearson χ2 test.
Outcomes
Among children undergoing transplantation for malignant disease, the adjusted 5-year OS for the cohort was 52% (95% confidence interval [CI], 50% to 54%), with an overall adjusted 5-year cumulative incidence of TRM of 21% (95% CI, 19% to 23%) and an adjusted 5-year incidence of relapse of 33% (95% CI, 31% to 35%). Causes of death for the overall cohort with malignant disease included primary disease (23%), organ failure (8%), infection (5%), GVHD (3%), acute respiratory distress syndrome (2%), interstitial pneumonitis (1%), secondary malignancy (1%), and other (4%; including hemorrhage, accident/suicide, vascular, other causes, and unknown). Among patients with malignant disease, adjusted day-100 cumulative probabilities of infection and grade 2 to 4 aGVHD were 82% (95% CI, 80% to 84%) and 38% (95% CI, 36% to 40%), respectively; the 5-year cumulative incidence probability of cGVHD was 32% (95% CI, 29% to 34%).
Primary exposure: association between neighborhood poverty and outcomes
The adjusted 5-year OS was 53% (95% CI, 47% to 58%) for those living in high-poverty neighborhoods and 52% (95% CI, 50% to 54%) for those living in low-poverty neighborhoods. Children living in high-poverty neighborhoods experienced a 5-year TRM rate of 25% (95% CI, 20% to 30%), compared with 20% (95% CI, 18% to 22%) for those living in low-poverty neighborhoods. Children living in high-poverty neighborhoods more frequently experienced organ failure as a cause of death (12%), compared with children in low-poverty neighborhoods (8%), with no other differences in cause of death by neighborhood poverty.
In multivariable analysis, there was no association between neighborhood poverty exposure and OS (hazard ratio [HR], 1.04; 95% CI, 0.88-1.23; P = .620; Table 3; Figure 1). However, children living in high-poverty neighborhoods were significantly more likely to experience TRM (HR, 1.34; 95% CI, 1.02-1.76; P = .037) compared with those living in low-poverty neighborhoods (Table 3; Figure 1). There was no difference in relapse between neighborhood poverty groups (HR, 0.97; 95% CI, 0.74-1.26; P = .808). Complete multivariable results for the primary outcomes of OS, TRM, and relapse are shown in supplemental Table 1 (available on the Blood Web site).
Multivariable analysis of neighborhood poverty exposure and transplantation outcomes
| Outcome | HR (95%CI)* | P |
|---|---|---|
| Malignant disease cohort | ||
| All-cause mortality (n = 2037) | 1.04 (0.88-1.23) | .620 |
| TRM (n = 1981) | 1.34 (1.02-1.76) | .037 |
| Relapse (n = 1996) | 0.97 (0.74-1.26) | .808 |
| Acute GVHD grade 2-4 (n = 2042) | 1.01 (0.82-1.25) | .905 |
| Chronic GVHD (n = 2030) | 1.01 (0.77-1.32) | .966 |
| Infection through day 100 (n = 1401) | 1.09 (0.94-1.28) | .250 |
| Nonmalignant disease cohort | ||
| All-cause mortality (n = 1696) | 1.20 (0.95-1.52) | .126 |
| Acute GVHD grade 2-4 (n = 1692) | 0.86 (0.62-1.18) | .348 |
| Chronic GVHD (n = 1660) | 1.24 (0.96-1.6) | .102 |
| Infection through day 100 (n = 1274) | 0.89 (0.74-1.08) | .230 |
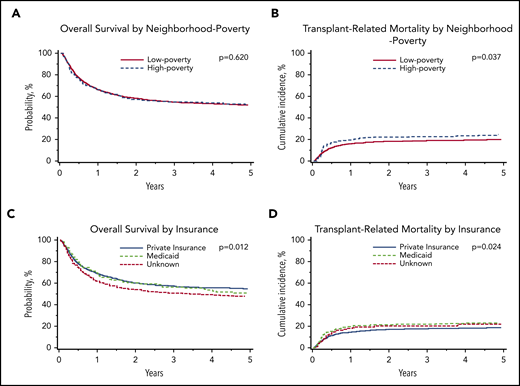
Malignant disease cohort: adjusted probabilities of OS and TRM among children age 0 to 18 years who underwent first allogeneic HCT for malignant disease in the United States from 2006 to 2015. (A-B) Adjusted 5-year probability estimates (95% CIs) for OS (A) and TRM (B) stratified by neighborhood poverty group. (A) OS: low-poverty neighborhood, 52% (95% CI, 49% to 54%) vs high-poverty neighborhood, 53% (95% CI, 47% to 58%; P = .620) (B) TRM: 5-year cumulative incidence probability estimates: low-poverty neighborhood, 20% (95% CI, 18% to 22%) vs high-poverty neighborhood, 25% (95% CI, 20% to 30%; P = .037). (C-D) Adjusted 5-year probability estimates (95% CIs) for OS (C) and TRM (D) stratified by insurance. (C) OS: private insurance, 55% (95% CI, 52% to 58%) vs Medicaid insurance, 48% (95% CI, 44% to 52%) vs unknown, 51% (95% CI, 43% to 60%; P = .012) (D) TRM: private insurance, 19% (95% CI, 17% to 21%) vs Medicaid insurance, 24% (95% CI, 20% to 27%) vs unknown, 22% (95% CI 15% to 29%; P = .024).
Malignant disease cohort: adjusted probabilities of OS and TRM among children age 0 to 18 years who underwent first allogeneic HCT for malignant disease in the United States from 2006 to 2015. (A-B) Adjusted 5-year probability estimates (95% CIs) for OS (A) and TRM (B) stratified by neighborhood poverty group. (A) OS: low-poverty neighborhood, 52% (95% CI, 49% to 54%) vs high-poverty neighborhood, 53% (95% CI, 47% to 58%; P = .620) (B) TRM: 5-year cumulative incidence probability estimates: low-poverty neighborhood, 20% (95% CI, 18% to 22%) vs high-poverty neighborhood, 25% (95% CI, 20% to 30%; P = .037). (C-D) Adjusted 5-year probability estimates (95% CIs) for OS (C) and TRM (D) stratified by insurance. (C) OS: private insurance, 55% (95% CI, 52% to 58%) vs Medicaid insurance, 48% (95% CI, 44% to 52%) vs unknown, 51% (95% CI, 43% to 60%; P = .012) (D) TRM: private insurance, 19% (95% CI, 17% to 21%) vs Medicaid insurance, 24% (95% CI, 20% to 27%) vs unknown, 22% (95% CI 15% to 29%; P = .024).
In multivariable analyses of secondary outcomes, there were no differences in grade 2 to 4 aGVHD (HR, 1.01; 95% CI, 0.82-1.25; P = .905), cGVHD (HR, 1.01; 95% CI, 0.77-1.32; P = .966), or infection through day 100 (HR, 1.09; 95% CI, 0.94-1.28; P = .250) by neighborhood poverty exposure (Table 3).
Among children receiving transplants for nonmalignant disease, the adjusted 5-year OS for the cohort was 75% (95% CI, 73% to 77%). Adjusted day-100 cumulative probabilities of infections and grade 2 to 4 aGVHD were 76% (95% CI, 74% to 78%) and 25% (95% CI, 23% to 27%), respectively; the 5-year cumulative incidence probability of cGVHD was 25% (95% CI, 23% to 27%). Causes of death for the overall cohort with nonmalignant disease included organ failure (7%), infection (5%), primary disease (3%), interstitial pneumonitis (1%), acute respiratory distress syndrome (1%), graft failure (<1%), GVHD (<1%), secondary malignancy (<1%), hemorrhage (1%), and other (3%; including accident/suicide, vascular, other, and unknown).
In multivariable analyses, there were no significant differences in OS, aGVHD, cGVHD, or infection through day 100 between children living in high-poverty neighborhoods and those living in low-poverty neighborhoods (Table 3). Complete multivariable results for the primary outcome of OS are shown in supplemental Table 2.
Associations between other sociodemographic characteristics (insurance, race, and ethnicity) and outcomes
Malignant disease cohort
In multivariable analyses, OS was significantly inferior in children insured by Medicaid (HR, 1.23; 95% CI, 1.07-1.41; P = .004) compared with those with private insurance. Children insured by Medicaid experienced an adjusted 5-year OS of 48% (95% CI, 44% to 52%), compared with 55% (95% CI, 52% to 58%) for those with private insurance. Similarly, children insured by Medicaid (HR, 1.28; 95% CI, 1.07-1.53; P = .006) were significantly more likely to experience TRM than those with private insurance (Table 4; Figure 1). Children insured by Medicaid experienced a 5-year cumulative incidence of TRM of 24% (95% CI, 20% to 27%), compared with 19% (95% CI, 17% to 21%) for those with private insurance.
Malignant disease cohort: multivariable analysis of insurance and transplantation outcomes
| Insurance | OS (n = 2037) | TRM (n = 1981) | ||
|---|---|---|---|---|
| HR (95% CI) | P | HR (95% CI) | P* | |
| Private | Reference | .012* | Reference | .024 |
| Medicaid | 1.23 (1.07-1.41) | .004 | 1.28 (1.07-1.53) | .006 |
| Unknown | 1.08 (0.77-1.51) | .668 | 1.04 (0.74-1.47) | .815 |
| Insurance | OS (n = 2037) | TRM (n = 1981) | ||
|---|---|---|---|---|
| HR (95% CI) | P | HR (95% CI) | P* | |
| Private | Reference | .012* | Reference | .024 |
| Medicaid | 1.23 (1.07-1.41) | .004 | 1.28 (1.07-1.53) | .006 |
| Unknown | 1.08 (0.77-1.51) | .668 | 1.04 (0.74-1.47) | .815 |
Overall P value: P value listed with reference group represents test comparing all groups for that covariate.
There were no differences in multivariable analyses of relapse, aGVHD, cGVHD, or infection through day 100 by insurance (Table 4).
In multivariable analyses, OS was inferior in children of Black race (HR, 1.47; 95% CI, 1.20-1.81; P < .001) compared with those of White race (supplemental Table 1). Children of Black race were more likely to experience TRM than those of White race (HR, 1.65; 95% CI, 1.26-2.17; P < .001; supplemental Table 1). There were no differences in relapse, aGVHD, cGVHD, or infection through day 100 by race. Ethnicity was not associated with any HCT outcome among children with malignant disease.
Nonmalignant disease cohort
In multivariable analyses, there were no significant differences in OS, aGVHD, cGVHD, or infection through day 100 by a child’s insurance status. Similarly, neither race nor ethnicity was associated with any HCT outcome among children with nonmalignant disease.
Discussion
Neighborhood poverty exposure is significantly associated with increased TRM, but not inferior OS, after HCT for malignant disease in childhood. Although our data recapitulate the higher rates of neighborhood poverty–associated TRM previously identified by Baker et al13 in adults undergoing HCT, we did not identify a similar difference in OS.11-13 Notably, neighborhood poverty exposure was not associated with relapse, aGVHD, cGVHD, or infection through day 100 in children receiving transplants for malignant disease. We similarly observed no association between neighborhood poverty exposure and OS, aGVHD, cGVHD, or infection through day 100 for children with nonmalignant disease.
Among children undergoing transplantation for malignant disease (but not nonmalignant disease), a key secondary finding of our analyses was a significant association between a child’s insurance status and inferior survival outcome. After adjustment in multivariable analyses, children with Medicaid insurance experienced a 23% increased risk of death compared with those with private insurance. This difference in survival seemed to be driven by a 28% increased risk of TRM that was not explained by disease- or transplantation-related characteristics. It is notable that although insurance is frequently used as a measure of access to care, the category of Medicaid insurance can additionally serve as a proxy for household-level poverty, because a majority of children qualify for US public insurance based on low household income.31 As such, this secondary finding suggests that household-level poverty may be an independent risk factor for adverse HCT outcomes in children with malignant disease. However, household-level measures of socioeconomic status are not routinely contributed to the CIBMTR for research purposes for pediatric HCT recipients and were not available in this data set, which provides a clear opportunity for future research data collection.
Although our investigation was focused on socioeconomic status and HCT outcomes, it is necessary to note that we observed an independent association between Black race and inferior OS and TRM among children undergoing transplantation for malignant disease. Specifically, children of Black race experienced a 47% increased risk of death and a 65% increased risk of TRM compared with those of White race. Race was not associated with relapse, aGVHD, cGVHD, or infection through day 100 in this cohort. These data are consistent with prior CIBMTR analyses by Baker et al13 focusing on adult patients and necessitate dedicated further investigation in pediatric HCT for malignant disease.
Our results are notable for 2 reasons. First, we observed both insurance- and neighborhood poverty–associated disparities in TRM among children with malignant disease, which may guide future investigations exploring pediatric HCT outcome disparities. Second, although not the primary exposure of interest, insurance was in fact far more relevant to HCT outcomes in children with malignant disease than was neighborhood poverty. The mechanisms underlying neighborhood poverty–associated disparities in TRM and insurance-associated disparities in TRM and OS are presumably complex and multifactorial. All children in this cohort underwent HCT, indicating they had successfully accessed the highly specialized care facilities necessary to perform transplantations. Whether post-HCT access to care was perhaps inferior for those children living in high-poverty neighborhoods or with Medicaid insurance cannot be examined based on these data. It is worth noting that the observed disparities in children with malignant disease were seen in the context of a cohort that presumably retained access to specialized care after transfer back to their pediatric oncology center, given that a majority of children with cancer in the United States are treated at a Children’s Oncology Group center.32,33
Mechanisms beyond access to care are plausible, given that both neighborhood poverty– and household poverty–associated health outcome disparities are well documented in US children, beginning in infancy.6,16,34-36 US children living in poverty experience higher rates of food insecurity, comorbid illness, injury, infectious disease, and hospitalization.36-39 It is plausible that inferior underlying health status before a diagnosis of cancer makes children more vulnerable to end-organ dysfunction from pre-HCT therapy and therefore TRM. Notably, Medicaid insurance remained associated with higher mortality after adjustment for performance score, suggesting the need for future studies to consider more nuanced pre-HCT organ function (eg, pulmonary function testing, glomerular filtration rate, and cardiac function) and comorbidity data (eg, asthma, diabetes, and obesity) concurrently with more refined measures of household-level socioeconomic status. Although HCT itself is an inpatient procedure, a proportion of post-HCT management occurs on an outpatient basis, with parents assuming responsibility for medication administration and adherence to infectious precautions in the home. Nonadherence is recognized as a significant risk factor for morbidity and mortality in other chronic diseases,40,41 although we notably did not observe insurance-associated differences in aGVHD, cGVHD, or infection. Finally, we observed insurance-associated disparities in OS among children with malignant disease but did not observe insurance-associated disparities in OS among children with nonmalignant disease. Given that insurance is a rough proxy for household-level poverty, it is possible that this represents unintended selection bias in children with nonmalignant disease. For example, it is plausible that a child with high-risk or relapsed leukemia may undergo HCT as an expected standard of care regardless of social barriers (eg, non-English language, unreliable transportation, and challenges with medication adherence) because of a lack of other available disease-directed therapeutic options, whereas similar challenges in a child with a disease for which HCT is an option (eg, sickle cell disease and a matched sibling donor) but not the sole available therapeutic approach may preclude HCT, resulting in a cohort of Medicaid-insured children with nonmalignant disease who have greater household resources. Future prospective investigation of these hypotheses will be important to determine the need, or lack thereof, for care delivery interventions in nonmalignant disease.
There are important limitations to our data. First, our analytic cohort reflects children with malignant and nonmalignant disease who successfully accessed HCT, and therefore, we were unable to consider the impact of neighborhood poverty (or insurance) on OS for children who never successfully underwent transplantation. Adult HCT data suggest significant disparities in referral for HCT,23 a relationship we were unable to explore in this cohort. Our finding of insurance-associated survival disparities suggests a possible relationship between household-level poverty exposure and outcome; however, the lack of household-level socioeconomic status measures in CIBMTR data left us unable to further explore this potential association. Parent-reported household poverty measures (eg, household income or household material hardship, including food, housing, utility, or transportation insecurities17 ) are not routinely collected as part of pediatric HCT research data, nor are they reported to the CIBMTR. Furthermore, we lacked data on other social determinants of health, including language, literacy, education, and social supports, or experiences of discrimination that may mediate the observed disparities.42 Among patients with nonmalignant diseases, neither neighborhood poverty nor insurance was associated with OS. To estimate TRM, relapse was treated as a competing risk. In the nonmalignant disease setting, the concept of relapse posttransplantation was not systematically evaluable, and therefore, TRM could not be estimated for these patients. We used ZIP code–linked US Census data from time of transplantation to identify neighborhood poverty exposure, a measure limited both by the socioeconomic heterogeneity inherent in each ZIP code’s large population43 and by the fact that families may have relocated for transplantation. Finally, our data are specific to the US health care system and may not be generalizable to patients in other countries. These limitations notwithstanding, our data identify the presence of clinically significant outcome disparities associated with insurance in the context of highly specialized pediatric HCT for malignant disease, suggesting a critical need for further investigation.
Efforts to address insurance-associated outcome disparities in pediatric HCT will require a systematic consideration of nonbiologic outcome predictors in future pediatric HCT data collection and therapeutic trials. It is notable that modifiable measures of household-level poverty exist and may provide targets for clinical care delivery interventions. Future studies aiming to identify the mechanistic links between poverty and outcomes using more refined measures of household-level poverty (eg, income and household material hardship) and neighborhood-level poverty (eg, residential address geocoding) are needed. For example, household material hardship (HMH) is a concrete poverty measure that is associated with health outcomes in general pediatrics and can be modified with interventions from the clinical setting.37,44-47 HMH is defined as unmet basic needs, including food, heat, housing, or transportation,17 and is as widely prevalent as income poverty, with nearly 20% of US children living in a home without enough food.48 A single-center study identified 38% of children as living in homes with HMH at the time of allogeneic HCT, suggesting a potentially high prevalence in this patient population.49 Although children living in families with HMH experience higher rates of poor nutrition, injury, infectious disease, and hospitalization,37-39 linking families with targeted safety-net programs (eg, food stamps or food banks) ameliorates these health outcomes.44-46 Evaluation of interventions directly targeting HMH are currently being conducted.47,50-52
In summary, neighborhood poverty exposure is not associated with OS, relapse, aGVHD, cGVHD, or infection after HCT for malignant or nonmalignant disease in children. Among children receiving transplants for malignant disease, both neighborhood poverty exposure and Medicaid insurance confer an increased risk of TRM despite highly specialized care, and children with Medicaid are at increased risk of death. That a child’s insurance status is independently associated with mortality after HCT for malignant disease is striking in the modern era. Steady improvements in pediatric HCT outcomes over the last decade reflect a fierce commitment to the identification of novel risk factors and refinements in risk stratification and HCT management. Our data suggest a novel direction for future investigation in children undergoing HCT for malignant disease, considering social determinants of health alongside biology with attention to innovation in care delivery strategies.
Presented in abstract form in an oral session at the 60th Annual Meeting of the American Society of Hematology, San Diego, CA, 3 December 2018.
The CIBMTR supports accessibility of research in accord with the National Institutes of Health Data Sharing Policy and the National Cancer Institute Cancer Moonshot Public Access and Data Sharing Policy. The CIBMTR only releases deidentified data sets that comply with all relevant global regulations regarding privacy and confidentiality.
The online version of this article contains a data supplement.
The publication costs of this article were defrayed in part by page charge payment. Therefore, and solely to indicate this fact, this article is hereby marked “advertisement” in accordance with 18 USC section 1734.
Acknowledgments
K.B. is supported by a K07 award from the National Institutes of Health (NIH)/National Cancer Institute (NCI) grant 1K07CA211847.
The Center for International Blood and Marrow Transplant Research (CIBMTR) is supported primarily by NIH/NCI Public Health Service grant U24CA076518, NIH/National Heart, Lung and Blood Institute (NHLBI) grants U24HL138660, OT3HL147741, R21HL140314, and U01HL128568; NIH/Health Resources and Services Administration grants HHSH250201700006C, SC1MC31881-01-00, and HHSH250201700007C; and grants N00014-18-1-2850, N00014-18-1-2888, and N00014-20-1-2705 from the Office of Naval Research. Additional federal support is provided by NIH/NCI grants P01CA111412, R01CA152108, R01CA215134, R01CA218285, and R01CA231141; NIH/NHLBI grants R01HL126589, R01HL129472, R01HL130388, and R01HL131731; NIH/National Institute of Allergy and Infectious Diseases grants R01AI128775, U01AI069197, and U01AI126612; and by the Biomedical Advanced Research and Development Authority. Support is also provided by Be the Match Foundation, Boston Children’s Hospital, Dana-Farber, Japan Hematopoietic Cell Transplantation Data Center, St Baldrick’s Foundation, National Marrow Donor Program, Medical College of Wisconsin, and the following commercial entities: AbbVie; Actinium Pharmaceuticals, Inc; Adaptive Biotechnologies; Adienne SA; Allovir, Inc; Amgen, Inc; Anthem, Inc; Astellas Pharma US; AstraZeneca; Atara Biotherapeutics, Inc; bluebird bio, Inc; Bristol Myers Squibb Co; Celgene Corp; Chimerix, Inc; CSL Behring; CytoSen Therapeutics, Inc; Daiichi Sankyo Co, Ltd; Gamida-Cell, Ltd; Genzyme; GlaxoSmithKline; HistoGenetics, Inc; Incyte Corp; Janssen Biotech, Inc; Janssen Pharmaceuticals, Inc; Janssen/Johnson & Johnson; Jazz Pharmaceuticals, Inc; Kiadis Pharma; Kite Pharma; Kyowa Kirin; Legend Biotech; Magenta Therapeutics; Mallinckrodt, LLC; Medac GmbH; Merck & Company, Inc; Merck Sharp & Dohme Corp; Mesoblast; Millennium, the Takeda Oncology Co; Miltenyi Biotec, Inc; Novartis Oncology; Novartis Pharmaceuticals Corp; Omeros Corp; Oncoimmune, Inc; Orca Biosystems, Inc; Pfizer, Inc; Phamacyclics, LLC; Regeneron Pharmaceuticals, Inc; REGiMMUNE Corp; Sanofi Genzyme; Seattle Genetics; Sobi, Inc; Takeda Oncology; Takeda Pharma; Terumo BCT; Viracor Eurofins; and Xenikos BV.
The views expressed in this article do not reflect the official policy or position of the NIH, the Department of the Navy, the Department of Defense, the Health Resources and Services Administration, or any other agency of the US Government.
Authorship
Contribution: K.B. and C.N.D. conceived the research questions; K.B., C.N.D., R.B., N.H., and W.S. interpreted the data; R.B. and N.H. performed the data analyses and created the figures; K.B. drafted the manuscript; and all authors contributed to the study design and revised the manuscript.
Conflict-of-interest disclosure: W.A.W. reports research funding from Pfizer. N.S.M. reports personal fees from Anthem, Inc, Incyte, Inc, Nkarta, and Atara bio, outside the submitted work. S.G. reports personal fees from Seattle Genetics, Kite Pharma, and Kadmon, outside the submitted work. R.F.O. reports personal fees from AstraZeneca, outside the submitted work. The remaining authors declare no competing financial interests.
Correspondence: Kira Bona, Department of Pediatric Oncology and Division of Population Sciences, Dana-Farber Cancer Institute, 450 Brookline Ave, Boston, MA 02115; e-mail: kira.bona@childrens.harvard.edu.
