

Key Points
In adult BL, 19% had CNS involvement, and among all patients, 14% had primary refractory disease, TRM was 10%, and 3-year PFS was 64%.
We identified 4 clinical factors independently prognostic for patient outcome (ages ≥ 40 years; LDH > 3×; ECOG PS ≥ 2; and CNS involvement).

Abstract
We examined adults with untreated Burkitt lymphoma (BL) from 2009 to 2018 across 30 US cancer centers. Factors associated with progression-free survival (PFS) and overall survival (OS) were evaluated in univariate and multivariate Cox models. Among 641 BL patients, baseline features included the following: median age, 47 years; HIV+, 22%; Eastern Cooperative Oncology Group (ECOG) performance status (PS) 2 to 4, 23%; >1 extranodal site, 43%; advanced stage, 78%; and central nervous system (CNS) involvement, 19%. Treatment-related mortality was 10%, with most common causes being sepsis, gastrointestinal bleed/perforation, and respiratory failure. With 45-month median follow-up, 3-year PFS and OS rates were 64% and 70%, respectively, without differences by HIV status. Survival was better for patients who received rituximab vs not (3-year PFS, 67% vs 38%; OS, 72% vs 44%; P < .001) and without difference based on setting of administration (ie, inpatient vs outpatient). Outcomes were also improved at an academic vs community cancer center (3-year PFS, 67% vs 46%, P = .006; OS, 72% vs 53%, P = .01). In multivariate models, age ≥ 40 years (PFS, hazard ratio [HR] = 1.70, P = .001; OS, HR = 2.09, P < .001), ECOG PS 2 to 4 (PFS, HR = 1.60, P < .001; OS, HR = 1.74, P = .003), lactate dehydrogenase > 3× normal (PFS, HR = 1.83, P < .001; OS, HR = 1.63, P = .009), and CNS involvement (PFS, HR = 1.52, P = .017; OS, HR = 1.67, P = .014) predicted inferior survival. Furthermore, survival varied based on number of factors present (0, 1, 2 to 4 factors) yielding 3-year PFS rates of 91%, 73%, and 50%, respectively; and 3-year OS rates of 95%, 77%, and 56%, respectively. Collectively, outcomes for adult BL in this real-world analysis appeared more modest compared with results of clinical trials and smaller series. In addition, clinical prognostic factors at diagnosis identified patients with divergent survival rates.
Introduction
Burkitt lymphoma (BL) is an uncommon, highly aggressive, MYC-driven B-cell lymphoma. Historically, outcomes of BL were poor using low-intensity chemotherapy. A seminal study by Magrath et al1 using a dose-intensive, short-course regimen with early central nervous system (CNS) prophylaxis in 39 adults and 33 children with untreated BL strongly suggested improved survival. This regimen has been further examined and modified over time,2-5 including demonstration of efficacy and safety for with the addition of rituximab and for patients with HIV-associated BL.5,6
Other high-intensity therapeutic regimens have been studied for the treatment of adults with newly diagnosed BL.7-10 In addition, the lower-intensity regimen of dose-adjusted cyclophosphamide, etoposide, prednisone, vincristine, doxorubicin and rituximab (DA-EPOCH-R) reported excellent survival rates in 30 adult patients (11 HIV positive) with progression-free survival (PFS) and overall survival (OS) rates of 95% and 100%, respectively.11 Additionally, the impact of rituximab was evaluated in a randomized study of 260 BL patients, which showed improved event-free survival with inclusion of anti-CD20 antibody.12
However, few reports have had a large enough sample size to adequately compare therapeutic regimens and to examine the associated potential impact on patient outcomes in real-world cohorts, including the delineation of the occurrence of early treatment-related mortality (TRM). Furthermore, there is a relative deficiency of data that have clearly defined prognostic factors for survival of adults with BL treated with rituximab-containing immunochemotherapy in the modern era.
Herein, we report a large, multicenter collaboration that investigated a retrospective cohort of 641 adult patients with untreated BL who were managed during a recent 10-year period across 30 US cancer centers. We investigated detailed clinical and disease-related characteristics with description of treatment patterns and associated these factors with patient outcomes, including delineation of key clinical prognostic factors.
Methods
Patients
We conducted a multicenter retrospective study of adult patients (ie, ages ≥ 18 years) with newly diagnosed BL treated from 2009 to 2018 at 30 US cancer centers, including both academic hospitals and affiliated community-based oncology practices. The study was approved by the institutional review boards of all institutions. Seven hundred two cases were originally identified; 641 patients had complete pathologic and clinical data and were entered into a centralized, deidentified database. Sixty-one patients were excluded because of pathology not consistent with classic BL (n = 21); inadequate follow-up data (n = 15); out-of-range treatment dates (n = 13); and lack of clinical information (n = 12).
Diagnosis was established by local institutional hematopathology expert review; central pathologic review was not done. Cases included BL defined as according to the 2016 World Health Organization (WHO) criteria,13 excluding other newly identified entities (high-grade B-cell lymphoma not otherwise specified, double/triple-hit lymphoma, etc) based on careful review of pathology reports. Consistent with WHO guidance,14 we included cases (estimated ∼10%) that had negative or missing MYC rearrangement, but these cases must have fulfilled all other criteria for classic BL (ie, small-cell morphology with tingible body macrophages, BCL2 negativity, CD10 and BCL6-positive immunophenotype, and Ki67 staining of 100%). Staging evaluations and therapy for patients were completed at the discretion of treating physicians and by institutional standards.
Variables and end points
Investigators collected detailed demographic, clinicopathologic information, and outcome data using a standardized protocol. Performance status (PS) was assigned according to the Eastern Cooperative Oncology Group (ECOG) scale. Serum lactate dehydrogenase (LDH) was standardized relative to institutional upper limit of normal (ULN). Positron emission tomography/computed tomography (PET/CT) was used for restaging in all patients, and PFS was defined according to the 2007 International Working Group criteria as time from diagnosis until disease progression, recurrence, or death from any cause.15 OS was calculated from diagnosis until death or last follow-up. TRM was defined as death from any cause other than BL because of a treatment-related adverse event (causation was determined by the local investigator).
Statistical analysis
We compared clinicopathologic characteristics between patient groups using rank-sum or Fisher’s exact tests. Median follow-up was determined by reverse Kaplan-Meier analysis, and PFS and OS were examined in proportional hazard models, reporting hazard ratios (HRs). Cumulative incidence of TRM was examined using a competing-risk model accounting for disease-related deaths.16 To simplify the assessment of association between clinical factors and PFS/OS, we used graphical inspection of survival curves and maximal Harrell’s C concordance coefficients to select optimal cutoff values for age, LDH, hemoglobin, and albumin that provided maximal prognostic discrimination in BL (see supplemental Methods available on the Blood Web site). For descriptive purposes, the association between all factors with PFS and OS was examined in univariate models.
To determine factors that could be included in a BL-specific, parsimonious, and clinically useful prognostication, we then conducted a multivariate analysis using nonparametric bootstrap for variable selection and assessment of model fit (supplemental Methods).17 Bootstrap-based internal validation offers advantage over historical methods that rely on 1-time splitting of the data set into derivation and validation subsets, because they tend to produce unstable results that vary with any alternative split.18,19 In contrast, bootstrap validation relies on a large number of random training subsets, which, when averaged, provide unbiased assessment of model performance in external samples. The analysis proceeded in 2 steps. First, from 1000 randomly sampled bootstrap replicates, we automatically selected variables with the highest prognostic information value using 2 methods: the least absolute shrinkage and selection operator (lasso) and the traditional multivariate proportional hazard model with forward selection.20 Four variables consistently selected by both methods in at least 50% of random training replicates were then used to construct a summary index by assigning 1 point to each factor based on the observed HR. In the second stage, the summary index was grouped by Kaplan-Meier curve inspection to create 3 prognostic categories. We then internally validated the resulting 3-category index using 1000 randomly sampled bootstrap replicates by calculating predicted survival and measurements of accuracy (Royston-Sauerbrei explained variation R2D statistics, Harrell’s C concordance statistic, and Brier score as an aggregate measure of accuracy) with bias-corrected 95% confidence intervals (CIs) that reflect expected performance of the index in an external sample.18,21 All estimates report 95% CI, and 2-sided P < .05 was considered statistically significant. All analyses were conducted using Stata/MP 16.1 (College Station, TX).
Results
Patients and disease characteristics
Baseline disease and characteristics of 641 BL patients are presented in Table 1 together with associated univariate models for PFS and OS. Median age was 47 (range, 18-88) years, with 24% of patients aged ≥ 60 years, and 76% were male. Twenty-eight percent (n = 176) of patients had ECOG PS 0, but 72% (n = 465) presented with decreased functional status, including 8% (n = 50) with PS 3 to 4.
Baseline patient and disease characteristics with univariate analysis
| Variable | N | % | PFS | OS | ||||
|---|---|---|---|---|---|---|---|---|
| HR | 95% CI | P | HR | 95% CI | P | |||
| Age, yr | ||||||||
| <40 | 233 | 36 | Ref | |||||
| 40-59 | 257 | 40 | 1.70 | 1.25-2.32 | <.001 | 2.14 | 1.51-3.04 | <.001 |
| 60+ | 151 | 24 | 2.14 | 1.52-3.00 | <.001 | 2.61 | 1.78-3.82 | <.001 |
| Sex | ||||||||
| Male | 485 | 76 | Ref | |||||
| Female | 156 | 24 | 1.06 | 0.79-1.41 | 0.70 | 0.92 | 0.67-1.27 | 0.61 |
| HIV | ||||||||
| Negative | 487 | 76 | Ref | |||||
| Positive | 142 | 22 | 1.13 | 0.84-1.52 | 0.42 | 1.13 | 0.82-1.55 | 0.46 |
| NA | 12 | 2 | ||||||
| ECOG | ||||||||
| 0-1 | 453 | 71 | Ref | |||||
| 2-4 | 144 | 22 | 2.24 | 1.7-2.96 | <.001 | 2.58 | 1.92-3.47 | <.001 |
| NA | 44 | 7 | ||||||
| MYC rearrangement | ||||||||
| No | 65 | 10 | Ref | |||||
| Yes | 576 | 90 | 1.26 | 0.80-1.97 | 0.31 | 1.25 | 0.77-2.04 | 0.36 |
| Advanced stage | ||||||||
| No | 131 | 20 | Ref | |||||
| Yes | 500 | 78 | 2.29 | 1.54-3.39 | <.001 | 2.44 | 1.57-3.8 | <.001 |
| NA | 10 | 2 | ||||||
| B symptoms | ||||||||
| No | 330 | 51 | Ref | |||||
| Yes | 304 | 47 | 1.19 | 0.92-1.54 | 0.18 | 1.14 | 0.86-1.5 | 0.37 |
| NA | 7 | 1 | ||||||
| Greater than 1 EN site* | ||||||||
| No | 353 | 55 | Ref | |||||
| Yes | 275 | 43 | 1.24 | 0.96-1.6 | 0.09 | 1.29 | 0.98-1.7 | 0.07 |
| NA | 13 | 2 | ||||||
| Marrow involved | ||||||||
| No | 392 | 61 | Ref | |||||
| Yes | 222 | 35 | 1.68 | 1.29-2.17 | <.001 | 1.84 | 1.39-2.45 | <.001 |
| NA | 27 | 4 | ||||||
| CNS involved | ||||||||
| No | 521 | 81 | Ref, | |||||
| Yes | 120 | 19 | 2.02 | 1.52-2.67 | <.001 | 2.18 | 1.61-2.94 | <.001 |
| Hgb < 11.5 g/dL | ||||||||
| Normal | 345 | 54 | Ref | |||||
| Low | 264 | 51 | 1.73 | 1.33-2.25 | <.001 | 1.77 | 1.33-2.36 | <.001 |
| NA | 32 | 5 | ||||||
| Albumin < 3.5 g/dL | ||||||||
| Normal | 329 | 51 | Ref | |||||
| Low | 254 | 40 | 1.56 | 1.20-2.04 | .001 | 1.72 | 1.28-2.28 | <.001 |
| NA | 58 | 9 | ||||||
| LDH > 3× ULN | ||||||||
| No | 351 | 55 | Ref | |||||
| Yes | 247 | 39 | 2.27 | 1.73-2.96 | <.001 | 2.20 | 1.65-2.94 | <.001 |
| NA | 43 | 7 | ||||||
EN, extranodal; Hgb, hemoglobin; NA, not available; Ref, reference.
Most common non–bone marrow EN sites (>5% of patients): gastrointestinal 37% (n = 234); CNS 19% (n = 120); lung/pleura 16% (n = 105); bone 16% (n = 102); liver 14% (n = 88); kidney/adrenal 8% (n = 54); gonadal 7% (n = 38).
MYC rearrangement partner was immunoglobulin heavy chain in 63% (n = 406), κ or λ light chain in 5% (n = 31), and 22% (n = 139) had a MYC detected by the break-apart probe. Four percent (n = 28) were negative by fluorescent in situ hybridization, and 6% (n = 37) were not tested or missing. Importantly, among these 65 negative or missing MYC cases, all had otherwise classic BL according to 2016 WHO criteria (also see additional sensitivity analysis below).14 For laboratory data, the majority of patients had elevated LDH, with 39% (n = 247) having LDH > 3 times normal and 27% (n = 170) with LDH > 5 times normal. Forty-one percent (n = 264) had hemoglobin < 11.5 g/dL, and 40% (n = 254) of patients had an albumin < 3.5 g/dL (Table 1).
BL involved the bone marrow in 35% (n = 222) of patients, and 19% (n = 123) of patients had evidence of CNS involvement at baseline, including 16% with leptomeningeal (CSF or cranial nerve palsy) and 3% with parenchymal CNS involvement. A separate analysis examined further details of CNS involvement in this patient cohort.22 Additionally, 80% (n = 515) of BL patients had extranodal disease, with 43% (n = 275) having ≥2 extranodal sites; the most common sites other than marrow or CNS were gastrointestinal tract in 37% (n = 234) and bone in 16% (n = 102). Overall, more than three quarters of patients had advanced-stage disease, with 9% (n = 57) having stage 1.
Twenty-two percent (n = 142) of patients had coexisting HIV infection. HIV-associated BL more often presented with CNS involvement (30% vs 16%, P < .001); poorer ECOG PS 2 to 4 (32% vs 22%, P = .02); bone marrow involvement (45% vs 34%, P = .02); ≥2 extranodal sites (59% vs 40%, P < .001), and stage 4 disease (89% vs 69%, P < .001). A detailed analysis of HIV patients in this BL cohort was reported separately.23
Treatment
Overall, 88% (n = 564) of BL patients were treated in an academic center and 12% (n = 77) in a community oncology center. The most common treatment regimens were cyclophosphamide, vincristine, doxorubicin, high-dose methotrexate/ifosfamide, etoposide, and high-dose cytarabine (CODOX-M/IVAC) in 30% (n = 194); cyclophosphamide, vincristine, doxorubicin, and dexamethasone/high-dose methotrexate and cytarabine (hyperCVAD/MA) in 30% (n = 195); and DA-EPOCH in 28% (n = 181); disease and patient characteristics by these common chemotherapy regimens are detailed in supplemental Table 1. The median number of cycles administered was 6 (range, 2-6) for DA-EPOCH, with n = 110 (61%) patients receiving 6 cycles); 6 (range, 1-6) for hyperCVAD/MA, with n = 61 (31%) patients receiving 8 cycles; and 4 (range, 1-4) for CODOX-M/IVAC with n = 135 (70%) patients receiving 4 cycles. Furthermore, between 2009 and 2018, the proportion of patients receiving DA-EPOCH increased from 3% to 34% (supplemental Fig. 1A). We did not observe a significant difference between community or academic centers in the use of specific chemotherapy platforms (supplemental Fig. 1B), although more patients in academic centers received rituximab (93% vs 81%, P = .003). There was also evident preference for either CODOX-M/IVAC or hyperCVAD/MA in specific hospitals (supplemental Fig. 1C). Eight patients (1%) were never treated with chemotherapy. Ninety percent (n = 579) of all patients received rituximab as part of first-line therapy, with 29% (n = 83) of patients receiving all rituximab therapy as an outpatient. Overall, the median number of rituximab doses received per patient was 5 (range, 1-8) without difference by inpatient vs outpatient (data not shown).
The overall response rate (ORR) to initial therapy among all treated BL patients was 77%, with 71% (n = 455) achieving complete response (CR). Fourteen percent (n = 87) of patients had primary refractory disease, and 8% (n = 52) were not evaluable, mostly because of TRM. Subsequent treatments and outcomes in patients not achieving CR are described in supplemental Table 2. ORR and CR rates by regimen were 86% and 80% with CODOX-M/IVAC, respectively; 79% and 74% with hyperCVAD/MA, respectively; and 78% and 71% with DA-EPOCH-R, respectively (P = not significant). Overall, 7% (n = 44) of patients had consolidative radiotherapy and 2% (n = 12) underwent consolidative autologous stem cell transplantation (10 of 12 in CR after first-line therapy).
Severe toxicity
TRM across all patients occurred in 10% (n = 61), after a median of 2 (range, 1-8) cycles of chemotherapy. The most common causes of TRM were sepsis (51%, n = 31); gastrointestinal bleeding or perforation (15%, n = 9); and respiratory failure (15%, n = 8). TRM in patients with HIV was 13% (n = 18) and was 9% (n = 43) in those without HIV (P = .17). The cumulative incidence of TRM at 12 months was 9% (95% CI, 7% to 12%; supplemental Fig. 1D), and it was significantly associated with increasing age (from 2% in patients age < 40 to 16% in those age ≥ 60, P < .001), poor PS (20% vs 5%, P < .001), and indicators of disease burden (advanced stage, bone marrow or CNS involvement, or high LDH; see supplemental Table 3). Furthermore, TRM was higher among patients treated with hyperCVAD/MA (11%) vs CODOX-M/IVAC (5%), whereas TRM for DA-EPOCH-R (8%) did not significantly differ from CODOX-M/IVAC (supplemental Fig. 1E). TRM was 13% to 17% for patients age ≥ 60 years across varied treatment regimens, but it was also 15% for patients ages 40 to 59 years receiving hyperCVAD/MA, and the higher risk with hyperCVAD/MA compared with CODOX-M/IVAC persisted in the subset of patients ages < 60 years (subhazard ratio, 2.71; 95% CI, 1.12-6.57, P = .027). Among patients surviving >3 years, 25 cases (6%) of secondary cancers were identified, including 10 patients with secondary myelodysplastic syndrome or acute myeloid leukemia that occurred at a median of 45 months from BL diagnosis (range, 17-103 months) and 8 cases of non-BL lymphomas (eg, n = 5 Hodgkin lymphoma) occurring at a median of 63 months (range, 29-95 months); among patients who developed secondary myelodysplastic syndrome or acute myeloid leukemia, first-line BL therapy was hyperCVAD/MA in 6 cases, CODOX-M/IVAC in 3, and DA-EPOCH in 1.
Survival
With a median follow-up of 45 months, 3-year PFS among all patients was 64% (95% CI 60.3-68.0) and OS was 70% (95% CI, 65.6-73.1; Fig. 1A-B). For the 633 patients who received any chemotherapy, 3-year PFS was 65% (95% CI, 61-69) and OS was 70% (95% CI, 66-74). Overall, disease progression occurred within 12 months from diagnosis in 90% of cases (150 of 167), whereas only 4% (n = 7) relapsed after 2 years (range, 26-54 months). PFS and OS based on age and ECOG PS are depicted in Fig. 1C-F. Outcomes were superior for BL patients with stage I/II vs III/IV disease (Fig. 2A-B), and survival rates over a range of LDH levels revealed that >3× normal was the most prognostic cutoff (Fig. 2C-D). There were no survival differences based on MYC translocation partner, and outcomes appeared similar for patients with MYC translocation compared with negative/unconfirmed status (Fig. 2E-F). Survival according to specific initial chemotherapy regimen is depicted in Fig. 3A-B, and with the impact of rituximab, including inpatient vs outpatient administration, is depicted in Fig. 3C-D. In addition, survival did not differ by HIV status (supplemental Fig. 2); however, outcomes were better among patients treated at an academic center rather than a community center (Fig. 3E-F).
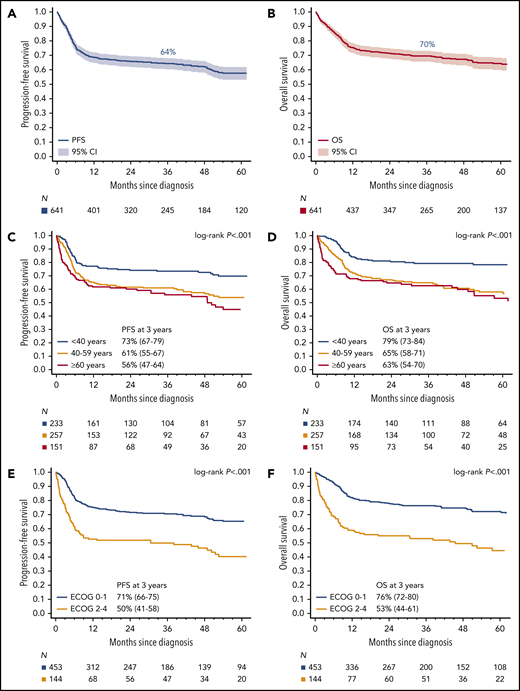
Survival. Kaplan-Meier curves of (A) PFS and (B) OS for all BL patients (n = 641). Kaplan-Meier curves of (C) PFS and (D) OS based on age. Three-year PFS rates for patients ages <40 vs 40 to 59 vs ≥60 years were 73% (95% CI, 67-79) vs 61% (95% CI, 55-67) vs 56% (95% CI, 47-64), respectively, P < .001; 3-year OS rates were 79% (95% CI, 73-84) vs 65% (95% CI, 58-71) vs 63% (95% CI, 54-70), respectively, P < .001. Kaplan-Meier curves of (E) PFS and (F) OS in BL patients based on ECOG performance status (PS). Three-year PFS rates for patients with ECOG PS 0 to 1 vs 2 to 4 were 71% (95% CI, 66-75) vs 50% (95% CI, 41-58) respectively, P < .001; 3-year OS rates were 76% (95% CI, 72-80) vs 53% (95% CI, 44-61), respectively, P < .001.
Survival. Kaplan-Meier curves of (A) PFS and (B) OS for all BL patients (n = 641). Kaplan-Meier curves of (C) PFS and (D) OS based on age. Three-year PFS rates for patients ages <40 vs 40 to 59 vs ≥60 years were 73% (95% CI, 67-79) vs 61% (95% CI, 55-67) vs 56% (95% CI, 47-64), respectively, P < .001; 3-year OS rates were 79% (95% CI, 73-84) vs 65% (95% CI, 58-71) vs 63% (95% CI, 54-70), respectively, P < .001. Kaplan-Meier curves of (E) PFS and (F) OS in BL patients based on ECOG performance status (PS). Three-year PFS rates for patients with ECOG PS 0 to 1 vs 2 to 4 were 71% (95% CI, 66-75) vs 50% (95% CI, 41-58) respectively, P < .001; 3-year OS rates were 76% (95% CI, 72-80) vs 53% (95% CI, 44-61), respectively, P < .001.
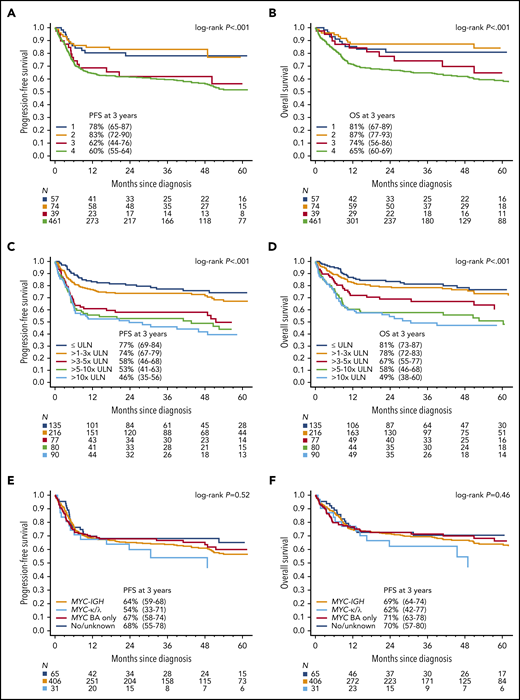
Survival based on stage, LDH, and MYC rearrangement. Kaplan-Meier curves of (A) PFS- and (B) OS-based on Ann Arbor stage. The 3-year PFS of patients with stage 1, 2, 3, or 4 BL were 78% (95% CI, 65-87), 83% (95% CI, 72-90), 62% (95% CI, 44-76), and 60% (95% CI, 55-64), respectively (P < .001); corresponding 3-year OS rates were 81% (95% CI, 67-89), 87% (95% CI, 77-93), 74% (95% CI, 56-96), and 65% (95% CI, 60-69), respectively (P < .001). Kaplan-Meier curves of (C) PFS- and (D) OS-based increasing LDH (normalized to the upper limit of normal in the institution). The 3-year PFS for patients with LDH levels that were normal, 1 to 3× normal, 3 to 5× normal, 5 to 10× normal, and >10× normal were 77% (95% CI, 69-84), 74% (95% CI, 67-79), 58% (95% CI, 46-68), 53% (95% CI, 41-63), and 46% (95% CI, 35-56), respectively (P < .001); 3-year OS rates were 81% (95% CI, 73-83), 78% (95% CI, 72-84), 67% (95% CI, 55-77), 58% (95% CI, 46-68), and 49% (95% CI, 38-60), respectively (P < .001). Kaplan-Meier curves of PFS (E) and (F) OS for patients according to reported MYC rearrangement status. The 3-year PFS rates for patients with MYC-IGH rearrangement, MYC-IGK/IGL rearrangement, MYC rearrangement by break-apart (BA) probe only, and negative or unknown rearrangement were 64% (95% CI, 59-68) 54% (95% CI, 33-71), 67% (95% CI, 58-74), and 68% (95% CI, 55-78), respectively (P = .52); corresponding 3-year OS rates were 69% (95% CI, 64-74), 62% (95% CI, 41-77), 71% (95% CI, 63-78), and 70% (95% CI, 57-80), respectively (P = .46).
Survival based on stage, LDH, and MYC rearrangement. Kaplan-Meier curves of (A) PFS- and (B) OS-based on Ann Arbor stage. The 3-year PFS of patients with stage 1, 2, 3, or 4 BL were 78% (95% CI, 65-87), 83% (95% CI, 72-90), 62% (95% CI, 44-76), and 60% (95% CI, 55-64), respectively (P < .001); corresponding 3-year OS rates were 81% (95% CI, 67-89), 87% (95% CI, 77-93), 74% (95% CI, 56-96), and 65% (95% CI, 60-69), respectively (P < .001). Kaplan-Meier curves of (C) PFS- and (D) OS-based increasing LDH (normalized to the upper limit of normal in the institution). The 3-year PFS for patients with LDH levels that were normal, 1 to 3× normal, 3 to 5× normal, 5 to 10× normal, and >10× normal were 77% (95% CI, 69-84), 74% (95% CI, 67-79), 58% (95% CI, 46-68), 53% (95% CI, 41-63), and 46% (95% CI, 35-56), respectively (P < .001); 3-year OS rates were 81% (95% CI, 73-83), 78% (95% CI, 72-84), 67% (95% CI, 55-77), 58% (95% CI, 46-68), and 49% (95% CI, 38-60), respectively (P < .001). Kaplan-Meier curves of PFS (E) and (F) OS for patients according to reported MYC rearrangement status. The 3-year PFS rates for patients with MYC-IGH rearrangement, MYC-IGK/IGL rearrangement, MYC rearrangement by break-apart (BA) probe only, and negative or unknown rearrangement were 64% (95% CI, 59-68) 54% (95% CI, 33-71), 67% (95% CI, 58-74), and 68% (95% CI, 55-78), respectively (P = .52); corresponding 3-year OS rates were 69% (95% CI, 64-74), 62% (95% CI, 41-77), 71% (95% CI, 63-78), and 70% (95% CI, 57-80), respectively (P = .46).
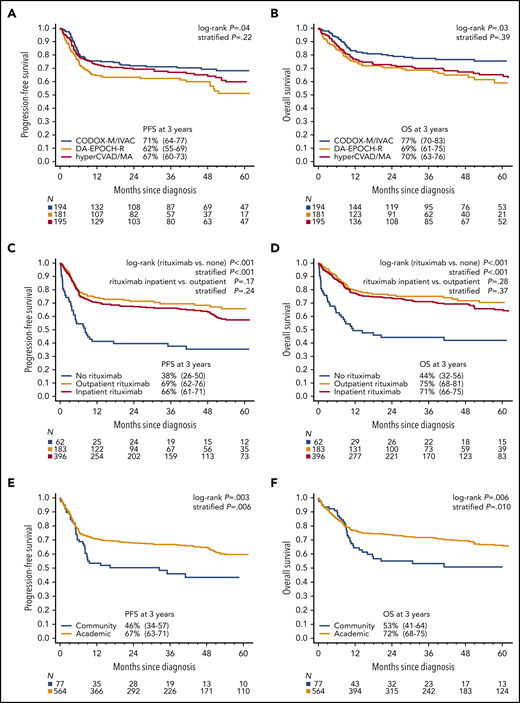
Survival by treatment type and site. Kaplan-Meier curves of (A) PFS and (B) OS for 3 most common chemotherapy regimens. Three-year PFS rates for CODOX-M/IVAC vs hyperCVAD/MA vs DA-EPOCH were 71% (95% CI, 64-77) vs 67% (95% CI, 60-73) vs 62% (95% CI, 55-69), respectively, stratified P = .22; corresponding 3-year OS rates were 77% (95% CI, 70-83) vs 70% (95% CI, 63-76) vs 69% (95% CI 61-75), respectively, stratified P = .39. Kaplan-Meier curves of (C) PFS and (D) OS based on receipt of rituximab and site of administration. Three-year PFS rates for patients who received rituximab compared with patients who did not receive rituximab as a component of initial therapy were 67% (95% CI, 63-71) vs 38% (95% CI, 26-50), respectively, stratified P < .001, with 3-year OS rates of 72% (95% CI, 68-76) vs 44% (95% CI, 32-56), respectively, stratified P < .001. Three-year PFS rates for patients who received rituximab outpatient vs inpatient were 69% (95% CI, 62-76) vs 66% (95% CI, 61-71), stratified P = .24; the 3-year OS rates were 75% (95% CI, 68-81) vs 71% (95% CI, 66-75), respectively, stratified P = .37. Kaplan-Meier curves of (E) PFS and (F) OS based on treatment location. Three-year PFS rates for patients treated in an academic center vs community oncology center were 67% (95% CI, 63-71) vs 46% (95% CI, 34-57), respectively, stratified P = .006; 3-year OS rates were 72% (95% CI, 68-75) vs 53% (95% CI, 41-64), respectively, stratified P = .010. Stratification factors for log-rank tests were age ≥ 40 years, LDH > 3× ULN, ECOG performance status 2 to 4, and CNS involvement.
Survival by treatment type and site. Kaplan-Meier curves of (A) PFS and (B) OS for 3 most common chemotherapy regimens. Three-year PFS rates for CODOX-M/IVAC vs hyperCVAD/MA vs DA-EPOCH were 71% (95% CI, 64-77) vs 67% (95% CI, 60-73) vs 62% (95% CI, 55-69), respectively, stratified P = .22; corresponding 3-year OS rates were 77% (95% CI, 70-83) vs 70% (95% CI, 63-76) vs 69% (95% CI 61-75), respectively, stratified P = .39. Kaplan-Meier curves of (C) PFS and (D) OS based on receipt of rituximab and site of administration. Three-year PFS rates for patients who received rituximab compared with patients who did not receive rituximab as a component of initial therapy were 67% (95% CI, 63-71) vs 38% (95% CI, 26-50), respectively, stratified P < .001, with 3-year OS rates of 72% (95% CI, 68-76) vs 44% (95% CI, 32-56), respectively, stratified P < .001. Three-year PFS rates for patients who received rituximab outpatient vs inpatient were 69% (95% CI, 62-76) vs 66% (95% CI, 61-71), stratified P = .24; the 3-year OS rates were 75% (95% CI, 68-81) vs 71% (95% CI, 66-75), respectively, stratified P = .37. Kaplan-Meier curves of (E) PFS and (F) OS based on treatment location. Three-year PFS rates for patients treated in an academic center vs community oncology center were 67% (95% CI, 63-71) vs 46% (95% CI, 34-57), respectively, stratified P = .006; 3-year OS rates were 72% (95% CI, 68-75) vs 53% (95% CI, 41-64), respectively, stratified P = .010. Stratification factors for log-rank tests were age ≥ 40 years, LDH > 3× ULN, ECOG performance status 2 to 4, and CNS involvement.
Prognostic factors
Achievement of CR was strongly associated with survival (Fig. 4A-B), which was independent of chemotherapy regimen (data not shown), whereas there was no difference in the outcome of patients achieving partial remission or stable disease. Six of 47 (13%) patients with partial remission or stable disease did not relapse and remain alive at last follow-up, whereas 11 of 47 (24%) patients relapsed but were successfully salvaged (supplemental Table 2).
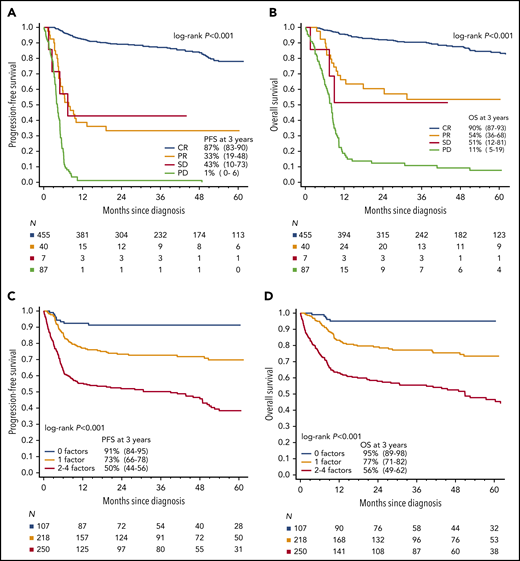
Prognostic factors in BL. Kaplan-Meier curves of (A) PFS and (B) OS based on remission status at the end of first-line therapy. The 3-year PFS for patients with CR, PR, SD, and PD were 87% (95% CI, 83-90), 33% (95% CI, 12-48), 43% (95% CI, 10-73), and 1% (95% CI, 0-6), respectively; 3-year OS rates were 90% (95% CI, 87-93), 54% (95% CI, 35-68), 51% (95% CI, 12-81), and 11 (95% CI, 5-19), respectively. Kaplan-Meier curves of (C) PFS and (D) OS by the number of adverse prognostic factors (ie, age ≥ 40 years, ECOG PS 2-4, LDH > 3× normal, and CNS involvement at diagnosis). Increasing number of factors presented portended an increasingly poor prognosis: in the derivation cohort, 3-year PFS with 0, 1, or 2 to 4 factors was 91% (95% CI, 84-95), 73% (95% CI, 66-78), and 50% (95% CI, 44-56), respectively (P < .001), and associated 3-year OS rates were 95% (95% CI, 89-98), 77% (95% CI, 71-82), and 56% (95% CI, 49-62), respectively (P < .001). Abbreviations: PR, partial remission; SD, stable disease; PD, progressive disease.
Prognostic factors in BL. Kaplan-Meier curves of (A) PFS and (B) OS based on remission status at the end of first-line therapy. The 3-year PFS for patients with CR, PR, SD, and PD were 87% (95% CI, 83-90), 33% (95% CI, 12-48), 43% (95% CI, 10-73), and 1% (95% CI, 0-6), respectively; 3-year OS rates were 90% (95% CI, 87-93), 54% (95% CI, 35-68), 51% (95% CI, 12-81), and 11 (95% CI, 5-19), respectively. Kaplan-Meier curves of (C) PFS and (D) OS by the number of adverse prognostic factors (ie, age ≥ 40 years, ECOG PS 2-4, LDH > 3× normal, and CNS involvement at diagnosis). Increasing number of factors presented portended an increasingly poor prognosis: in the derivation cohort, 3-year PFS with 0, 1, or 2 to 4 factors was 91% (95% CI, 84-95), 73% (95% CI, 66-78), and 50% (95% CI, 44-56), respectively (P < .001), and associated 3-year OS rates were 95% (95% CI, 89-98), 77% (95% CI, 71-82), and 56% (95% CI, 49-62), respectively (P < .001). Abbreviations: PR, partial remission; SD, stable disease; PD, progressive disease.
The bootstrap-based variable selection for the prognostic model selected 4 baseline factors that were independently associated with worse PFS: age ≥ 40 years, ECOG PS 2-4, LDH > 3× normal, and CNS involvement. Associated survival curves revealed that patients with 2, 3, or 4 factors had similar poor outcomes, so they were all included in the high-risk category. Patients without any risk factors (19% of the entire cohort) constituted a group with excellent prognosis (3-year PFS 91%, median PFS not reached). In contrast, patients with 2 to 4 factors or any CNS involvement, who constituted 46% of the entire cohort, had 3-year PFS of only 50% (Fig. 4C-F). On internal validation by the nonparametric bootstrap, the resulting 3-group model had concordance statistic (Harrell’s C) of 0.67 (bias-corrected 95% CI, 0.63-0.70) and Brier score of 0.039 (bias-corrected 95% CI, 0.027-0.053) for 3-year PFS prediction. The model was similarly prognostic for patients treated with the 3 most common chemotherapy programs (CODOX-M/IVAC, hyperCVAD/MA, or DA-EPOCH-R; see Table 2) and when analyzing only patients with documented/known MYC rearrangement (data not shown).
Multivariate analyses of prognostic factors
| Variable | PFS | OS | ||||
|---|---|---|---|---|---|---|
| Observed HR* | Bias-corrected 95% CI† | P | Observed HR* | Bias-corrected 95% CI† | P | |
| All patients | ||||||
| Ages ≥ 40 yr | 1.70 | 1.24-2.37 | .001 | 2.02 | 1.38-2.92 | <.001 |
| LDH > 3× ULN | 1.83 | 1.33-2.46 | <.001 | 1.67 | 1.20-2.26 | .003 |
| ECOG 2-4 | 1.60 | 1.13-2.20 | .006 | 1.80 | 1.24-2.52 | .001 |
| CNS involvement | 1.52 | 1.06-2.08 | .018 | 1.63 | 1.13-2.30 | .010 |
| Common regimens‡ | ||||||
| Ages ≥ 40 yr | 1.48 | 1.06-2.14 | .026 | 1.78 | 1.18-2.65 | .005 |
| LDH > 3× ULN | 1.88 | 1.34-2.71 | <.001 | 1.72 | 1.19-2.51 | .005 |
| ECOG 2-4 | 1.43 | 1.00-2.17 | .068 | 1.60 | 1.06-2.40 | .021 |
| CNS involvement | 1.65 | 1.11-2.25 | .008 | 1.82 | 1.15-2.63 | .003 |
Hazard ratios > 1 indicate a factor with poor prognosis, whereas those < 1 indicate a factor with favorable prognosis; bias indicates optimism of the model assessed by internal validation; 95% CI are bias corrected.
Bias-corrected estimates of 95% CI obtained from internal model validation by bootstrap using 1000 randomly subset (with replacement) replicates of the data set.
Models fitted in the subgroup of BL patients treated with CODOX-M/IVAC, hyperCVAD/MA, or DA-EPOCH-R therapy only (n = 570).
Finally, when examined in subgroups defined by type of first-line regimen, PFS did not significantly differ according to age alone for patients treated with CODOX-M/IVAC or DA-EPOCH, whereas ages < 40 years was prognostic among those treated with hyperCVAD/MA (supplemental Fig. 3A-C). In contrast, the 3-group model defined by the number of independent risk factors was prognostic regardless of first-line regimen (supplemental Fig. 3D-F).
Discussion
To the best of our knowledge, this represents the largest report to date evaluating detailed characteristics, treatment patterns, patient outcomes, and prognostication for adults with newly diagnosed BL. Patients included in this retrospective study received contemporary chemotherapeutic regimens providing real-world data on therapeutic platforms and survival rates in BL. Key findings from this analysis included (1) identification of overall more modest survival rates in adults with BL compared with prior clinical trials and smaller series; (2) a significant and unexpectedly high TRM rate across most regimens and was especialy prominent in older patients; (3) lack of survival difference between HIV-negative and -positive BL; (4) 3-year PFS of 64% for all patients with overall similar outcomes with the 3 most common chemotherapy regimens; (5) 14% of patients had primary refractory disease; (6) significant survival benefit with rituximab; (7) lack of survival difference whether rituximab was given inpatient or outpatient; (8) improved outcomes for patients treated at an academic medical center vs community center; and (9) delineation of significant baseline clinical prognostic factors for patient outcome. In interpreting these observations, several factors should be considered.
An optimal frontline strategy in BL has not been clearly defined given the paucity of randomized studies.24,25 Nevertheless, most regimens have incorporated intensive multiagent therapy with adequate CNS-penetrant chemotherapeutic agents, and clinical trials have sequentially modified these high-intensity combinations to mitigate potential toxicities.2,5-9 An exception is the DA-EPOCH-R regimen, which decreases the dose intensity using a pharmacokinetics-driven rationale resulting in a combination applicable to older, more frail, or immunosuppressed patients.11,26,27 However, survival rates identified in our analysis appear inferior to outcomes published in single institution case series or in phase 2 clinical trials,4,7,11,12,27 although they are more in line with other multicenter BL data sets.28-30 The more modest outcomes identified here can likely be explained by a less-biased case selection enriched with patients presenting with higher risk features such as poor PS, organ dysfunction, and/or CNS disease, which may represent exclusion criteria for clinical trials.
The TRM rate in our study was also higher than reported in most clinical trials.2,3,7,8,11,25 TRM here was commonly sepsis related, appeared more frequent with the hyperCVAD/MA regimen, but was not influenced by HIV status. Furthermore, our data suggest significantly higher (≥13%) TRM rates in older patients, even with the lower-intensity DA-EPOCH-R regimen. We did not have data on the frequency or type of prephase therapy, which may play a role in improving patients’ PS and lessening TRM. Cyclophosphamide- and corticosteroid-based prephase is a mandatory component of several regimens for BL5,8,9,12 but has not been consistently used in in all trials or regimens. The use of prephase therapy should be more closely analyzed in future BL studies, similar to Pfreundschuh et al,31 who elucidated this in diffuse large B-cell lymphoma (especially for older patients and/or those with compromised PS caused by disease). We identified that optimal management of older patients (ages ≥ 60 years) with BL remains an important area in need of research.
The rates of ORR, as well as PFS and OS estimates, were numerically higher among patients treated with CODOX-M/IVAC therapy compared with other treatment programs. This regimen is often selected in clinical practice for fit, younger patients who are suitable for short-course, high-intensity therapy, which includes high-dose methotrexate and ifosfamide and requires expertise to deliver safely.3-6,32 Given nonuniform patient selection criteria and potential indication bias, our results should not suggest differential outcomes of chemotherapy platforms for clinical practice of BL patients. There was no statistically significant difference between them in a log-rank test stratified by risk group in our study. However, certain high-risk subsets of BL, such as patients with CNS involvement, may experience differential outcomes with specific treatment platforms, as delineated in a separate analysis from this data set.22 Additionally, an ongoing randomized study comparing rituximab (R)-CODOX-M/R-IVAC vs DA-EPOCH-R for patients with newly diagnosed BL will help address the role of lower-intensity therapy (EudraCT number: 2013-004394-27). Outcomes in the modern era appear to have improved with the incorporation of rituximab to chemotherapy backbone, as well as improvements in supportive care and HIV management.9,12,33 Our data also strongly support inclusion of rituximab into first-line therapy of BL. Moreover, we found no difference in outcomes among patients who received rituximab as outpatients rather during the inpatient admission(s), suggesting that administration of rituximab may be safely uncoupled from chemotherapy and given in an interdigitating fashion as outpatient therapy.
In terms of prognostication, clinical trials, and other series have identified a variety of high-risk features in BL, including elevated LDH, ECOG PS ≥ 2, advanced stage, ≥2 extranodal sites of involvement, bulky disease, and CNS or bone marrow invasion.2-4,28-30,34-37 These risk factors have been considered in clinical practice to help decide on treatment strategies38 ; however, most studies were conducted in the pre-rituximab era and are based on smaller samples with often arbitrary cutoffs of LDH and under-representation of older or HIV+ individuals. Thus, their prognostic value with current treatment approaches remains unclear. More recently, Hoelzer et al9 identified female sex as a high-risk feature after a rituximab-containing regimen, although no adverse effects of CNS disease or elevated LDH at diagnosis were observed; this analysis had no patients with HIV and relatively few individuals with poor ECOG PS. Additionally, the comparative smaller size of that data set may have precluded sufficient power to establish an optimal cutoff for age, LDH, and other factors.
Using a bootstrap-based resampling procedure, we identified several clinical prognostic factors present at baseline that are predicted to consistently portend inferior survival in BL: ages ≥ 40 years; elevated LDH > 3× normal; ECOG PS 2 to 4; and presence of CNS involvement. Our study had sufficient power to conclusively identify CNS involvement as a strong adverse prognostic factor in BL, underscoring the critical importance of adequate CNS staging in BL. A separate analysis of this data set has addressed factors associated with baseline CNS involvement, treatment patterns related to CNS-directed prophylaxis and therapy, and the risk of CNS recurrence.22 Interestingly, age < 40 years was significantly associated with improved survival, with patients age 40 to 59 years tracking similarly to patients ≥60 years of age. This supports data from other smaller analyses36,37 and may be reflective of the better tolerability of intensive therapy among younger subjects, as age ≥ 40 was also significantly associated with the risk of TRM. The number of patients over age 70 was low, and the outcomes of these patients may not be well reflected in our analysis, because they depend on ability to receive intensive therapy and geriatric-specific fitness factors not captured in the data set. Collectively, absence of any of the 4 prognostic factors delineated a group of BL patients with PFS exceeding 90%. Conversely, the higher-risk group (2-4 adverse factors or any CNS involvement), which constituted nearly half of these real-world adult patients with BL, had much poorer survival. Although our index showed good performance on internal validation, further external validation is warranted in different geographical and/or practice settings to fully assess its calibration and clinical usefulness.
Survival rates did not appear different based on HIV status; a separate, more detailed analysis of HIV patients from this BL cohort has been presented.23 . Failure to achieve CR with frontline therapy was also associated with poorer outcomes, which in part highlights that BL patients with persistent or progressive disease are highly difficult to salvage. In fact, 14% of patients in our series had primary refractory disease, suggesting there are a subgroup of BL patients who may be inherently resistant to cytotoxic chemotherapy. We confirmed that survival for patients with primary refractory disease is dismal. Finally, we observed improved outcomes for patients treated at academic rather than community centers. Interpreting this difference must be done with caution and needs further exploration.39 There are a complex interplay of differences in patient characteristics, treatment regimens and intensity, and expertise in supportive care, as well as potential referral bias, that may have all contributed to this difference.
In conclusion, in this large, real-world, multicenter cohort of adult BL patients treated in the modern era, outcomes appeared more modest compared with prior clinical trials and smaller series. Therapy with the 3 most commonly used chemotherapy regimens was mostly comparable, whereas use of rituximab was and treatment at an academic medical center was associated with significantly improved survival. However, TRM occurred in a significant minority of patients, most common with hyperCVAD/MA and in older patients. MVA identified pretreatment variables that were highly prognostic for survival, including CNS involvement. Furthermore, these clinical factors yielded risk-stratified OS rates ranging from >90% to about 50%. External validation of these factors in an independent and international data set is warranted, which may help guide therapeutic recommendations and future clinical trial design. Altogether, there is a need to continue to identify optimum treatment of BL patients with higher-risk disease, including those with CNS involvement,22 and also to delineate lower-risk patients where a lower amount of therapy may be sufficient for cure.
Presented in abstract form at the 61st annual meeting of the American Society of Hematology, Orlando, FL, 8 December 2019.
Qualified researchers may request nonconfidential data from the corresponding author.
The online version of this article contains a data supplement.
The publication costs of this article were defrayed in part by page charge payment. Therefore, and solely to indicate this fact, this article is hereby marked “advertisement” in accordance with 18 USC section 1734.
Acknowledgments
The authors thank the staff at each of the local lymphoma research offices for assisting with protocol approval and data collection.
Authorship
Contribution: A.M.E., A.S., and J.P.A. designed research, performed research, analyzed data, and wrote the paper; S.-H.K., R.V., C.W., D.R., S.S., N.R., Y.L., U.F., C.D., D.A.B., S.B., M.C.C., A.G., N.K., Y.K.C., M.Y., E.R., G.V., R.K., A.M., J.R., M.B., P.M., A.R., A.C., C.D., A.S.-E., and A.K.K. analyzed data and wrote the paper; and A.D., D.J., K.A.B., K.M.B., S.E.S., B.M.H., V.M.O.-N., V.P.K., A.Z., S.M.M., N.E., P.V., T.A.F., S.D.D., A.S., I.S.L., K.A.D., S.N., M.S., M.A.L., P.C., M.K., N.P., V.B., C.A.P., T.P., and A.J.O. performed research, analyzed data, and wrote the paper.
Conflict-of-interest disclosure: A.E. consulted for and received honoraria from Seattle Genetics; received honoraria from Research to Practice; consulted for and received honoraria from Epizyme; consulted for and received honoraria from Verastem; consulted for and received honoraria from MorphoSys; consulted for and received honoraria from Affimed; received honoraria from Novartis and Pharmacyclics for Data Safety Monitoring Committee services; consulted for and received honoraria from Bayer; and received research funding from Takeda and Merck. S.S. received research funding from Incyte Corporation, Seattle Genetics, Portola Pharmaceuticals, Pharmacyclics, Acerta Pharma BV, AstraZeneca, Genentech, and Denova Biopharma; received membership on the board of directors or advisory committee for AstraZeneca; consulted for and received research funding from Merck Sharp & Dohme Corp.; and his spouse received researching funding from Ignyta, Bristol-Myers Squibb, and Ayala. S.N. was on the advisory board for Celgene. N.R. consulted for KITE Pharma, Abbvie, and Celgene, received research funding from Genentech; and consulted for and received research funding from BMS. U.F. received honoraria from Celgene and received research funding from Kite Pharma. N.E. is on the speaker’s bureau for Verastem Oncology and received honoraria from Pharmacyclics. N.K. has membership on an entity's board of directors or advisory committee for Seattle Genetics and Abbvie; provides educational content/symposium for Janssen; and receives research funds from Bristol Myers. J.A. is an immediate family member who received honoraria from Puma Biotechnology, Agios, Inovio Pharmaceuticals, and Foundation Medicine; receives honoraria from Targeted Oncology; and consults for OncLive. M.Y. receives honoraria from Bayer; receives research funding from Genentech; and consults for Octapharma and Abbvie. C.D. consults for and received research funding from Bristol-Myers Squibb; receives research funding from Denovo; consults for and receives research funding from Genentech; receives research funding from Incyte, LAM Therapeutics, MEI, Millenium/Takeda, and Trillium; consults for and receives research funding from Merck; and consults for and receives research funding from Seattle Genetics. R.K. is on the speakers bureau for Astrazeneca; receives institutional research funding from Takeda and BMS; and consults for and is on the speakers bureau for Gilead, Kite, Juno, and Celgene. P.M. consults foe Celgene, Teneobio, Karyopharm, Janssen, Sandoz, and I-MAB. M.K. is on the speakers bureau for Seattle Genetics; consults for Pharmacyclics, AstraZeneca, and Celgene; and is employed by the University of Colorado. C.P. receives research funding from Xencor, Roche/Genentech, Infinity, TG Therapeutics, AbbVie, and Acerta/AstraZeneca; consults for Pharmacyclics, Janssen, Amgen, and Bayer; and consults for and received research funding from Genentech, BeiGene, and Kite. I.L. has membership on an entity's board of directors or advisory committee for Janssen Scientific and Seattle Genetics and receives research funding from the National Institutes of Health. A.O. receives research funding from Genentech, Adaptive Biotechnologies, TG Therapeutics, and Spectrum Pharmaceuticals. The remaining authors declare no competing financial interests.
Correspondence: Andrew M. Evens, Division of Blood Disorders, Rutgers Cancer Institute of New Jersey, Rutgers Robert Wood Johnson Medical School, 195 Little Albany St, New Brunswick, NJ 08901; e-mail: andrew.evens@rutgers.edu.
