

Key Points
ZAP-70 is essential to maintain a constitutive survival signal for CLL cells and is directly involved in the expression of CCL3 and CCL4.
Upon BCR activation, ZAP-70 increasingly forms complexes with ribosomes and promotes MYC expression and protein synthesis.

Abstract
The expression of ZAP-70 in a subset of chronic lymphocytic leukemia (CLL) patients strongly correlates with a more aggressive clinical course, although the exact underlying mechanisms remain elusive. The ability of ZAP-70 to enhance B-cell receptor (BCR) signaling, independently of its kinase function, is considered to contribute. We used RNA-sequencing and proteomic analyses of primary cells differing only in their expression of ZAP-70 to further define how ZAP-70 increases the aggressiveness of CLL. We identified that ZAP-70 is directly required for cell survival in the absence of an overt BCR signal, which can compensate for ZAP-70 deficiency as an antiapoptotic signal. In addition, the expression of ZAP-70 regulates the transcription of factors regulating the recruitment and activation of T cells, such as CCL3, CCL4, and IL4I1. Quantitative mass spectrometry of double–cross-linked ZAP-70 complexes further demonstrated constitutive and direct protein-protein interactions between ZAP-70 and BCR-signaling components. Unexpectedly, ZAP-70 also binds to ribosomal proteins, which is not dependent on, but is further increased by, BCR stimulation. Importantly, decreased expression of ZAP-70 significantly reduced MYC expression and global protein synthesis, providing evidence that ZAP-70 contributes to translational dysregulation in CLL. In conclusion, ZAP-70 constitutively promotes cell survival, microenvironment interactions, and protein synthesis in CLL cells, likely to improve cellular fitness and to further drive disease progression.
Introduction
The tyrosine kinase ZAP-70 is an essential molecule for upstream T-cell receptor signaling that is required for cell-activation and development.1,2 ZAP-70 expression in malignant B cells from a subset of patients with chronic lymphocytic leukemia (CLL) (hereafter named ZAP-70pos) has been shown to correlate with unmutated IGHV genes.3,4 Therefore, it is not surprising that its presence is predictive of a more aggressive clinical course. However, analyses of discordant cases demonstrated that it is an independent biomarker and possesses stronger predictive power than the IGHV status.5 Ultimately, this also suggested that ZAP-70 has a biological function that is relevant to disease progression. In several studies, it was demonstrated that the presence of ZAP-70 enhances B-cell receptor (BCR) signaling induced by anti–immunoglobulin M (IgM) stimulation, although tyrosine kinase activity appears to be dispensable for this.6-8 Because the presence of a BCR-activating (auto)-antigen seems to be a feature predominantly of mutated (M)-CLL (and ZAP-70neg) based on the expression of surface IgM,9 it remains a conundrum precisely when this function of ZAP-70 becomes relevant in vivo.
Several studies have described properties of ZAP-70pos cells that are likely relevant to the pathogenesis of the disease, such as increased secretion of CCL3 and CCL4.10 In addition, ZAP-70 expression is associated with an increased migration potential.11-13 These studies provided valuable information to better understand the biology of ZAP-70pos CLL. However, because of the correlative nature of these studies, it remains largely unknown whether ZAP-70 is a biomarker indicating the presence of these properties, mediated by other factors, or actively contributes. Previously, the difficulties inherent in manipulating primary CLL cells were the major roadblock in addressing this question. Therefore, functional studies were often performed only in cell lines, which, for several reasons, are poor models of CLL. Here, we provide evidence that ZAP-70 is directly implicated in the provision of survival signals, protein synthesis, and the recruitment of T cells.
Materials and methods
Cell culture
After patients provided informed consent and in accordance with the Helsinki Declaration, peripheral blood was obtained from CLL patients. Studies were approved by the Cambridgeshire Research Ethics Committee (07/MRE05/44). Mononuclear cells were isolated from heparinized blood by centrifuging over a Ficoll-Hypaque layer (PAN-Biotech). Cells were further isolated with anti-CD2 and anti-CD14 beads, resulting in 95% to 99% pure CD5+CD19+ cells. After thawing of cryopreserved samples, cells were cultured in RPMI 1640 (Gibco) supplemented with 10% fetal bovine serum, 50 U/mL penicillin/streptomycin, 1 mM sodium pyruvate, 2 mM l-glutamine, 20 mg/mL l-asparagine, 50 μM 2-mercaptoethanol, 10 mM HEPES, and MEM nonessential amino acids (Gibco). ZAP-70 status was assessed by flow cytometry using intracellular staining with an anti–ZAP-70 antibody (BD Biosciences). Samples with >20% positive cells compared with isotype control were considered ZAP-70pos.
Nucleofection of primary CLL cells
Nucleofector technology (Lonza) was used to deliver small interfering RNA (siRNA) to primary cells. A total of 5 × 10⁶ CLL cells was resuspended in 100 μL of Solution-V with 7.5 μL of nonsilencing control (NSC) siRNA (Thermo Fisher Scientific; cat. no. 12935300) or 2.5 μL of each ZAP-70 siRNA (Life Technologies; HSS187732, HSS187733, HSS187734). The cell-siRNA suspension was nucleofected using a Nucleofector 2b Device (Lonza) (program Cell type-4, X-001). Cell pellets were collected and resuspended in 3 mL of fresh media. siRNA-transfected CLL cells were cocultured with 5 × 10⁴ stromal cells (plated 24 hours prior to coculturing CLL cells) per well in a 6-well plate for 7 days.
Pull-down of endogenous ZAP-70 from primary CLL cells
For each condition, 20 × 106 purified CLL cells were used. Post-BCR activation using a rabbit anti-human anti-IgM antibody, cells were fixed with disuccinimidyl glutarate for 20 minutes at room temperature. Formaldehyde (1%) in serum-free media was then added for 10 minutes at room temperature, followed by quenching with 125 μM glycine for 5 minutes.14 Cells were then washed with cold 1× phosphate-buffered saline twice. Pellets were resuspended in IP Lysis Buffer (Thermo Fisher Scientific) (supplemented with protease inhibitors) and subjected to 3 freeze-and-thaw cycles on dry ice. Samples were then spun at 13 000 rpm for 6 minutes, and supernatant containing the whole-cell lysates was collected. An aliquot of supernatant was saved as input for further analysis, and the remaining supernatant was incubated overnight at 4°C with an anti–ZAP-70 antibody or IgG. Prewashed Protein A beads were added and incubated for 4 hours at 4°C. After incubation, the beads were bound to a magnetic rack, wash buffer was removed, and the beads were processed for mass spectrometry.
Measurement of protein synthesis
A total of 5 × 10⁶ primary CLL cells was activated by anti-human IgM–coated streptavidin beads (Dynabeads M-280 Streptavidin; Thermo Fisher Scientific) in 100 μL of media for 20 minutes. After an additional 30 minutes, O-propargyl-puromycin (OPP) intensities were assessed by flow cytometry (Click-iT Plus OPP Alexa Fluor 488 Protein Synthesis Assay Kit; Thermo Fisher Scientific). Mean fluorescence intensity (MFI) on a fluorescein isothiocyanate (FITC) channel was calculated as a representation of OPP labeling intensity.
Statistical analyses
All experiments were repeated ≥3 times, and the mean ± standard error of the mean were calculated. The exact sample size for each experiment or biological or technical repeat is provided in the figure legends. Statistical analyses were performed using a 2-tailed paired Student t test. For experiments in which >2 groups were compared, statistical analyses were performed using 1-way analysis of variance followed by a 2-tailed paired Student t test.
Results
Slow turnover of ZAP-70 in primary CLL cells requires extended in vitro culture for siRNA studies
The BCR-associated kinases Syk and ZAP-70 are presumed to share functional properties in transmitting signals in CLL cells.6 Because of the high degree of homology between ZAP-70 and Syk, experiments using small molecule inhibitors do not distinguish the effects on ZAP-70 from those on Syk. To overcome these limitations, we knocked down ZAP-70 in primary CLL cells using RNA interference. Patient characteristics are listed in supplemental Table 8, available on the Blood Web site. Our initial experiments were unsuccessful and suggested that ZAP-70 has a half-life > 72 hours; however, after extended ex vivo culture, we observed a significant downregulation of ZAP-70 (Figure 1A-B). To maintain cell survival for further functional studies, cells were temporarily cultured on stroma cells, which substantially limited transfection-induced toxicity and spontaneous apoptosis of cells in suspension culture (Figure 1C). Importantly, RNA interference with ZAP-70 expression did not affect Syk expression, which allowed us to investigate ZAP-70 functions in primary CLL cells without the simultaneous inhibition of Syk (Figure 1D-E).
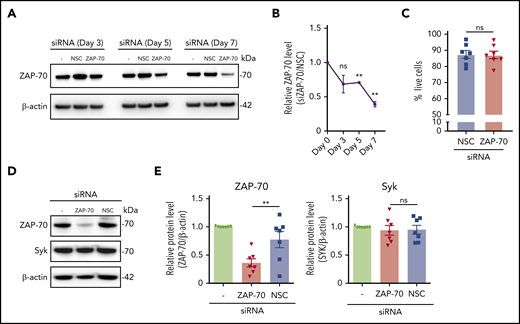
siRNA effectively depletes ZAP-70 without affecting Syk expression in primary CLL cells. (A) Representative ZAP-70 and β-actin immunoblots of primary CLL cells at the indicated time points post-siRNA nucleotransfection with a nonspecific siRNA and ZAP-70 siRNA. (B) Quantification of ZAP-70 expression using ImageJ and calculated as a ratio (siZAP-70/NSC) after normalization to β-actin signal. Time points indicate time after nucleofection (n = 3). (C) Percentage of live (Annexin V−, DAPI−) CLL cells on day 7 of transfection. Primary CLL samples (n = 7) were transfected with NSC siRNA or ZAP70 siRNA and cultured for 7 days on stroma cells. (D) Representative immunoblots of ZAP-70, Syk, and β-actin of primary purified CLL cells 7 days post-siRNA transfection. (E) Quantification of ZAP-70 and Syk expression, normalized to β-actin, 7 days post-siRNA transfection (n = 7). Statistical analyses were performed using 1-way analysis of variance followed by a 2-tailed paired Student t test. **P < .01. ns, not significant (P > .05).
siRNA effectively depletes ZAP-70 without affecting Syk expression in primary CLL cells. (A) Representative ZAP-70 and β-actin immunoblots of primary CLL cells at the indicated time points post-siRNA nucleotransfection with a nonspecific siRNA and ZAP-70 siRNA. (B) Quantification of ZAP-70 expression using ImageJ and calculated as a ratio (siZAP-70/NSC) after normalization to β-actin signal. Time points indicate time after nucleofection (n = 3). (C) Percentage of live (Annexin V−, DAPI−) CLL cells on day 7 of transfection. Primary CLL samples (n = 7) were transfected with NSC siRNA or ZAP70 siRNA and cultured for 7 days on stroma cells. (D) Representative immunoblots of ZAP-70, Syk, and β-actin of primary purified CLL cells 7 days post-siRNA transfection. (E) Quantification of ZAP-70 and Syk expression, normalized to β-actin, 7 days post-siRNA transfection (n = 7). Statistical analyses were performed using 1-way analysis of variance followed by a 2-tailed paired Student t test. **P < .01. ns, not significant (P > .05).
ZAP-70 promotes cell survival but is not essential for proximal BCR signaling
Further downstream analyses were performed on monocultures by physically removing CLL cells from adherent stroma cells (Figure 2A), which resulted in pure lymphocyte populations >98% (data not shown). Because we were particularly interested in understanding how ZAP-70 modulates BCR signaling, we first assessed whether culturing CLL cells on stroma cells influenced the expression of surface IgM, which could possibly affect our experiments. Notably, surface IgM levels remained stable over time and were not affected by temporarily culturing cells on stroma cells (Figure 2B). Similarly, removal of CLL cells from stroma monolayers did not alter the expression of surface IgM (Figure 2C), indicating that our experimental system did not skew BCR signaling by modulating surface receptor expression. BCR activation with anti-IgM treatment rapidly induced Ca2+ flux, which, unexpectedly, was not altered by the protein levels of ZAP-70 (Figure 2D-E). We subsequently analyzed whether the presence of ZAP-70 affected the activation of proximal BCR kinases following receptor activation by crosslinking IgM for 20 minutes. This stimulation caused strong phosphorylation of BLNK, Syk, and PLCγ2, which was not significantly different between ZAP-70–proficient and -depleted cells, although we consistently detected a weaker phosphorylation of PLCγ2 in the ZAP-70–knockdown cells (Figure 2F-G). Similarly, anti-IgM–mediated AKT activation was unaffected by the levels of ZAP-70 (Figure 2H). However, we observed a small, but consistent and significant, difference in the baseline phosphorylation of AKT threonine 308, which is a known target for PDK1. The baseline phosphorylation of AKT serine 473, which is mediated by mTORC2, remained mostly unchanged by the expression of ZAP-70 (Figure 2H-I).
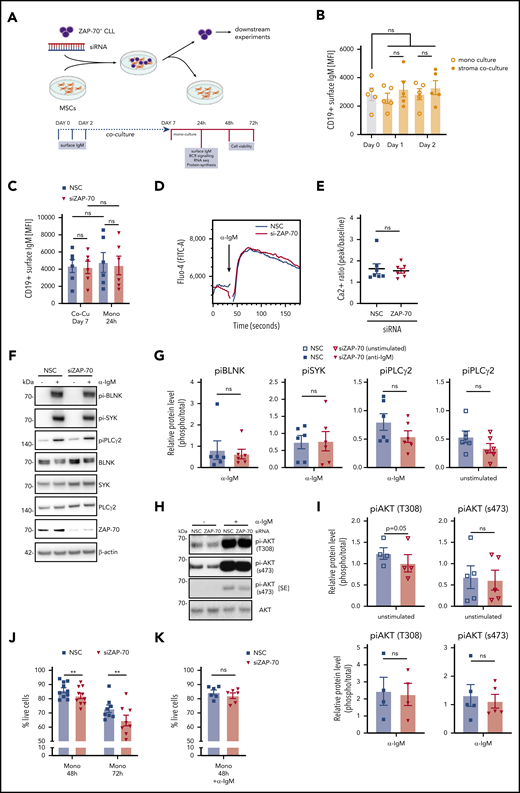
ZAP-70 contributes to cell survival but is not essential for IgM-stimulated BCR signaling. (A) Strategy for siRNA knockdown of ZAP-70 in primary ZAP-70pos CLL cells and coculture on feeder cells. Downstream analyses were performed on purified CLL cells in monoculture. Created with BioRender.com. (B) MFI of cell surface IgM on CD19+ CLL cells. Primary ZAP-70pos CLL cells (n = 5) were monocultured or cocultured on stromal cells for 1 or 2 days before assessment of surface IgM by fluorescence-activated cell sorting analysis. (C) MFI of cell surface IgM on CD19+ CLL cells transfected with nonspecific siRNA or ZAP-70 siRNA. Primary ZAP-70pos CLL cells (n = 6) were transfected with siRNA and cocultured with stromal cells for 7 days and then separated from stromal cells for an additional 24 hours in monoculture. (D) Representative kinetics plot shows the calcium flux of 1 primary CLL sample after transfection with NSC siRNA or ZAP-70 siRNA. CLL cells were harvested and labeled with Fluo-4 (FITC) after 24 hours in monoculture. Anti-IgM activation was triggered 30 seconds after flow cytometric measurement started. (E) Quantification of calcium flux response of CLL samples (n = 7) transfected with NSC siRNA or ZAP-70 siRNA. Ratios were calculated by using kinetics plots, dividing peak Fluo-4 (FITC-A) intensity induced by anti-IgM activation by baseline Fluo-4 intensity. (F) Representative phospho-BLNK (Tyr96), phospho-Syk (Tyr525/526), phospho-PLCγ2 (Tyr759), total BLNK, total Syk, total PLCγ2, ZAP-70, and β-actin immunoblots of primary CLL cells monocultured for 24 hours after transfection with nonspecific siRNA or ZAP-70 siRNA. To induce BCR signaling, monocultured CLL cells were treated with bead-bound anti-IgM for 20 minutes. (G) Quantification of phosphokinases, relative to total (unphosphorylated) proteins after 24 hours in monoculture post-siRNA transfection, using ImageJ software (n = 6). (H) Representative phospho-AKT (s473), phospho-AKT (T308), total AKT, and β-actin immunoblots of primary CLL cells monocultured for 24 hours after transfection with nonspecific siRNA or ZAP-70 siRNA. For anti-IgM–stimulated samples, monocultured CLL cells were treated with bead-bound anti-IgM for 20 minutes. (I) Quantification of phospho-AKT relative to total (unphosphorylated) AKT, after 24 hours in monoculture after siRNA transfection, using ImageJ software (n = 4 or 5, as indicated). (J) Percentage of live (Annexin V−, DAPI−) CLL cells, cultured for 48 or 72 hours in monoculture posttransfection (n = 10 and n = 8, respectively). (K) Percentage of live (Annexin V−, DAPI−) CLL cells cultured in monoculture posttransfection (n = 7) and treated with anti-IgM for 48 hours (n = 6). **P < .01. ns, not significant (P > .05); SE, short exposure.
ZAP-70 contributes to cell survival but is not essential for IgM-stimulated BCR signaling. (A) Strategy for siRNA knockdown of ZAP-70 in primary ZAP-70pos CLL cells and coculture on feeder cells. Downstream analyses were performed on purified CLL cells in monoculture. Created with BioRender.com. (B) MFI of cell surface IgM on CD19+ CLL cells. Primary ZAP-70pos CLL cells (n = 5) were monocultured or cocultured on stromal cells for 1 or 2 days before assessment of surface IgM by fluorescence-activated cell sorting analysis. (C) MFI of cell surface IgM on CD19+ CLL cells transfected with nonspecific siRNA or ZAP-70 siRNA. Primary ZAP-70pos CLL cells (n = 6) were transfected with siRNA and cocultured with stromal cells for 7 days and then separated from stromal cells for an additional 24 hours in monoculture. (D) Representative kinetics plot shows the calcium flux of 1 primary CLL sample after transfection with NSC siRNA or ZAP-70 siRNA. CLL cells were harvested and labeled with Fluo-4 (FITC) after 24 hours in monoculture. Anti-IgM activation was triggered 30 seconds after flow cytometric measurement started. (E) Quantification of calcium flux response of CLL samples (n = 7) transfected with NSC siRNA or ZAP-70 siRNA. Ratios were calculated by using kinetics plots, dividing peak Fluo-4 (FITC-A) intensity induced by anti-IgM activation by baseline Fluo-4 intensity. (F) Representative phospho-BLNK (Tyr96), phospho-Syk (Tyr525/526), phospho-PLCγ2 (Tyr759), total BLNK, total Syk, total PLCγ2, ZAP-70, and β-actin immunoblots of primary CLL cells monocultured for 24 hours after transfection with nonspecific siRNA or ZAP-70 siRNA. To induce BCR signaling, monocultured CLL cells were treated with bead-bound anti-IgM for 20 minutes. (G) Quantification of phosphokinases, relative to total (unphosphorylated) proteins after 24 hours in monoculture post-siRNA transfection, using ImageJ software (n = 6). (H) Representative phospho-AKT (s473), phospho-AKT (T308), total AKT, and β-actin immunoblots of primary CLL cells monocultured for 24 hours after transfection with nonspecific siRNA or ZAP-70 siRNA. For anti-IgM–stimulated samples, monocultured CLL cells were treated with bead-bound anti-IgM for 20 minutes. (I) Quantification of phospho-AKT relative to total (unphosphorylated) AKT, after 24 hours in monoculture after siRNA transfection, using ImageJ software (n = 4 or 5, as indicated). (J) Percentage of live (Annexin V−, DAPI−) CLL cells, cultured for 48 or 72 hours in monoculture posttransfection (n = 10 and n = 8, respectively). (K) Percentage of live (Annexin V−, DAPI−) CLL cells cultured in monoculture posttransfection (n = 7) and treated with anti-IgM for 48 hours (n = 6). **P < .01. ns, not significant (P > .05); SE, short exposure.
Although proximal BCR signaling was largely unaffected by the expression of ZAP-70 in these experiments, extended in vitro culture demonstrated that the survival of CLL cells was significantly dependent on the presence of ZAP-70 in the absence of an induced BCR signal (Figure 2J). Importantly, the reduced survival of ZAP-70–depleted CLL cells was rescued by IgM crosslinking (Figure 2K).
In conclusion, ZAP-70 expression in CLL cells is required for cell survival in the absence of an induced BCR signal.
ZAP-70 is required for the constitutive expression of CCL3, CCL4, and IL4I1
To further explore how ZAP-70 contributes to disease progression, we performed bulk RNA-sequencing (RNA-seq) on primary CLL cells from 2 patients transfected with ZAP-70 siRNA or con-trol siRNA. The principal component analysis (PCA) of the raw gene abundances showed a clear separation between patients and ZAP-70 expression (Figure 3A). We reasoned that ZAP-70–dependent changes in gene expression could easily be masked by the enormous genetic heterogeneity of CLL samples15 (Figure 3B) and, therefore, initially used technical replicates on 2 patients, followed by validation quantitative polymerase chain reaction on additional samples. In total, we identified 40 differentially expressed genes, with 27 commonly downregulated genes and 13 upregulated genes in ZAP-70–deficient samples [adjusted P < .05; Log2 fold change [Log2(FC)] > 0.5] (Figure 3C; supplemental Table 1). Importantly, MYC, CCL4, and CCL3 showed a significant downregulation by knocking down ZAP-70 (Figure 3D). In addition, CD1c and IL4I1, the latter contributing to immune suppression in CLL,16 were also downregulated by depleting ZAP-70 expression. ZAP-70–dependent expression of these genes was validated by quantitative reverse transcription polymerase chain reaction (qRT-PCR) in additional ZAP-70pos patient samples (Figure 3E-F; supplemental Figure 1A). CCL3 and CCL4 are chemokines that are able to attract T cells and have previously been demonstrated to be regulated by BCR signaling.10 In line with this observation, inhibition of BTK with ibrutinib completely blunted the constitutive expression of CCL3 and CCL4 messenger RNA (mRNA) (Figure 3G).
![ZAP-70 constitutively regulates gene expression relevant for T-cell interactions. (A) PCA, created for the top 2000 most abundant genes, illustrates the separation across patients (mainly captured in PC1) and treatments (PC2). (B) Venn heat map representing the Jaccard Similarity Index of the top 2000 most abundant genes, across all pairwise comparisons on patients and treatments. The Jaccard Similarity Index spans the 0 to 1 range, which corresponds to no overlap (0) to identical sets of genes (1). The clear separation between patients is contrasted by closer similarity on replicates and treatments. (C) Volcano plot illustrating the differentially expressed genes [the x-axis is the log2(FC) between the control and siZAP-70 samples; the y-axis is the −log10(P value)]. Gray points correspond to nondifferentially expressed genes, red points correspond to genes for which the P value is <.05 [but |log2(FC)| < 0.5], blue points are significantly differentially expressed genes with log2(FC) > 0.5, and color intensity is proportional to the log2 of the average normalized expression levels across the compared samples. (D) Heat map of genes from cells of 2 individual primary patients with CLL treated with NSC siRNA or ZAP-70 siRNA. Red and blue indicate relatively high and low expression, respectively. Each condition analyzed depicts technical replicates, derived from 2 individual siRNA transfections. Genes were ranked by average Log2(FC), using EdgeR analysis, from bottom to top. (E) qRT-PCR analysis of CD1c and IL4I1 in primary CLL cells (CD19+ selected) (n = 8 and n = 7, respectively) transfected with nonspecific siRNA or ZAP-70 siRNA and monocultured for 24 hours. Relative gene expression level is normalized to reference gene GAPDH and compared with NSC. (F) qRT-PCR analysis of CCL3 and CCL4 in primary CLL cells (CD19+ selected) (n = 8 and n = 7, respectively) transfected with nonspecific siRNA or ZAP-70 siRNA and monocultured for 24 hours. Relative gene expression level is normalized to reference gene GAPDH and compared with NSC. (G) qRT-PCR analysis of CCL3 and CCL4 in primary CLL cells (CD19+ selected) (n = 4) transfected with nonspecific siRNA or ZAP-70 siRNA. Cells were treated with ibrutinib at 0.5 μM for 24 hours before cell harvesting. Relative gene expression level is normalized to reference gene GAPDH and compared with NSC. (H) GO enrichment analysis of the differentially expressed genes in (C). Background genes are the set of all genes that pass the noise threshold. *P < .05, **P < .01. ns, not significant (P > .05).](https://ash.silverchair-cdn.com/ash/content_public/journal/blood/137/26/10.1182_blood.2020009960/8/m_bloodbld2020009960f3.png?Expires=1769133688&Signature=zuGAZ37E8gN2ayGj0foeiKEUYIRB1V0trtEzSSiQO5qLTL~M5R4SI~sDkwEUI55mUsvRa7-KNoNLG~XSdylf7HM4RSxKuXFPE5hC2AP-eSRaoOxINutZL2-BRM2jQNlG7rUY~ZqV9SUfx4qb6vdWIkEmbsAOvIM3eyYlEIRnNwA6aEe7aaguQv66ptFZRV5ezSI56WLTjah1LGJOdNXWjh53wK7cvyUpwLUAHRVN6jBO9D9Itevz4NxVOBKr7e2C2yPPA764IaTN5SCD6Rj4W9vP6Oz8WEbFa86JeOnYl0p9c2QdLfIMtkLLDIF86lm3LP-dvM06yGmtCBlcVyeKkg__&Key-Pair-Id=APKAIE5G5CRDK6RD3PGA)
ZAP-70 constitutively regulates gene expression relevant for T-cell interactions. (A) PCA, created for the top 2000 most abundant genes, illustrates the separation across patients (mainly captured in PC1) and treatments (PC2). (B) Venn heat map representing the Jaccard Similarity Index of the top 2000 most abundant genes, across all pairwise comparisons on patients and treatments. The Jaccard Similarity Index spans the 0 to 1 range, which corresponds to no overlap (0) to identical sets of genes (1). The clear separation between patients is contrasted by closer similarity on replicates and treatments. (C) Volcano plot illustrating the differentially expressed genes [the x-axis is the log2(FC) between the control and siZAP-70 samples; the y-axis is the −log10(P value)]. Gray points correspond to nondifferentially expressed genes, red points correspond to genes for which the P value is <.05 [but |log2(FC)| < 0.5], blue points are significantly differentially expressed genes with log2(FC) > 0.5, and color intensity is proportional to the log2 of the average normalized expression levels across the compared samples. (D) Heat map of genes from cells of 2 individual primary patients with CLL treated with NSC siRNA or ZAP-70 siRNA. Red and blue indicate relatively high and low expression, respectively. Each condition analyzed depicts technical replicates, derived from 2 individual siRNA transfections. Genes were ranked by average Log2(FC), using EdgeR analysis, from bottom to top. (E) qRT-PCR analysis of CD1c and IL4I1 in primary CLL cells (CD19+ selected) (n = 8 and n = 7, respectively) transfected with nonspecific siRNA or ZAP-70 siRNA and monocultured for 24 hours. Relative gene expression level is normalized to reference gene GAPDH and compared with NSC. (F) qRT-PCR analysis of CCL3 and CCL4 in primary CLL cells (CD19+ selected) (n = 8 and n = 7, respectively) transfected with nonspecific siRNA or ZAP-70 siRNA and monocultured for 24 hours. Relative gene expression level is normalized to reference gene GAPDH and compared with NSC. (G) qRT-PCR analysis of CCL3 and CCL4 in primary CLL cells (CD19+ selected) (n = 4) transfected with nonspecific siRNA or ZAP-70 siRNA. Cells were treated with ibrutinib at 0.5 μM for 24 hours before cell harvesting. Relative gene expression level is normalized to reference gene GAPDH and compared with NSC. (H) GO enrichment analysis of the differentially expressed genes in (C). Background genes are the set of all genes that pass the noise threshold. *P < .05, **P < .01. ns, not significant (P > .05).
ZAP-70 constitutively regulates gene expression relevant for T-cell interactions. (A) PCA, created for the top 2000 most abundant genes, illustrates the separation across patients (mainly captured in PC1) and treatments (PC2). (B) Venn heat map representing the Jaccard Similarity Index of the top 2000 most abundant genes, across all pairwise comparisons on patients and treatments. The Jaccard Similarity Index spans the 0 to 1 range, which corresponds to no overlap (0) to identical sets of genes (1). The clear separation between patients is contrasted by closer similarity on replicates and treatments. (C) Volcano plot illustrating the differentially expressed genes [the x-axis is the log2(FC) between the control and siZAP-70 samples; the y-axis is the −log10(P value)]. Gray points correspond to nondifferentially expressed genes, red points correspond to genes for which the P value is <.05 [but |log2(FC)| < 0.5], blue points are significantly differentially expressed genes with log2(FC) > 0.5, and color intensity is proportional to the log2 of the average normalized expression levels across the compared samples. (D) Heat map of genes from cells of 2 individual primary patients with CLL treated with NSC siRNA or ZAP-70 siRNA. Red and blue indicate relatively high and low expression, respectively. Each condition analyzed depicts technical replicates, derived from 2 individual siRNA transfections. Genes were ranked by average Log2(FC), using EdgeR analysis, from bottom to top. (E) qRT-PCR analysis of CD1c and IL4I1 in primary CLL cells (CD19+ selected) (n = 8 and n = 7, respectively) transfected with nonspecific siRNA or ZAP-70 siRNA and monocultured for 24 hours. Relative gene expression level is normalized to reference gene GAPDH and compared with NSC. (F) qRT-PCR analysis of CCL3 and CCL4 in primary CLL cells (CD19+ selected) (n = 8 and n = 7, respectively) transfected with nonspecific siRNA or ZAP-70 siRNA and monocultured for 24 hours. Relative gene expression level is normalized to reference gene GAPDH and compared with NSC. (G) qRT-PCR analysis of CCL3 and CCL4 in primary CLL cells (CD19+ selected) (n = 4) transfected with nonspecific siRNA or ZAP-70 siRNA. Cells were treated with ibrutinib at 0.5 μM for 24 hours before cell harvesting. Relative gene expression level is normalized to reference gene GAPDH and compared with NSC. (H) GO enrichment analysis of the differentially expressed genes in (C). Background genes are the set of all genes that pass the noise threshold. *P < .05, **P < .01. ns, not significant (P > .05).
Gene ontology (GO) enrichment analysis of the differentially expressed genes against the expression gene set also showed ZAP-70 involvement in “cell migration” and “antigen binding” (Figure 3H). Importantly, BCR activation with anti-IgM treatment (24 hours) did not significantly alter the ZAP-70–dependent gene expression profile (supplemental Figure 1B). Conclusively, these data provide evidence that ZAP-70 expression correlates with the expression of CCL3 and CCL4 and is actively involved in their constitutive gene expression. This regulation does not require additional triggering of a BCR signal.
BCR signaling enhances binding of ZAP-70 to ribosomes
To gain further insights into the biology of ZAP-70 in CLL, we next isolated ZAP-70 immune complexes from primary CLL cells to identify binding partners by mass spectrometry. For this, we used the RIME (Rapid Immunoprecipitation Mass spectrometry of Endogenous proteins) protocol, which provides a sensitive method to identify protein complexes formed by endogenous proteins.17 Proteins were double–cross-linked with formaldehyde and the homobifunctional lysine cross-linker disuccinimidyl glutarate prior to pull-down. For the simultaneous analysis of cells treated or not with anti-IgM, we combined RIME with isobaric labeling using Tandem Mass Tags (TMT-10plex),14 which allows for the quantitative comparison between replicates and conditions. These combined methods enabled us to detect and to quantify endogenous transient protein complexes isolated from intact cells. We decided to perform technical repeats from 1 patient given the enormous heterogeneity of CLL cells, followed by coimmunoprecipitation studies to validate binding partners on additional patient samples.
The TMT-10plex–RIME raw data quantified 1476 unique proteins at a peptide false discovery rate (FDR) < 0.01. PCA showed a clear separation of ZAP-70 protein complexes from IgG controls and between non-IgM– and anti-IgM–treated cells (Figure 4A). Expectedly, 20 minutes after anti-IgM treatment, binding of ZAP-70 to known bona fide BCR signaling components was significantly enhanced (Figure 4B), indicating that this method reliably reports protein binding partners of ZAP-70. Comparison of IgG controls with proteins isolated from ZAP-70 complexes identified 1387 proteins with enhanced binding to ZAP-70 (supplemental Table 2). Notably, we identified numerous BCR-related kinases constitutively bound to ZAP-70 in the absence of a triggered BCR signal. Unexpectedly, a large proportion of bound proteins were ribosomal proteins, followed by proteins involved in metabolic processes and cell adhesion (Figure 4C-D). Further comparison of IgG controls with anti-IgM–treated CLL cells showed an overall similar binding profile with a further enrichment of ribosomal proteins and BCR signaling proteins (Figure 4E-F; supplemental Table 2). We then analyzed which proteins were differentially bound to ZAP-70 in the absence or presence of anti-IgM treatment and found enhanced binding of 214 proteins, whereas 162 proteins were less abundant after BCR stimulation (Figure 4G-H; supplemental Table 2). Following BCR activation, significantly more BCR-related kinases and ribosomal proteins were bound to ZAP-70.
![Constitutive binding of ZAP-70 to BCR kinases and ribosomal proteins. (A) PCA of protein abundance, representing the variability between anti–ZAP-70 pull-down, with or without anti-IgM stimulation for 20 minutes, and IgG isotype control. Each dot represents 1 technical replicate with an individual pull-down of ZAP-70 or IgG. (B) Heat map of proteins annotated in the Kyoto Encyclopedia of Genes and Genomes “BCR signaling pathway,” identified by mass spectrometry as ZAP-70 binding partners. Red and blue indicate relatively high and low protein abundance, respectively. Each condition analyzed depicts 3 (unstimulated) or 4 (IgM-activated) technical replicates. Proteins were ranked from left to right by Log2(FC) ratio comparing the IgM-activated group with the unstimulated group. (C) Volcano plot showing proteins bound to ZAP-70 [Log2(FC) > 0] vs IgG isotype control [Log2(FC), < 0] in unstimulated CLL cells. (D) Gene set enrichment analysis was applied to identify pathways with which ZAP-70–associated proteins are associated in unstimulated CLL cells. Pathways are listed in order of Normalized Enrichment Scores in columns (top x-axis). FDR q-values for each pathway set are indicated by the red dotted line (bottom x-axis). Colors of the columns represent different subgrouped cell functions. (E) Volcano plot showing proteins bound to ZAP-70 [Log2(FC) > 0] vs IgG isotype control [Log2(FC) < 0] in anti-IgM–activated CLL cells. (F) Gene set enrichment analysis to identify pathways associated with ZAP-70 in anti-IgM–activated CLL cells. (G) Volcano plot showing proteins differentially bound to ZAP-70 in unstimulated [Log2(FC) < 0] vs anti-IgM–activated [Log2(FC) > 0] states. (H) Gene set enrichment analysis to identify pathways associated with ZAP-70 after BCR activation with an anti-IgM.](https://ash.silverchair-cdn.com/ash/content_public/journal/blood/137/26/10.1182_blood.2020009960/8/m_bloodbld2020009960f4.png?Expires=1769133688&Signature=GymyuMpeWZ0WN70UiMgD3RbdkB-2y6c6pvZv9Dh9jpk~hd9cYpmZGI-tU-ZVpMqzQVoYnGgZsI2OMpa1XprSddgjCuJ0MCMHFnfmm1NJ0eBd2s7zLSDvbzRRjg9AsH7qgUO3-gtCA3AM~BxVe0MmSXbc05wDzv~tzFHWkFfgdRP2xUeQocYzG4~QOKjmJSJyLKaQntCZZqk3F96HTTPmmV7GuKtGI-~71e6EPLvVF4Mhr6rvirDrjZ3hS3h801sIpRHWKNHrK7AOSnNiH2uRUfddI-Hz0dR~KRwW8MifobDwGI5sbbj-qbWmCCoeDVO-JjpN7H0lDpo6UZSGr8SgXQ__&Key-Pair-Id=APKAIE5G5CRDK6RD3PGA)
Constitutive binding of ZAP-70 to BCR kinases and ribosomal proteins. (A) PCA of protein abundance, representing the variability between anti–ZAP-70 pull-down, with or without anti-IgM stimulation for 20 minutes, and IgG isotype control. Each dot represents 1 technical replicate with an individual pull-down of ZAP-70 or IgG. (B) Heat map of proteins annotated in the Kyoto Encyclopedia of Genes and Genomes “BCR signaling pathway,” identified by mass spectrometry as ZAP-70 binding partners. Red and blue indicate relatively high and low protein abundance, respectively. Each condition analyzed depicts 3 (unstimulated) or 4 (IgM-activated) technical replicates. Proteins were ranked from left to right by Log2(FC) ratio comparing the IgM-activated group with the unstimulated group. (C) Volcano plot showing proteins bound to ZAP-70 [Log2(FC) > 0] vs IgG isotype control [Log2(FC), < 0] in unstimulated CLL cells. (D) Gene set enrichment analysis was applied to identify pathways with which ZAP-70–associated proteins are associated in unstimulated CLL cells. Pathways are listed in order of Normalized Enrichment Scores in columns (top x-axis). FDR q-values for each pathway set are indicated by the red dotted line (bottom x-axis). Colors of the columns represent different subgrouped cell functions. (E) Volcano plot showing proteins bound to ZAP-70 [Log2(FC) > 0] vs IgG isotype control [Log2(FC) < 0] in anti-IgM–activated CLL cells. (F) Gene set enrichment analysis to identify pathways associated with ZAP-70 in anti-IgM–activated CLL cells. (G) Volcano plot showing proteins differentially bound to ZAP-70 in unstimulated [Log2(FC) < 0] vs anti-IgM–activated [Log2(FC) > 0] states. (H) Gene set enrichment analysis to identify pathways associated with ZAP-70 after BCR activation with an anti-IgM.
Constitutive binding of ZAP-70 to BCR kinases and ribosomal proteins. (A) PCA of protein abundance, representing the variability between anti–ZAP-70 pull-down, with or without anti-IgM stimulation for 20 minutes, and IgG isotype control. Each dot represents 1 technical replicate with an individual pull-down of ZAP-70 or IgG. (B) Heat map of proteins annotated in the Kyoto Encyclopedia of Genes and Genomes “BCR signaling pathway,” identified by mass spectrometry as ZAP-70 binding partners. Red and blue indicate relatively high and low protein abundance, respectively. Each condition analyzed depicts 3 (unstimulated) or 4 (IgM-activated) technical replicates. Proteins were ranked from left to right by Log2(FC) ratio comparing the IgM-activated group with the unstimulated group. (C) Volcano plot showing proteins bound to ZAP-70 [Log2(FC) > 0] vs IgG isotype control [Log2(FC), < 0] in unstimulated CLL cells. (D) Gene set enrichment analysis was applied to identify pathways with which ZAP-70–associated proteins are associated in unstimulated CLL cells. Pathways are listed in order of Normalized Enrichment Scores in columns (top x-axis). FDR q-values for each pathway set are indicated by the red dotted line (bottom x-axis). Colors of the columns represent different subgrouped cell functions. (E) Volcano plot showing proteins bound to ZAP-70 [Log2(FC) > 0] vs IgG isotype control [Log2(FC) < 0] in anti-IgM–activated CLL cells. (F) Gene set enrichment analysis to identify pathways associated with ZAP-70 in anti-IgM–activated CLL cells. (G) Volcano plot showing proteins differentially bound to ZAP-70 in unstimulated [Log2(FC) < 0] vs anti-IgM–activated [Log2(FC) > 0] states. (H) Gene set enrichment analysis to identify pathways associated with ZAP-70 after BCR activation with an anti-IgM.
ZAP-70 binding to ribosomal proteins is associated with increased protein synthesis in CLL cells
Cross-reactivity of the ZAP-70 antibody remained a major concern for us to discriminate “noise” from true interacting proteins. To overcome this problem, we engineered the human Burkitt lymphoma B cell line BJAB to express FLAG-tagged full-length ZAP-70 fused to a BirA recognition peptide. BJAB cells, rather than MEC-1 cells, were chosen because they lack endogenous ZAP-70 expression (data not shown), which we considered a confounding factor in further experiments. Although BJAB cells are fundamentally different from primary CLL cells, we reasoned that the preserved dependency on BCR signals18 for cell survival would allow us to further investigate the func-tion of ZAP-70 in B cells. For this, BJAB–ZAP-70 cells were cotransfected with the Escherichia coli–derived biotin ligase BirA (BJABZAP-70 cells) to allow for in vivo biotinylation of ZAP-70.19 Control cells were infected with the same constructs lacking the ZAP-70 coding region (supplemental Figure 2A). Surface IgM expression was not changed by expressing ZAP-70 (supplemental Figure 2B). Anti-IgM treatment of BJABZAP-70 cells or BJABcontrol cells induced calcium2+ flux without significant differences evoked by ZAP-70 expression (supplemental Figure 2C). Notably, surface IgM levels were generally higher than on CLL cells (data not shown), which may contribute to the absence of differences in calcium2+ flux between ZAP-70 expresser and nonexpresser cells. To identify proteins interacting with ZAP-70 in response to BCR activation, cells were treated with anti-IgM for 20 minutes prior to cross-linking with formaldehyde and labeling with TMT-10plex. In total, we identified 3015 unique proteins in the combined analysis (FDR < 0.01). The PCA showed a clear separation of BJAB cells expressing ZAP-70 or not and between anti-IgM–treated and untreated cells (supplemental Figure 2D). Comparison of BJABcontrol cells with BJABZAP-70 cells in the absence of an induced BCR signal identified 545 unique proteins constitutively bound in ZAP-70 complexes (P < .05). Proteins known to mediate BCR signals were identified with significantly enhanced binding after anti-IgM treatment (supplemental Figure 2E). Other detected proteins clustered in cell adhesion/migration and metabolic processes (supplemental Figure 2F-G; supplemental Table 3). Importantly, nearly twice as many proteins were bound to ZAP-70 after BCR stimulation compared with unstimulated cells (supplemental Figure 2H; supplemental Table 3). The majority of these newly recruited proteins belong to ribosomes (supplemental Figure 2I). Importantly, we performed mass spectrometry on whole-cell lysates from BJABZAP-70 cells, with or without anti-IgM treatment, and did not find an enrichment of ribosomal proteins, indicating that increased binding to ZAP-70 is not related to a shift in the overall expression of those proteins (supplemental Figure 3A; supplemental Table 4).
Because primary CLL cells and BJAB cells shared substantial similarities in ZAP-70 protein complexes, we rationalized that combining mass spectrometry data obtained in CLL and BJAB cells would be an opportunity to refine our analysis by further reducing the number of nonspecifically bound proteins. For this, we subtracted unique proteins only found to be bound to ZAP-70 in BJABZAP-70 cells or in primary cells after BCR stimulation. We identified more than twice as many proteins (n = 147) interacting with ZAP-70 compared with unstimulated cells (Figure 5A; supplemental Table 5). In addition to a strong enrichment of proteins essential for BCR signaling (Figure 5B-C), a large proportion of these proteins were ribosomal proteins (Figure 5B-E). RPS-17 was one of the most enriched proteins in ZAP-70 complexes. Coimmunoprecipitation assays on additional patient samples confirmed the constitutive binding of ribosomal proteins to ZAP-70, which was further increased after BCR activation (Figure 5F-G). Importantly, we did not observe binding of Syk to ribosomal proteins, suggesting that this property of ZAP-70 is not shared with Syk (supplemental Figure 3B). Interestingly, a recent study using light-affinity purification of ZAP-70 complexes from Jurkat cells also incidentally reported binding to ribosomes in T cells (supplemental Figure 4A).20
![BCR activation induces binding of ZAP-70 to ribosomal proteins and is associated with enhanced protein biosynthesis. (A) Venn diagram comparing ZAP-70–binding proteins identified by mass spectrometry (MS) in anti-IgM–activated (20 minutes) primary CLL cells and BJAB cells [Log2(FC) > 1; adjusted P < .01]. (B) Gene set enrichment analysis GO terms extracted from the 147 unique proteins, identified in (A), from primary CLL cells and BJAB cells. GO signatures are listed in order of Normalized Enrichment Scores in columns (top x-axis). FDR q-values for each signature set are indicated by the red dotted line (bottom x-axis). Colors of the columns represent different subgrouped cell functions. (C) The 147 unique proteins from (A) were plotted by Log2(FC) (x-axis, identified in primary CLL cells by MS; y-axis, identified in BJAB cells). Colors indicate the subgrouped functions of the proteins. Gray dots indicate proteins involved in other cellular functions. (D) Heat map of ZAP-70–associated ribosomal proteins from unstimulated or anti-IgM–activated primary CLL cells (adjusted P < .05). Red and blue indicate relatively high and low protein abundance, respectively. Each row analyzed depicts a technical replicate. (E) Heat map of ZAP-70–associated ribosomal proteins from unstimulated or anti-IgM–activated BJABZAP-70 cells vs nonspecifically biotinylated proteins from BJABcontrol cells (adjusted P < .05). Red and blue indicate relatively high and low protein abundance, respectively. Each row analyzed depicts a technical replicate. (F) Whole-cell lysates from primary CLL cells, unstimulated or stimulated with anti-IgM for 20 minutes, were immunoprecipitated (IP) with a ZAP-70 antibody or control IgG and immunoblotted (IB) with antibodies for ZAP-70, Syk, and RPS17. (G) Quantification of RPS17 bound to ZAP-70. The levels of RPS17 coimmunoprecipitated with ZAP-70 were normalized to total ZAP-70 levels. Anti-IgM–treated samples were then normalized to nontreated samples (n = 4). (H) Comparison of polysome profiles between unstimulated (blue) and anti-IgM–activated (20 minutes) (red) primary CLL samples. Vertical lines separating the curves indicate the fractions primarily extracted from 40s ribosome subunits, 60s to 80s ribosome subunits, and polysomes. (I) Proteins from sucrose gradient fractions in primary CLL cells were precipitated by 20% (weight-to-volume ratio) trichloroacetic acid and immunoblotted with ZAP-70, RPL29, and RPS17. Blue boxes contain unstimulated cells; red boxes contain anti-IgM–activated cells. Fractions 6 through 19 represent 40s subunits, 60s to 80s subunits, and polysomes, separated by vertical lines. (J) Quantification of relative ZAP-70 protein levels (relative to RPL17) in indicated fractions of primary CLL samples (n = 3). Anti-IgM–activated samples were normalized to unstimulated samples. (K) Graph showing the relative (to untreated NSC) fold change in OPP labeling (30 minutes) in unstimulated or anti-IgM–activated (20 minutes) primary CLL cells (n = 11) that were previously transfected with NSC siRNA or ZAP-70 siRNA. (L) Representative MYC and β-actin immunoblots of primary CLL cells monocultured for 24 hours after transfection with nonspecific siRNA or ZAP-70 siRNA. (M) Quantification of c-MYC levels in primary CLL cells proficient or depleted of ZAP-70. Graphs were generated using ImageJ (n = 4). (N) Representative immunoblots for MYC, ZAP-70, and β-actin of primary CLL cells monocultured for 24 hours after transfection with nonspecific siRNA or ZAP-70 siRNA. To induce BCR signaling, monocultured CLL cells were treated with bead-bound anti-IgM for 24 hours. *P < .05, **P < .01.](https://ash.silverchair-cdn.com/ash/content_public/journal/blood/137/26/10.1182_blood.2020009960/8/m_bloodbld2020009960f5.png?Expires=1769133688&Signature=bx-75i-09o6PF-81MRwTkm82~kT8FCHf7Sm5d-DKcH~yRvM3dCU-LQvQKGqc0urf20xTEv6aPSZ8gX8eOpgAOctsVoSq-3lDHmKTZZc8sAIC~sHsrHQuE0MpVq~pz1vsCboXWmGaieoyfpKnlhr4NQxGw~ianxIk2wDi-r60yQD4Z6bHWcDoshxCO68G8XhwLqVB8gveV3xJnRzVQDFZCS4ej1OzjIrFR3jIXK-BhqJlA-zafiDJf3Wt4oy4Nq6SiTQozUV4g7jk4Gb29aFoQPO1qt2nIHQpYul9gK2ieryp0nr9OxeqpEhRLNlJl12smc8ZelL4OKFKdPrM7fC5KA__&Key-Pair-Id=APKAIE5G5CRDK6RD3PGA)
BCR activation induces binding of ZAP-70 to ribosomal proteins and is associated with enhanced protein biosynthesis. (A) Venn diagram comparing ZAP-70–binding proteins identified by mass spectrometry (MS) in anti-IgM–activated (20 minutes) primary CLL cells and BJAB cells [Log2(FC) > 1; adjusted P < .01]. (B) Gene set enrichment analysis GO terms extracted from the 147 unique proteins, identified in (A), from primary CLL cells and BJAB cells. GO signatures are listed in order of Normalized Enrichment Scores in columns (top x-axis). FDR q-values for each signature set are indicated by the red dotted line (bottom x-axis). Colors of the columns represent different subgrouped cell functions. (C) The 147 unique proteins from (A) were plotted by Log2(FC) (x-axis, identified in primary CLL cells by MS; y-axis, identified in BJAB cells). Colors indicate the subgrouped functions of the proteins. Gray dots indicate proteins involved in other cellular functions. (D) Heat map of ZAP-70–associated ribosomal proteins from unstimulated or anti-IgM–activated primary CLL cells (adjusted P < .05). Red and blue indicate relatively high and low protein abundance, respectively. Each row analyzed depicts a technical replicate. (E) Heat map of ZAP-70–associated ribosomal proteins from unstimulated or anti-IgM–activated BJABZAP-70 cells vs nonspecifically biotinylated proteins from BJABcontrol cells (adjusted P < .05). Red and blue indicate relatively high and low protein abundance, respectively. Each row analyzed depicts a technical replicate. (F) Whole-cell lysates from primary CLL cells, unstimulated or stimulated with anti-IgM for 20 minutes, were immunoprecipitated (IP) with a ZAP-70 antibody or control IgG and immunoblotted (IB) with antibodies for ZAP-70, Syk, and RPS17. (G) Quantification of RPS17 bound to ZAP-70. The levels of RPS17 coimmunoprecipitated with ZAP-70 were normalized to total ZAP-70 levels. Anti-IgM–treated samples were then normalized to nontreated samples (n = 4). (H) Comparison of polysome profiles between unstimulated (blue) and anti-IgM–activated (20 minutes) (red) primary CLL samples. Vertical lines separating the curves indicate the fractions primarily extracted from 40s ribosome subunits, 60s to 80s ribosome subunits, and polysomes. (I) Proteins from sucrose gradient fractions in primary CLL cells were precipitated by 20% (weight-to-volume ratio) trichloroacetic acid and immunoblotted with ZAP-70, RPL29, and RPS17. Blue boxes contain unstimulated cells; red boxes contain anti-IgM–activated cells. Fractions 6 through 19 represent 40s subunits, 60s to 80s subunits, and polysomes, separated by vertical lines. (J) Quantification of relative ZAP-70 protein levels (relative to RPL17) in indicated fractions of primary CLL samples (n = 3). Anti-IgM–activated samples were normalized to unstimulated samples. (K) Graph showing the relative (to untreated NSC) fold change in OPP labeling (30 minutes) in unstimulated or anti-IgM–activated (20 minutes) primary CLL cells (n = 11) that were previously transfected with NSC siRNA or ZAP-70 siRNA. (L) Representative MYC and β-actin immunoblots of primary CLL cells monocultured for 24 hours after transfection with nonspecific siRNA or ZAP-70 siRNA. (M) Quantification of c-MYC levels in primary CLL cells proficient or depleted of ZAP-70. Graphs were generated using ImageJ (n = 4). (N) Representative immunoblots for MYC, ZAP-70, and β-actin of primary CLL cells monocultured for 24 hours after transfection with nonspecific siRNA or ZAP-70 siRNA. To induce BCR signaling, monocultured CLL cells were treated with bead-bound anti-IgM for 24 hours. *P < .05, **P < .01.
BCR activation induces binding of ZAP-70 to ribosomal proteins and is associated with enhanced protein biosynthesis. (A) Venn diagram comparing ZAP-70–binding proteins identified by mass spectrometry (MS) in anti-IgM–activated (20 minutes) primary CLL cells and BJAB cells [Log2(FC) > 1; adjusted P < .01]. (B) Gene set enrichment analysis GO terms extracted from the 147 unique proteins, identified in (A), from primary CLL cells and BJAB cells. GO signatures are listed in order of Normalized Enrichment Scores in columns (top x-axis). FDR q-values for each signature set are indicated by the red dotted line (bottom x-axis). Colors of the columns represent different subgrouped cell functions. (C) The 147 unique proteins from (A) were plotted by Log2(FC) (x-axis, identified in primary CLL cells by MS; y-axis, identified in BJAB cells). Colors indicate the subgrouped functions of the proteins. Gray dots indicate proteins involved in other cellular functions. (D) Heat map of ZAP-70–associated ribosomal proteins from unstimulated or anti-IgM–activated primary CLL cells (adjusted P < .05). Red and blue indicate relatively high and low protein abundance, respectively. Each row analyzed depicts a technical replicate. (E) Heat map of ZAP-70–associated ribosomal proteins from unstimulated or anti-IgM–activated BJABZAP-70 cells vs nonspecifically biotinylated proteins from BJABcontrol cells (adjusted P < .05). Red and blue indicate relatively high and low protein abundance, respectively. Each row analyzed depicts a technical replicate. (F) Whole-cell lysates from primary CLL cells, unstimulated or stimulated with anti-IgM for 20 minutes, were immunoprecipitated (IP) with a ZAP-70 antibody or control IgG and immunoblotted (IB) with antibodies for ZAP-70, Syk, and RPS17. (G) Quantification of RPS17 bound to ZAP-70. The levels of RPS17 coimmunoprecipitated with ZAP-70 were normalized to total ZAP-70 levels. Anti-IgM–treated samples were then normalized to nontreated samples (n = 4). (H) Comparison of polysome profiles between unstimulated (blue) and anti-IgM–activated (20 minutes) (red) primary CLL samples. Vertical lines separating the curves indicate the fractions primarily extracted from 40s ribosome subunits, 60s to 80s ribosome subunits, and polysomes. (I) Proteins from sucrose gradient fractions in primary CLL cells were precipitated by 20% (weight-to-volume ratio) trichloroacetic acid and immunoblotted with ZAP-70, RPL29, and RPS17. Blue boxes contain unstimulated cells; red boxes contain anti-IgM–activated cells. Fractions 6 through 19 represent 40s subunits, 60s to 80s subunits, and polysomes, separated by vertical lines. (J) Quantification of relative ZAP-70 protein levels (relative to RPL17) in indicated fractions of primary CLL samples (n = 3). Anti-IgM–activated samples were normalized to unstimulated samples. (K) Graph showing the relative (to untreated NSC) fold change in OPP labeling (30 minutes) in unstimulated or anti-IgM–activated (20 minutes) primary CLL cells (n = 11) that were previously transfected with NSC siRNA or ZAP-70 siRNA. (L) Representative MYC and β-actin immunoblots of primary CLL cells monocultured for 24 hours after transfection with nonspecific siRNA or ZAP-70 siRNA. (M) Quantification of c-MYC levels in primary CLL cells proficient or depleted of ZAP-70. Graphs were generated using ImageJ (n = 4). (N) Representative immunoblots for MYC, ZAP-70, and β-actin of primary CLL cells monocultured for 24 hours after transfection with nonspecific siRNA or ZAP-70 siRNA. To induce BCR signaling, monocultured CLL cells were treated with bead-bound anti-IgM for 24 hours. *P < .05, **P < .01.
Based on these results, we hypothesized that ZAP-70 is recruited to ribosomes in response to BCR activation. To generate further evidence for this, we sought to demonstrate colocalization of ZAP-70 to ribosomal proteins by applying a method not relying on cross-linkage of proteins. For this, we performed polysome profile analysis, which uses ultracentrifugation of cell lysates over a sucrose gradient to separate different ribosome units from total cell lysates. Quantification of RNA by spectrophotometry in each of the sucrose fractions indicated that the separation of ribosomes was successful (Figure 5H). We detected few polyribosomes, possibly related to the quiescent state of cells, and altered ribosome maturation in CLL cells compared with normal B cells, as reported previously.21 Following BCR activation with anti-IgM, we observed a significant increase in ZAP-70 comigrating with the 60s to 80s ribosome fraction and, to a lesser extent, in the polyribosome fraction (Figure 5I-J).
We hypothesized that BCR-induced binding of ZAP-70 to ribosomal proteins could have effects on translation. To test this, we applied OPP to assess the total level of protein synthesis in unstimulated and in anti-IgM–activated primary cells, differing only in their expression of ZAP-70. Metabolic labeling demonstrated that protein synthesis was significantly reduced in CLL cells depleted of ZAP-70 (Figure 5K). Because many of its functions depend on kinase activity, we hypothesized that ZAP-70 mediates phosphorylation of ribosomal proteins. The hypothesis that ZAP-70 is an RBP-modifying kinase is further supported by previously published experiments in T cells. Using a modified kinase domain of ZAP-70, tyrosine modifications of 15 ribosomal proteins were observed within minutes after inhibition of ZAP-70 in activated Jurkat T cells (supplemental Figure 4B).22 The kinetics of these phosphorylation changes suggest that ZAP-70 may function as a ribosomal protein kinase, directly or indirectly, with the net effect of promoting protein biosynthesis.
A previous study has identified MYC as a target for translational regulation in CLL that is increased by BCR stimulation.23 Therefore, we tested whether ZAP-70 levels could affect MYC expression in CLL cells. Interestingly, constitutive MYC levels were significantly reduced in ZAP-70–depleted cells (Figure 5L-M). In contrast, BCR-mediated upregulation of MYC was unaffected by ZAP-70 levels, indicating again that ZAP-70 levels are critical for the regulation of biological processes in the absence of an induced BCR signal (Figure 5N; supplemental Figure 4C).
Discussion
Nearly 2 decades ago, ZAP-70 expression was identified in malignant B cells in a subset of CLL patients,4 possessing strong prognostic value for an aggressive disease course.5 Since then, several studies have demonstrated that ZAP-70 can enhance BCR signaling,8 although kinase activity was dispensable for this.6,7 This suggested that ZAP-70 acts predominantly as an adaptor protein, promoting phosphorylation of other BCR signaling components, such as Syk.6 Our data further advance our understanding of the biology of ZAP-70 in CLL by demonstrating biological functions that do not depend on a strong BCR signal. In contrast to previously published work,7 we have not observed significant ZAP-70–dependent changes in calcium flux or activation of proximal BCR kinases following receptor ligation with anti-IgM. A possible explanation for this apparent conundrum is that, in our experiments, the residual ZAP-70 activity after (an incomplete) knockdown of the protein may fully compensate. The observed moderate, but not statistically significant, decrease in PLCγ2 phosphorylation would support this idea. However, our experimental approach also differs significantly from other studies that overexpressed ZAP-70 in ZAP-70 negative IGHV-mutated CLL cells.7 Therefore, it remains possible that the described BCR signaling–enhancing effects of ZAP-70 are more prominent in intrinsically ZAP-70neg cells, predominantly harboring mutated IGHV genes5 and differing in the cell of origin.24
Regardless of these differences, which require further experimental work to clarify, we identified that ZAP-70 constitutively contributes to cell survival, protein synthesis, and gene expression in the absence of an overt strong BCR signal. The dependency of these effects on ZAP-70 varied among patients in our experiments, which is likely related to substantial variations in the baseline expression of ZAP-70 among ZAP-70 positive patients, the siRNA-mediated degree of ZAP-70 depletion, the presence of chromosomal abnormalities, and IGHV mutational status. Larger studies are needed to systematically address whether ZAP-70 has more or less pronounced affects in any of these subgroups.
The constitutive binding of ZAP-70 to BCR-signaling kinases, as well as the moderate, but statistically significant, decrease in AKT activation associated with decreased expression of ZAP-70, suggests that ZAP-70 could enhance a tonic BCR signal. The constitutive activation of phosphatidylinositol 3-kinase in CLL cells supports this idea and may contribute to the baseline activation of AKT.25 However, activation of alternative prosurvival signaling pathways must also be considered.
Our data demonstrate that the depletion of endogenous ZAP-70 negatively affected cell survival, as well as the expression of genes known to be important for the recruitment and interaction with T cells. CCL3 and CCL4 are chemokines that are able to attract CD4+ T cells, which can further induce CLL proliferation through the activation of CD40. In vivo evidence supporting this hypothesis derive from the high CCL3 plasma levels found in ZAP-70pos patients, associated with a shorter time to first treatment.26 Furthermore, increased CCL3 expression in CLL lymph nodes correlates with Ki67+ expression and the number of CD3+ T cells.27 Our data further advance these correlative findings and demonstrate that ZAP-70 actively contributes to the expression of these chemokines and suggest that ZAP-70pos cells can create a more favorable disease-promoting microenvironment in the absence of a strong BCR signal.
Another unexpected finding from our experiments was the identification of protein complexes consisting of ZAP-70 and ribosomal proteins, which are particularly enhanced upon BCR activation. This observation begs the question of its functional implications. Previous proteomic analyses have described distinct profiles in ZAP-70pos unmutated CLL and ZAP-70neg M-CLL; these differences were constitutively present, whereas BCR activation resulted in further changes in ZAP-70pos UM-CLL but not in M-CLL.28 In the context of these results, our data indicate that protein binding to ZAP-70 is modified by BCR signals and suggest that it may contribute to these differences in global protein expression through transcriptional and posttranscriptional mechanisms.
Our data are in keeping with a recent report showing that BCR signaling drives mRNA translation, in part through MYC.23 Here, we identified ZAP-70 as an enhancing factor for this. Deregulation of protein biosynthesis in CLL has also been reported by Willis and colleagues, who identified significantly reduced ribosomal maturation and activity related to reduced translation of ribosomal RNA.21 However, no ZAP-70 subtype analyses were performed dependent on ZAP-70 status. A more recent extensive proteomic characterization of CLL cells identified “RNA processing” and “RNA binding” as major discriminators between malignant and nonmalignant B cells, although these findings were not restricted to a particular subset of patients.29 Lastly, mutations in RPS15, which are found in a fraction of patients, cause alterations in translation initiation and fidelity that are associated with global protein changes.30 In conclusion, alterations in protein biosynthesis are a common finding in CLL and a result of distinct underlying mechanisms. Our data identify ZAP-70 as another factor contributing to deregulated protein synthesis. It remains unknown from our work how ZAP-70 promotes mRNA translation. Because we used double cross-linking to identify binding partners, we cannot specify which protein(s) are essential for its association with ribosomes. The possibility that ZAP-70 directly interacts with ribosomal proteins is supported by ZAP-70–associated changes in the tyrosine phosphorylation of ribosomal proteins observed in activated T cells.22 Posttranslational modifications in ribosomal proteins have been shown to modulate protein synthesis,31,32 although the precise mechanisms are poorly defined. We also consider other possibilities of ZAP-70 binding to ribosomes, such as binding to RNA or through functioning as a scaffold protein bound to newly synthesized proteins. An alternative, although not mutually exclusive, possibility is that ZAP-70 regulates protein synthesis through its effects on MYC expression, because MYC itself can promote translation through direct and indirect mechanisms.33,34
In conclusion, our data show that ZAP-70 is directly involved in the regulation of gene expression and protein synthesis, with the net effect of improved cell survival. Therefore, ZAP-70 may increase disease aggressiveness through its function as a coordinating signaling node in malignant B cells, for which a strong BCR signal is not essential.
The RNA-seq data reported in this article have been deposited in the Gene Omnibus Expression database (accession number GSE149022). Mass spectrometry proteomics data have been submitted to the ProteomeXchange Consortium via the PRIDE partner repository (data set identifier PXD019465).
Data sharing requests should be sent to Ingo Ringshausen (ir279@cam.ac.uk). Additional information can be found in supplemental Data.
The online version of this article contains a data supplement.
The publication costs of this article were defrayed in part by page charge payment. Therefore, and solely to indicate this fact, this article is hereby marked “advertisement” in accordance with 18 USC section 1734.
There is a Blood Commentary on this article in this issue.
Acknowledgments
The authors thank all patients from Addenbrooke’s outpatient clinic who provided blood samples for this research. The help of Alison Wray and Joanna Baxter to recruit patients to this study was essential for this work. The authors are very grateful for discussions with Art Weiss, who provided ZAP-70 constructs, as well as valuable feedback and suggestions for future experiments. They also thank Daniel Hodson for carefully reading the manuscript, his scientific input, and the provision of BJAB-BirA cells. They also appreciate constructive discussions about our results with Martin Turner.
This work was supported by the Kay Kendell Foundation (grant KKL1070) and by Cancer Research UK (CRUK C49940/A17480) (I.R.); I.R. is a senior Cancer Research UK fellow. A.J.W. was supported by a Specialist Programme from Blood Cancer UK (12048), the UK Medical Research Council (MR/T012412/1), the Kay Kendall Leukaemia Fund, a Wellcome strategic award to the Cambridge Institute for Medical Research (100140), a core support grant from Wellcome and MRC to the Wellcome-Medical Research Council Cambridge Stem Cell Institute, the Connor Wright Project, the Cambridge National Institute for Health Research Biomedical Research Centre, and the European Cooperation in Science and Technology Action CA18233 “European Network for Innovative Diagnosis and treatment of Chronic Neutropenias.”
Authorship
Contribution: J.C., V.S., A.M., C.A.J., and S.T. performed wet laboratory experiments, analyzed data, and created the figures; A.S. and I.M. analyzed RNA-seq data; proteomics experiments were planned in close collaboration with C.D. and analyzed by V.N.R.F. and C.S.R.C., who also provided raw data and figures; I.R. planned the study with guidance from S.B.H. and A.J.W.; and I.R. wrote the manuscript.
Conflict-of-interest disclosure: I.R. has received research funding from and acted as a consultant for AstraZeneca. The remaining authors declare no competing financial interests.
Correspondence: Ingo Ringshausen, University of Cambridge, Wellcome/MRC Cambridge Stem Cell Institute and Department of Haematology, Jeffrey Cheah Biomedical Centre, Cambridge Biomedical Campus, Puddicombe Way, CB2 0AW Cambridge, United Kingdom; e-mail: ir279@cam.ac.uk.

This feature is available to Subscribers Only
Sign In or Create an Account Close Modal