

Key Points
RS is a rare complication of CLL with dismal prognosis, as well as an area in which effective therapies are sorely needed.
WGS and RNA expression profiling of paired CLL and RS samples reveals clinically targetable genes and pathways in RS transformation.

Abstract
The transformation of chronic lymphocytic leukemia (CLL) to high-grade B-cell lymphoma is known as Richter syndrome (RS), a rare event with dismal prognosis. In this study, we conducted whole-genome sequencing (WGS) of paired circulating CLL (PB-CLL) and RS biopsies (tissue-RS) from 17 patients recruited into a clinical trial (CHOP-O). We found that tissue-RS was enriched for mutations in poor-risk CLL drivers and genes in the DNA damage response (DDR) pathway. In addition, we identified genomic aberrations not previously implicated in RS, including the protein tyrosine phosphatase receptor (PTPRD) and tumor necrosis factor receptor–associated factor 3 (TRAF3). In the noncoding genome, we discovered activation-induced cytidine deaminase–related and unrelated kataegis in tissue-RS affecting regulatory regions of key immune-regulatory genes. These include BTG2, CXCR4, NFATC1, PAX5, NOTCH-1, SLC44A5, FCRL3, SELL, TNIP2, and TRIM13. Furthermore, differences between the global mutation signatures of pairs of PB-CLL and tissue-RS samples implicate DDR as the dominant mechanism driving transformation. Pathway-based clonal deconvolution analysis showed that genes in the MAPK and DDR pathways demonstrate high clonal-expansion probability. Direct comparison of nodal-CLL and tissue-RS pairs from an independent cohort confirmed differential expression of the same pathways by RNA expression profiling. Our integrated analysis of WGS and RNA expression data significantly extends previous targeted approaches, which were limited by the lack of germline samples, and it facilitates the identification of novel genomic correlates implicated in RS transformation, which could be targeted therapeutically. Our results inform the future selection of investigative agents for a UK clinical platform study. This trial was registered at www.clinicaltrials.gov as #NCT03899337.
Introduction
The transformation of chronic lymphocytic leukemia (CLL) into aggressive non-Hodgkin lymphoma called Richter syndrome (RS) occurs in 2% to 15% of CLL patients.1-6 RS is rare (0.17 RS patients per 100 000 individuals).7
Standard-of-care therapy with cyclophosphamide, doxorubicin, vincristine, prednisolone, and rituximab (CHOP-R) results in overall survival of 5.9 to 11.4 months.3,5,8 Although small molecule inhibitors (SMIs) targeting the B-cell receptor (BCR) pathway and BCL29-11 have significantly improved outcome for CLL patients, RS causes SMI failure.4,11-14 SMIs and their combinations3,8,15 are under investigation.
RS shares histological characteristics of diffuse large B-cell lymphoma (DLBCL), but its molecular profile is distinct. 90% of RS shares molecular lesions with the founding CLL-related clone, with mutations in TP53 (60% to 80%), CDKN2A (30%), MYC (30%), NOTCH1 (30%), or MGA (7%).3,16-20 RS patients typify intrapatient tumor heterogeneity. The most comprehensive study so far, used whole-exome sequencing (WES) and genome array to identify novel RS drivers in 9 CLL and RS pairs.17 As germline samples were lacking, only genes mutated in both CLL and RS were called.3,8,15
Our prospective multicenter phase 2 study (CHOP-O) for DLBCL-type RS using CHOP with ofatumumab followed by ofatumumab maintenance provides paired PB-CLL and tissue-RS samples for integrative whole-genome sequencing (WGS).21 PB-CLL represents the mutational profile of the founding CLL whereas tissue-RS captures the genomic complexity of transformed RS. We analyzed coding and noncoding single-nucleotide variants (SNVs), small insertions or deletions (InDels), and copy-number aberrations (CNAs), combined with RNA expression profiling (RNA-EP) to interrogate genes and pathways involved in transformation. Our results revealed novel putative transformation drivers as targetable candidates for further clinical evaluation.
Subjects and methods
Sample acquisition
PB-CLL, tissue-RS (formalin-fixed paraffin-embedded blocks [FFPE]), and germline (salivary) triplet samples were available from 17 CHOP-O21 participants (Table 1; supplemental Table 1 [available on the Blood Web site]). Ethics approval was obtained from the National Research Ethics Service Committee South Central–Oxford A (REC reference number 10/H0604/85), and the work was performed in accordance with the Declaration of Helsinki.
Clinical characteristics of the CHOP-O (n = 17) and independent cohorts (n = 12) at the time of inclusion
| Clinical characteristics | CHOP-O cohort, n = 17 | Lund cohort, n = 12 |
|---|---|---|
| n, mean (range; SD), or N (%) | n, mean (range; SD), or N (%) | |
| Age, y | ||
| n = | 14/17 | 12/12 |
| Mean (range; SD) | 65.0 (48.4-86.8; 12.5) | 66.6 (49.0-79.0; 9.1) |
| <60 | 4 (28.6) | 3 (25.0) |
| >60 | 10 (71.4) | 9 (75.0) |
| Sex | ||
| n = | 14/17 | 12/12 |
| Female | 4 (28.6) | 3 (25.0) |
| Male | 10 (71.4) | 9 (75.0) |
| ECOG performance status | ||
| n = | 14/17 | 12/12 |
| 0 | 8 (57.1) | 3 (25.0) |
| 1 | 3 (21.4) | 6 (50.0) |
| 2 | 1 (7.1) | 3 (25.0) |
| 3 | 2 (14.3) | 0 (0) |
| Rai stage | ||
| n = | 14/17 | 12/12 |
| Rai 0 | 4 (28.6) | 1 (8.3) |
| Rai I | 4 (28.6) | 1 (8.3) |
| Rai II | 4 (28.6) | 3 (25.0) |
| Rai III | 1 (7.1) | 0 (0) |
| Rai IV | 1 (7.1) | 7 (58.3) |
| Binet stage | ||
| n = | 14/17 | 12/12 |
| Binet A | 4 (28.6) | 4 (33.3) |
| Binet B | 7 (50.0) | 1 (8.3) |
| Binet C | 3 (21.4) | 7 (58.3) |
| Ann Arbor stage | ||
| n = | 13/17 | 12/12 |
| Ann Arbor I | 1 (7.7) | 0 (0) |
| Ann Arbor II | 3 (23.1) | 2 (16.7) |
| Ann Arbor III | 6 (46.2) | 2 (16.7) |
| Ann Arbor IV | 3 (23.1) | 8 (66.7) |
| IPI score | ||
| n = | 13/17 | 12/12 |
| 1 | 5 (38.5) | 1 (8.3) |
| 2 | 2 (15.4) | 2 (16.7) |
| 3 | 4 (30.8) | 4 (33.3) |
| 4 | 2 (15.4) | 5 (41.7) |
| Previous treatment | ||
| n = | 16/17 | 12/12 |
| 0 | 4 (25.0) | 5 (41.7) |
| 1 | 8 (50.0) | 1 (8.3) |
| >1 | 4 (25.0) | 6 (50.0) |
| Type of previous treatment | ||
| n = | 16/17 | 12/12 |
| FC | 4 (25) | 3 (25.0) |
| FCR | 6 (37.5) | 3 (25.0) |
| Alemtuzumab ± high-dose steroid | 2 (12.5) | 6 (50.0) |
| Chlorambucil ± rituximab | 1 (6.3) | 1 (8.3) |
| Rituximab | 2 (12.5) | 0 (0) |
| Other | 2 (12.5) | 8 (66.7) |
| B symptoms | ||
| n = | 14/17 | 12/12 |
| Yes | 11 (78.6) | 10 (83.3) |
| No. of extranodal sites | ||
| n = | 17/17 | 12/12 |
| 0 | 8 (47.1) | 4 (33.3) |
| 1 | 7 (41.2) | 8 (66.7) |
| >1 | 2 (11.8) | 0 (0) |
| Bulk in lymph node > 5 cm | ||
| n = | 14/17 | 12/12 |
| Yes | 6 (42.9) | 6 (50.0) |
| IgHV mutation status | ||
| Unmutated | 10 | 0 (0) |
| Mutated | 4 | 0 (0) |
| Failed or Not done | 3, Failed | 12 (100), Not done |
| LDH | ||
| n = | 14/17 | 12/12 |
| >1× ULN | 8 (57.1) | 5 (41.7) |
| >1.5× ULN | 3 (21.4) | 6 (50.0) |
| β2-microglobulin > ULN | ||
| n = | 12/17 | 1/12 |
| N (%) | 4 (33.3) | 1 (8.3) |
| TP53 disruption detected in clinical trial | ||
| n = | 17/17 | |
| N (%) | 8 (47.1) | |
| TP53 disruption detected in clinical setting: FISH | ||
| n = | 7/12 | |
| N (%) | 3 (42.8) | |
| MYC expression ≥20% | ||
| n = | 12/17 | 12/12 |
| N (%) | 6 (50.0) | Not done |
| EBV expression in tumor | ||
| n = | 16/17 | |
| N (%) | 1 (6.3) | |
| EBV expression in tumor: IHC | ||
| n = | 1/12 | |
| pos IHC | 0 (0) | |
| EBV screening by DNA in plasma or IgM serology | ||
| n = | 10/12 | |
| pos plasma EBV DNA or IgM serology | 1 (10) | |
| ABC type cell of origin | ||
| n = | 14/17 | 12/12 |
| N (%) | 14 (100) | Not done |
n = number of assessed subjects; N = number of assessed subjects within each group.
ABC, activated B-cells; EBV, Epstein-Barr virus; ECOG, Eastern Cooperative Oncology Group; FC, fludarabine, cyclophosphamide; FCR, fludarabine, cyclophosphamide, rituximab; FISH, fluorescence in situ hybridization; IHC, immunohistochemistry; IgHV, immunoglobulin heavy chain; IPI, International Prognostic Index; LDH, lactate dehydrogenase; SD, standard deviation; ULN, upper limit of normal.
An independent cohort of 12 paired nodal-CLL and tissue-RS samples (Table 1) from the Department of Pathology, Skåne University Hospital, Lund University, Sweden underwent RNA-EP (ethics approval: Southern Sweden, reference number 2016/1054) (Figure 1). See supplemental Methods for nucleic acids purification.
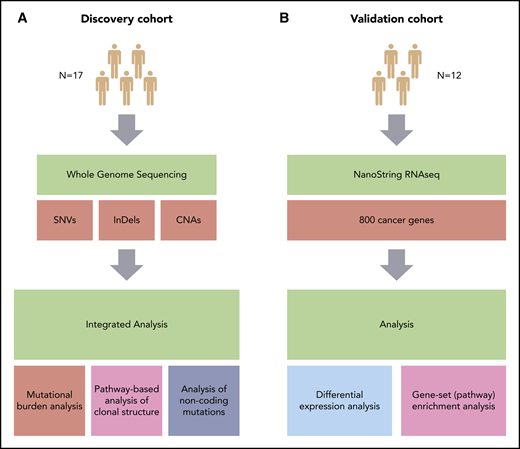
Overview of the study. (A) Discovery cohort (CHOP-O study). Paired PB-CLL (FF) and RS (FFPE) samples. (B) Validation cohort (patients with RS). Paired nodal CLL (FFPE) and RS (FFPE) samples. SNVs, InDels, and CNAs were identified in pairs of peripheral blood CLL (PB-CLL) and Richter diagnostic biopsies (tissue-RS) (from 17 CHOP-O patients)21 using whole-genome sequencing. Based on these data, we conducted integrated analysis of mutational burden, analysis of clonal structure, and analysis of noncoding mutations. We validated our findings through differential gene expression and gene-set enrichment analysis on transcriptomic data from an independent cohort of 12 subjects with RS.
Overview of the study. (A) Discovery cohort (CHOP-O study). Paired PB-CLL (FF) and RS (FFPE) samples. (B) Validation cohort (patients with RS). Paired nodal CLL (FFPE) and RS (FFPE) samples. SNVs, InDels, and CNAs were identified in pairs of peripheral blood CLL (PB-CLL) and Richter diagnostic biopsies (tissue-RS) (from 17 CHOP-O patients)21 using whole-genome sequencing. Based on these data, we conducted integrated analysis of mutational burden, analysis of clonal structure, and analysis of noncoding mutations. We validated our findings through differential gene expression and gene-set enrichment analysis on transcriptomic data from an independent cohort of 12 subjects with RS.
Whole-genome sequencing
FFPE DNA was treated with the FFPE DNA Restoration kit (Illumina) prior to WGS library preparation using the Early Access FFPE-extracted gDNA Library kit (Illumina). The TruSeq DNA HT Sample Prep Kit (PCR-free) or TruSeq Nano DNA LT Library Prep Kit (with PCR amplification) were used according to the manufacturer’s protocol for PB-CLL and germline library preparation depending on DNA quantity (Illumina).
Libraries were subjected to paired-end sequencing (2× 100 bp on HiSeq 2500 or 2× 150 bp on a HiSeq 4000 instrument; Illumina) to a mean depth of 87× for PB-CLL (range, 34× to 129×), 88× for tissue-RS (range, 42× to 132×), and 44× for germline (range, 25× to 67×) samples.
Digital-multiplexed gene-expression profiling
The NanoString PanCancer Pathways Panel (NanoString Technologies) interrogated gene expression differences between nodal-CLL and tissue-RS, examining 800 genes representing 14 canonical cancer (supplemental Table 2). Quality controls, hybridization, purification and data analysis were performed following NanoString protocols and software tools (supplemental Methods).
Bioinformatics
Variant calling
Raw reads from each triplet of germline, PB-CLL and tissue-RS were aligned against the human reference genome (GRCh37) using Illumina’s WGS workflow v4.0. Somatic SNVs and InDels were called for each germline:PB-CLL and germline:tissue-RS dyad using Illumina’s Tumor-Normal workflow v1.1.0. Variants were annotated using Ensembl’s Variant Annotation Predictor v90, including functional predictions from SIFT and PolyPhen. To minimize potential FFPE artifacts, only somatic variants with PASS filter, read depth DP ≥ 10 and VAF ≥ 10% were retained. Only variants predicted to have HIGH impact by VEP, or which were flagged as deleterious by SIFT or probably damaging by PolyPhen were retained. We applied the same filters to PB-CLL data. We chose a genomic region presumptively unaffected by RS driver mutations (the nonrearranged T-cell receptor [C,V,J] gene locus) as an internal filtering control. CNAs were manually curated and analyses performed as described in.22
Noncoding analysis
CLL promotor and enhancer regions were determined by intersecting ATAC-seq ± 500 bp peaks from CLL, with CHROMHMM predicted promotor and enhancer regions from CLL and other leukocytes, both from23 (supplemental Methods). Mutations from activation-induced cytidine deaminase (AID) and APOBEC activity were determined by counting SNVs in WRCY (C>T/G) and TCW (C>T/G) motifs. Significantly mutated hotspots (kataegis) in promotor/enhancer regions were determined in 2 ways: (a) using SeqKat, which identifies regions of significant somatic hypermutation compared with the background rate, and (b) according to,24 identifying sites with at least 6 mutations within 2 standard deviations of the mean chromosomal intermutational distance. Kataegis were identified within individual patients and across samples pooled by source of DNA (PB-CLL or tissue-RS). Significance was determined using a binomial model (supplemental Methods). Mutation signatures were derived using the R/Bioconductor package MutationalPatterns.25 Mutational profiles were compared with COSMIC mutation signatures v3.126 (supplemental Table 3).
Statistical analysis
Statistical analyses were conducted and visualized using R v3.5.1.27 For comparing groups of mutations or genes, we used the nonparametric 2-sided Wilcoxon signed-rank test with continuity correction. Additionally, we applied a 2-sided paired Student t test after Blom-transforming the data to approximate normality. In all cases, the results from both tests were concordant.
Clonal deconvolution
We examined clonal structure using previously published methodology.28-30 Briefly, we used a Bayesian nonparametric clustering methodology to integrate sample purity, multiplicity, local copy number and VAF of each somatic variant, and estimate cancer cell fractions (CCFs). Variants with median CCF > 0.85 were considered clonal, whereas those with median CCF <0.85 were considered subclonal.31 Somatic variants demonstrating an increase in CCF from PB-CLL to tissue-RS larger than 0.1 with high (>95%) probability were indicative of clonal expansion. Variants with CCF decrease of equal magnitude and confidence were considered evidence of clonal contraction.31 All other somatic variants were considered clonally stable (supplemental Methods).
Differential expression and pathway enrichment analysis
We performed differential gene expression analysis between 12 independent paired samples. All genes had ≥ 5 reads per million. We used RUVseq v1.18.032 for data normalization and removal of unwanted variation, followed by differential expression analysis using DESeq2 v1.24.0.33 Finally, we conducted gene-set enrichment analysis as described in.34 We corrected for multiple hypothesis testing in both analyses using an optimized false discovery rate.35
Results
Detection of genetic variants in the CHOP-O discovery cohort
Germline, PB-CLL and tissue-RS samples from 17 CHOP-O participants21 underwent WGS (Figure 1). Clinical characteristics are presented in Table 1 and supplemental Figure 1.
No disruptive somatic variants were detected in PB-CLL or tissue-RS samples across the nonrearranged T-cell receptor after filtering, demonstrating the efficacy of our strategy (supplemental Figure 1). After filtering, the tissue-RS mutational burden remained high for 3 patients (CH1003, CH1009, and CH1019), which were removed from further analysis (Figure 2A).
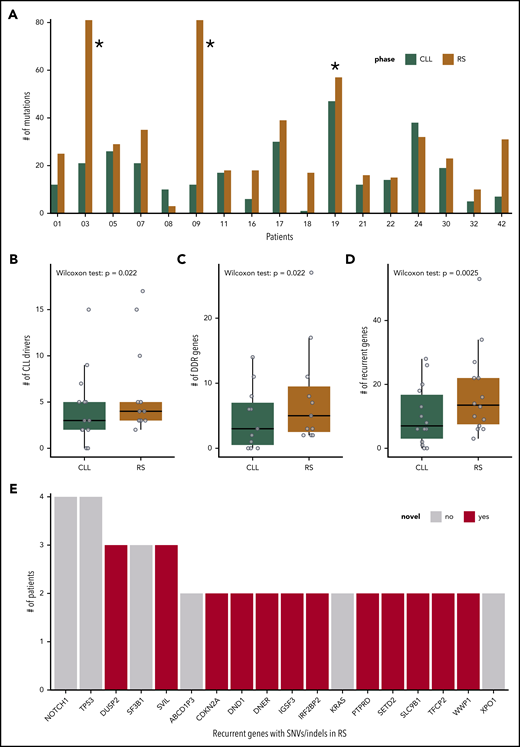
SNVs, InDels, and CNAs in the cohort of 17 patients with R. (A) Number of SNVs and InDels in the PB-CLL versus the tissue-RS in each of the 17 patients. CH1003, CH1009 and CH1019 (indicated with asterisk) appear as outliers due to an increased mutational burden and were excluded from downstream analysis. (B-D) Number of genes per sample harboring a SNV/InDel or CNA in the PB-CLL compared with the tissue-RS. Three groups of genes are illustrated: CLL drivers (B), DDR (C), and recurrent (D) genes. Statistics are as follows: (B) 2-sided Wilcoxon signed-rank test with continuity correction (P = .022; Δm = 2.5; 95% CI, 1.5-5.0); 2-sided paired Student t test after applying a Blom transformation (P = .010; Δm = 0.46; 95% CI, 0.13-0.80); (C) 2-sided Wilcoxon signed-rank test with continuity correction (P = .022; Δm = 3.0; 95% CI, 1.5-12.0); 2-sided paired Student t test after applying a Blom transformation (P = .018; Δm = 0.56; 95% CI, 0.12-1.00); (D) 2-sided Wilcoxon signed-rank test with continuity correction (P = .0025; Δm = 5.5; 95% CI, 2.5-12.5); 2-sided paired Student t test after applying a Blom transformation (P = .0030; Δm = 0.64; 95% CI, 0.26-1.00). (E) Recurrent genes carrying a SNV or InDel in at least 2 RS patients. Genes not previously implicated in the transformation to RS are in red.
SNVs, InDels, and CNAs in the cohort of 17 patients with R. (A) Number of SNVs and InDels in the PB-CLL versus the tissue-RS in each of the 17 patients. CH1003, CH1009 and CH1019 (indicated with asterisk) appear as outliers due to an increased mutational burden and were excluded from downstream analysis. (B-D) Number of genes per sample harboring a SNV/InDel or CNA in the PB-CLL compared with the tissue-RS. Three groups of genes are illustrated: CLL drivers (B), DDR (C), and recurrent (D) genes. Statistics are as follows: (B) 2-sided Wilcoxon signed-rank test with continuity correction (P = .022; Δm = 2.5; 95% CI, 1.5-5.0); 2-sided paired Student t test after applying a Blom transformation (P = .010; Δm = 0.46; 95% CI, 0.13-0.80); (C) 2-sided Wilcoxon signed-rank test with continuity correction (P = .022; Δm = 3.0; 95% CI, 1.5-12.0); 2-sided paired Student t test after applying a Blom transformation (P = .018; Δm = 0.56; 95% CI, 0.12-1.00); (D) 2-sided Wilcoxon signed-rank test with continuity correction (P = .0025; Δm = 5.5; 95% CI, 2.5-12.5); 2-sided paired Student t test after applying a Blom transformation (P = .0030; Δm = 0.64; 95% CI, 0.26-1.00). (E) Recurrent genes carrying a SNV or InDel in at least 2 RS patients. Genes not previously implicated in the transformation to RS are in red.
Overall, 529 somatic deleterious variants remained in PB-CLL (n = 218 unique variants) and tissue-RS (n = 311 unique variants) (supplemental Tables 4 and 5). Mean read depths over the alternate alleles were 76× (±32) and 62× (±39) in PB-CLL and tissue-RS, respectively. Mean VAFs were 0.30 (±0.14; range, 0.10-0.85) and 0.30 (±0.16; range, 0.10-0.88) in PB-CLL and tissue-RS, respectively. Significantly more SNVs and InDels were detected in tissue-RS (22.2 ± 10.2 variants per sample) compared with PB-CLL (15.6 ± 10.4 variants per sample) (supplemental Figure 2A). No specific type of mutation was associated with tissue-RS, whereas missense mutations were most common (supplemental Figure 2B).
CNAs associated with RS (del17p, amp8q, and trisomy12) were found to be recurrent (ie, occurring in 2 or more samples) (supplemental Figure 2C).
Tissue-RS analysis
Integrated analysis of all acquired SNVs/InDels and CNAs showed 44 known CLL drivers,31 more commonly mutated in tissue-RS compared with CLL31 (Figure 2B).
Because RS is frequently chemorefractory, we also interrogated 65 DNA damage response (DDR) genes (supplemental Table 2). Aberrant DDR gene numbers (SNV/InDel or CNA) were significantly higher in tissue-RS compared with PB-CLL (Figure 2C).
Next, we performed a genome-wide discovery analysis of all recurrently mutated genes in tissue-RS using stringent filters (which also included subtraction of paired germline variants; Methods) to identify novel recurrent SNVs/indels in 18 genes including DUSP2, SVIL, CDKN2A, DND1, DNER, IGSF3, and others (supplemental Table 6; Figure 2E).
For integration with copy number analysis, we selected genes that (a) harbored an SNV/InDel in ≥ 2 tissue-RS samples or (b) harbored an SNV/InDel or CNA ≥2 tissue-RS samples and constituted any of 46 cancer pathways or CLL drivers or DDR genes (supplemental Table 2). We confirmed mutations were tumor-derived (not artifactual) using the paired PB-CLL. Seventy-nine genes were recurrently affected by SNVs/InDels or CNAs in the tissue-RS (supplemental Table 7; Figures 2D and 3). Acquired aberrations occurred more frequently in tissue-RS than PB-CLL (Figure 2D). Twenty of 44 CLL drivers (Figure 3 in red) and 24 of 65 DDR genes (Figure 3 in orange) were recurrently mutated in tissue-RS. Based on KEGG and other pathway definitions (supplemental Table 2), the remaining 35 genes (Figure 3 in black) are implicated in cancer pathogenesis (CDKN2A, KMT2C, KMT2D, RB1, SETD2, SMARCA4, TET2), cell cycle and apoptosis (RB1, CDKN2A, CDK2), transcriptional regulation (ETV1, SIN3A), and various signaling pathways, including PI3K (CDK2, COL27A1, IL7, LAMC3, RELN), MAPK (DUSP2, DUSP5, GNA12, CACNA1D, CACNA1E), calcium (BDKRB1, RYR3, CACNA1D, CACNA1E) and P53 (CDKN2A, CDK2).
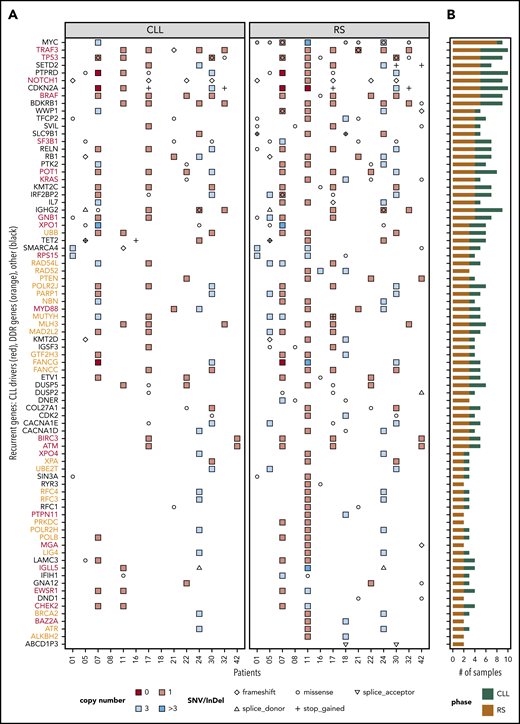
Distribution of SNVs, InDels, and CNAs across patients and samples. Genes that were recurrent in the tissue-RS (A) and total number of mutated samples per recurrent gene and by DNA source (B). Recurrent genes were those harboring (1) an SNV/InDel in ≥ 2 tissue-RS samples or (2) an SNV/InDel or CNA ≥2 tissue-RS samples and constituted any of 46 cancer pathways or CLL drivers or DDR genes. Red gene labels in panel A indicate CLL drivers and orange labels indicate DDR genes. Gray dots indicate cases with MYC overexpression in the tissue-RS.
Distribution of SNVs, InDels, and CNAs across patients and samples. Genes that were recurrent in the tissue-RS (A) and total number of mutated samples per recurrent gene and by DNA source (B). Recurrent genes were those harboring (1) an SNV/InDel in ≥ 2 tissue-RS samples or (2) an SNV/InDel or CNA ≥2 tissue-RS samples and constituted any of 46 cancer pathways or CLL drivers or DDR genes. Red gene labels in panel A indicate CLL drivers and orange labels indicate DDR genes. Gray dots indicate cases with MYC overexpression in the tissue-RS.
We compared our discovery findings (Figure 3) with published CLL WES, WGS and array studies to elucidate the potential significance to RS pathogenesis. We also measured gene expression in paired samples. RNA expression data from 770 cancer genes was available for 8 of 14 RS patients. We used expression data from nodal-CLL from our independent cohort as a control (supplemental Figure 3; supplemental Table 8).
Established CLL or RS drivers
Recurrent MYC aberrations including t(8;14) translocations, MYC amplifications and missense mutations correlated with MYC overexpression in over half of our patients (Figure 3). Recurrent del9p21 copy-number losses affecting the CDKN2A locus were identified. Two cases show homozygous loss and 2 monoallelic stop-gains, concurring with other studies. Both homozygous loss and stop gain were associated with CDKN2A RNA underexpression (supplemental Figure 3). We also observed losses and missense mutations in the PTPRD gene, colocated with CDKN2A. Patient CH1007 carried homozygous deletions of both genes (Figure 3).
Mutations in known genomic markers of poor-risk CLL such as TP53, XPO1, NOTCH1, SF3B1, BIRC3, ATM, and RPS15 and members of MAPK-RAS-ERK pathway (BRAF, KRAS) were recurrent in the tissue-RS3,16,17,36 further validating our approach.
Recurrent mutations in genes infrequently mutated in CLL
TRAF3, which regulates signaling pathways including Toll-like receptor signaling, NF-κB, and mitogen-activated protein kinase pathways, was frequently affected by heterozygous deletions. One patient (CH1021) had a coexisting deletion and frameshift mutation (Figure 3). TRAF3 deficiency enhances survival of B-cells and increases transformation risk via upregulation of PIM3 and c-MYC expression.37 However, our RS gene-expression data suggest TRAF3 overexpression despite deleterious genomic events (supplemental Figure 3), meriting further investigation.
SETD2 deletions and SNVs affect <5% of CLL and associate with poor risk disease.38 SETD2 aberrations, primarily heterozygous deletions and recurrent stop-gain mutations, occur in ∼30% of our RS.
Mutations in three rare CLL drivers were exclusive to tissue-RS:PTPN11, a positive regulator of the MAPK-RAS-ERK signaling pathway39,40 was amplified and consistently overexpressed; MGA, a MYC functional repressor mutually exclusive to MYC aberrations in RS; and BAZ2A, which is regulated by the microRNAs MIR15a/16-141 that are commonly deleted in CLL.
Candidate genes previously not known to be mutated in CLL or RS and predominantly mutated in the tissue-RS (defined as mutated in ≥2 of 14 tissue-RS, but in 0 or 1 PB-CLL and not previously described to be mutated in RS or CLL)
WW domain-containing ubiquitin E3 ligase 1 (WWP1) was affected by combined loss and missense mutations in the tissue-RS and an amplification of the locus in the PB-CLL (CH1007). Two patients (CH1001, CH1021) with mutations in the transcription factor CP2 (TFCP2) had clonal mutations with high CCF. Another patient (CH1001) had 2 distinct TFCP2 mutations. Three patients had acquired missense mutations in Supervilin (SVIL). Solute carrier family 9 member B1 (SLC9B1, encoding a Na+/H+ exchanger) was affected by either copy number losses or bi-allelic deleterious missense and stop gain mutations. Finally, the interleukin-7 (Il-7) locus was also affected by copy number changes in tissue-RS with Il-7 expression downregulated compared with nodal-CLL. In-depth functional experiments are needed to clarify the significance of these findings.
Other genes not previously implicated in CLL or RS
These were the interferon regulatory factor-2 (IRF2) binding protein (IRF2BP2) that interacts with the C-terminal transcriptional repression domain of IRF2,42 and the genes TET methylcytosine dioxygenase 2 (TET2) and mutY DNA glycosylase (MUTYH). MUTYH is involved in oxidative DDR and base excision repair. We also observed homozygous loss of the Fanconi Anemia gene FANCG that has a well-established role in DDR. Expression data were available for 1 patient with homozygous loss of FANCG showing reduced RNA levels compared with CLL (supplemental Figure 3). Finally, dead end protein homolog 1 (DND1) was aberrant in 2 patients, 1 of whom (CH1042) carried 3 subclonal missense mutations. DND1 encodes a protein that inhibits microRNA-mediated repression.
A large number of additional, novel, recurrently and nonrecurrently mutated genes were affected by monoallelic chromosomal losses, gains and deleterious missense mutations making a prediction of their functional impact more difficult. In fact, most of the genes associated with DDR fell into this category. To address this, we pursued 3 different approaches: (a) analysis of clonal evolution from CLL to RS, including pathway-based analysis; (b) investigation of the transcriptome and confirmation of the pathways identified in (a); (c) patient-specific comparison between DNA mutations and RNA expression.
Clonal evolution from CLL to RS
We hypothesized clones carrying recurrent gene alterations would preferentially expand, implying a survival advantage. We investigated clonal evolution patterns between PB-CLL and tissue-RS pairs. All our RS cohort carried related IgHV rearrangements in the paired PB-CLL, implying a shared cell-of-origin (supplemental Table 9). Among 529 somatic variants (supplemental Table 4), we clustered (“Methods”) and estimated CCF for all autosomal variants (n = 507, 95.8%; supplemental Table 5). In 10 of 14 (71.4%) patients, we observed clonal tissue-RS mutations, which were subclonal (n = 40 variants, eg, CH1021), clonal (n = 48 variants; eg, CH1001) or absent in PB-CLL (n = 27 variants; eg, CH1018) (Figure 4). We observed clonal expansion, contraction or stability in the transition from CLL to RS in all patients, leading to either a predominantly linear (eg, CH1016) or branching (eg, CH1005) pattern of clonal evolution (Figure 4).
![Transitions in the values of CCFs of somatic mutations during transformation from CLL to RS in each CHOP-O patient. We observe clonal expansions (ie, cancer cell fractions [CCF] values increase from PB-CLL to tissue-RS), clonal contractions (ie, CCF values decrease from PB-CLL to tissue-RS) or clonal stability (ie, CCF values remain roughly the same between PB-CLL and tissue-RS). Each gray line indicates the transition of a single SNV/InDel from PB-CLL to tissue-RS. If a variant is absent in 1 phase, no transition line is shown.](https://ash.silverchair-cdn.com/ash/content_public/journal/blood/137/20/10.1182_blood.2020005650/1/m_bloodbld2020005650f4.png?Expires=1767896079&Signature=fAy~2lv~63Ps21e9lWr8gxwJMSLwd83qPwA0NG0hYioqCIIiVp98eo0YUpbdYhOK5kJYUnhYZW-b6JJ0040H8kByGcHtfghSbac1OOBVbdugYv0DGVhu29Z9C7k2P77Rjff1L6LJmVaIvjGGjKB3wHghc~UqzoY05jpc75vK8jPCSM~qZMf6vTM7KLyyKeL-r3kCRVAnpyOg6YANUqo-O8RiqGGxgCVmTVEH3vFtcRi4efJL2COnNvGkzR6jhWJHJJjmjQAUjY6DwLSYx9nfgYKbMhC4Ak9PrL30g4aUZLV3psvf7gSngp00deHFdbrEOYGezLM~aGEcqNDBdhrg~A__&Key-Pair-Id=APKAIE5G5CRDK6RD3PGA)
Transitions in the values of CCFs of somatic mutations during transformation from CLL to RS in each CHOP-O patient. We observe clonal expansions (ie, cancer cell fractions [CCF] values increase from PB-CLL to tissue-RS), clonal contractions (ie, CCF values decrease from PB-CLL to tissue-RS) or clonal stability (ie, CCF values remain roughly the same between PB-CLL and tissue-RS). Each gray line indicates the transition of a single SNV/InDel from PB-CLL to tissue-RS. If a variant is absent in 1 phase, no transition line is shown.
Transitions in the values of CCFs of somatic mutations during transformation from CLL to RS in each CHOP-O patient. We observe clonal expansions (ie, cancer cell fractions [CCF] values increase from PB-CLL to tissue-RS), clonal contractions (ie, CCF values decrease from PB-CLL to tissue-RS) or clonal stability (ie, CCF values remain roughly the same between PB-CLL and tissue-RS). Each gray line indicates the transition of a single SNV/InDel from PB-CLL to tissue-RS. If a variant is absent in 1 phase, no transition line is shown.
We performed a pathway-based analysis of these clonal transitions to identify further clonal evolution patterns. Our analysis demonstrated a higher probability of clonal expansion than contraction in mutated DDR genes and genes in the MAPK signaling pathway (Figure 5A; FDR<1%). MAPK genes harboring clonally expanding mutations were TP53 (n = 3), DUSP2 (n = 2), BRAF, KRAS, GNA12, CACNA1D and CACNA1H (n = 1 each; Figure 5B). DDR genes harboring clonally expanding mutations were TP53 (n = 3), MUTYH and RPS27A (n = 1 each; Figure 5B).
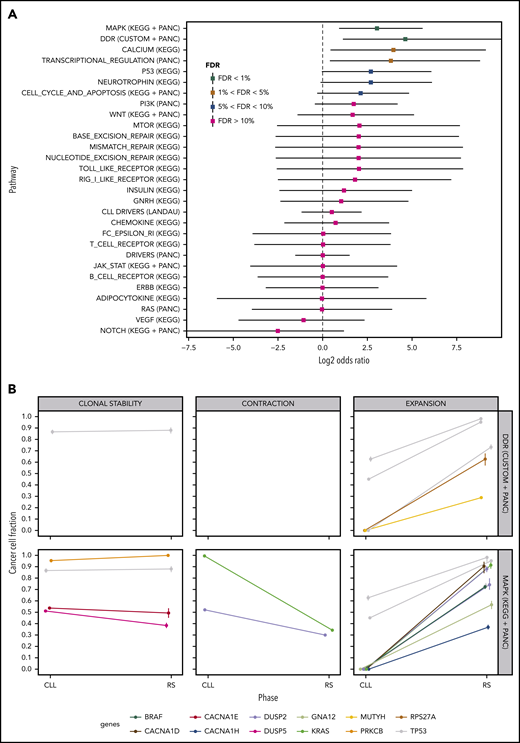
Pathway-based clonal analysis. (A) For each pathway, we give the mean and 95% credible intervals of the ratio (P1(1 − P2)) / ((1 − P1) P2) (in log2 scale), where P1 is the probability given the data that the pathway harbors a mutation that clonally expands (ie, its CCF shows a significant increase) in the transition from PB-CLL to tissue-RS. Similarly, P2 is the probability given the data that the pathway harbors a mutation that clonally contracts in the transition to RS. Pathways with FDR < 5%, are highly likely to harbor clonally expanding (rather than contracting) mutations during transformation to RS. (B) Clonal transition events in the gene sets with FDR < 1%, that is, DDR genes and the MAPK-signaling pathway. Each line corresponds to a single SNV or InDel. The color encodes the gene harboring the corresponding mutation (shown at the bottom of the graph).
Pathway-based clonal analysis. (A) For each pathway, we give the mean and 95% credible intervals of the ratio (P1(1 − P2)) / ((1 − P1) P2) (in log2 scale), where P1 is the probability given the data that the pathway harbors a mutation that clonally expands (ie, its CCF shows a significant increase) in the transition from PB-CLL to tissue-RS. Similarly, P2 is the probability given the data that the pathway harbors a mutation that clonally contracts in the transition to RS. Pathways with FDR < 5%, are highly likely to harbor clonally expanding (rather than contracting) mutations during transformation to RS. (B) Clonal transition events in the gene sets with FDR < 1%, that is, DDR genes and the MAPK-signaling pathway. Each line corresponds to a single SNV or InDel. The color encodes the gene harboring the corresponding mutation (shown at the bottom of the graph).
Investigation of the transcriptome: confirmation of pathways
For functionally validating our findings, we examined whether genomic aberrations in the pathways seen during the clonal analysis (DDR, MAPK; Figure 5) were mirrored by gene expression changes. We performed RNA-EP on an independent cohort of 12 nodal-CLL and tissue-RS pairs using the NanoString PanCancer Pathways Panel (PANC) (supplemental Table 2).
We found 127 differentially expressed genes at FDR<1%. Seventy-two were downregulated and 55 were upregulated in tissue-RS compared with nodal-CLL (Figure 6A; supplemental Table 10). Pathway enrichment analysis demonstrates that DDR genes, containing clonally expanding mutations, are significantly upregulated during transformation, along with other DDR gene sets from KEGG (base excision repair, nucleotide excision repair and mismatch repair pathways; FDR <1%; Figure 6B). We observed 34 differentially expressed MAPK genes (FDR <5%; supplemental Table 11), which did not all demonstrate a consistent direction of regulation. Nineteen MAPK genes were upregulated. The remaining 15 genes were downregulated.

Differential expression and enrichment analysis. (A) Volcano plot indicating upregulated and downregulated genes in tissue-RS compared with the PB-CLL. A positive/negative change in expression indicates upregulation/downregulation. Red dots indicate significantly upregulated or downregulated genes at FDR < 1%. (B) Summary of the pathway enrichment analysis. For each pathway, we give the average change in gene expression and 95% confidence intervals. Positive/negative average values indicate a concerted upregulation/downregulation of genes in the pathway upon transformation. FDR values of <5% indicate that the average change in expression is significant.
Differential expression and enrichment analysis. (A) Volcano plot indicating upregulated and downregulated genes in tissue-RS compared with the PB-CLL. A positive/negative change in expression indicates upregulation/downregulation. Red dots indicate significantly upregulated or downregulated genes at FDR < 1%. (B) Summary of the pathway enrichment analysis. For each pathway, we give the average change in gene expression and 95% confidence intervals. Positive/negative average values indicate a concerted upregulation/downregulation of genes in the pathway upon transformation. FDR values of <5% indicate that the average change in expression is significant.
Comparison between DNA mutation and RNA expression data
There was no clear correlation between paired genetic and expression data, reflecting the principle that molecular mechanisms behind gene dysregulation are often indirect (supplemental Figure 3; supplemental Table 8). With respect to signaling pathways, KRAS was predominantly overexpressed. BRAF was underexpressed compared with CLL and affected by deletions. The most consistent findings in the DDR pathway were overexpression of PARP and FANCG and downregulation of RAD52, POLRJ2, BRCA2, and ATR. These findings did not directly correlate with mutations in these genes, but together with mutations in other DDR genes suggest a dominant role for DDR in RS.
Noncoding variants
We checked each patient for kataegis in promotor/enhancer regions (Figure 7A). All tissue-RS carried 1 or more kataegis. In 6 patients, kataegis was absent in paired PB-CLL. Only CH1017 had an additional kataegis region in the PB-CLL (n = 7) compared with tissue-RS (n = 6), suggesting loss of a subclone (Figure 7A). Eleven kataegis occurred in 2 or more patients, with the majority found within immunoglobulin loci (supplemental Table 12).
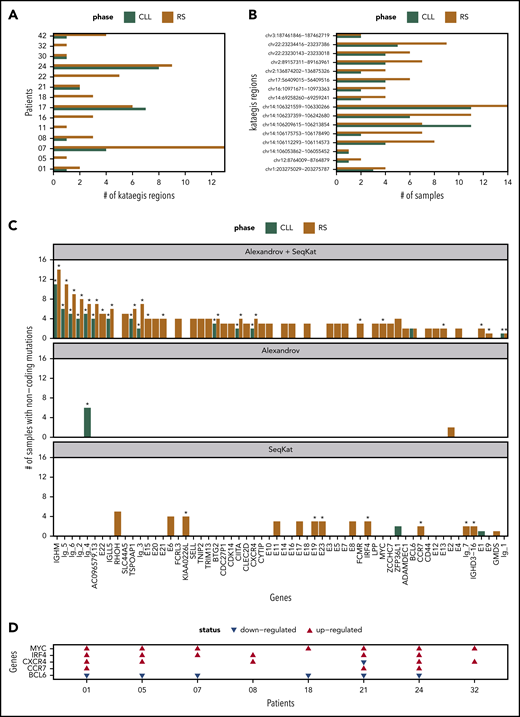
Summary of kataegis regions identified through analysis of promotor/enhancer regions. (A) Total kataegis per sample, where Kataegis were independently derived per sample. (B) Number of samples with mutations within the kataegis region when considering the pooled Kataegis in either the CLL or RS phase data. (C) Genes linked to Kataegis regions by proximity (promotors) or TAD data (enhancers). The remaining genes are divided into Ig-1:Ig-6 for immunoglobulin genes and E1:E22 for unknown enhancers. The corresponding number of samples mutated in each Kataegis are listed. An asterisk (*) indicates that >20% of mutations were at AID sites (see supplemental Methods). (D) Patient-specific regulation of gene expression in 5 of the genes in panel C in 8 patients for which we had RNA expression data. A red/blue triangle indicates upregulation/downregulation in the RS phase, when compared with CLL. No triangle means equivalent expression between the 2 phases.
Summary of kataegis regions identified through analysis of promotor/enhancer regions. (A) Total kataegis per sample, where Kataegis were independently derived per sample. (B) Number of samples with mutations within the kataegis region when considering the pooled Kataegis in either the CLL or RS phase data. (C) Genes linked to Kataegis regions by proximity (promotors) or TAD data (enhancers). The remaining genes are divided into Ig-1:Ig-6 for immunoglobulin genes and E1:E22 for unknown enhancers. The corresponding number of samples mutated in each Kataegis are listed. An asterisk (*) indicates that >20% of mutations were at AID sites (see supplemental Methods). (D) Patient-specific regulation of gene expression in 5 of the genes in panel C in 8 patients for which we had RNA expression data. A red/blue triangle indicates upregulation/downregulation in the RS phase, when compared with CLL. No triangle means equivalent expression between the 2 phases.
Next, we created PB-CLL and tissue-RS pools using all postfiltering promotor/enhancer data. Using both SeqKat and the Alexandrov method, we identified 17 significant PB-CLL and 60 tissue-RS kataegis (supplemental Table 13). All PB-CLL kataegis coexisted in the paired tissue-RS (Figure 7B).
Kataegis were annotated based on their proximity (promotors) to genes or available TAD data (enhancers). Four AID-linked kataegis regions (comprising >20% AID-linked mutations) at sites linked to BTG2, CXCR4 or “unknown enhancers” upstream of NFATC1 (E13) and within the intron of PAX5 (E22) were previously described in CLL, but never in RS (supplemental Table 13; Figure 7C; supplemental Figure 4A). Gene expression data for CXCR4 demonstrated upregulation in RS compared with CLL (Figure 7D; supplemental Table 14). One patient carried the known NOTCH1 3′UTR splice site mutation in both PB-CLL and tissue-RS (data not shown).20,43 Together, these findings validate our approach.
Forty-five pooled kataegis were unique to tissue-RS. Three tissue-RS carried mutations in the MYC promotor, implying dysregulation of MYC as alternative mechanism for MYC overexpression in RS (supplemental Table 13; Figure 7C-D).
The locus most commonly affected by non-AID kataegis and exclusive to tissue-RS could be linked to the promoter of Solute carrier family 44 member 5 (SLC44A5), a gene expressed in memory B cells and solid tumors (Figure 7C). Other noncoding loci involved in immune function and affected by non-AID kataegis within tissue-RS and not described before were FCRL3, SELL, TNIP2 and TRIM13. Overall, tissue-RS harbored significantly more promotor/enhancer SNVs than PB-CLL (supplemental Figure 4B). Functional studies including correlation with gene expression will be required to define the significance of these findings in RS.
The contribution of COSMIC single-base substitution mutation signatures v3.1 (supplemental Table 3) to PB-CLL and tissue-RS genomes were calculated by patient and group (supplemental Figures 4C and 8; also supplemental Figures 5-7). Although both PB-CLL and tissue-RS share many signatures, signatures 9 and 85 (aberrant AID activity and indirect effects of AID, respectively), signature 5 (clock-like signature) and signature 41 (unknown) are restricted to PB-CLL (supplemental Tables 3 and 15; supplemental Figures 4C and 8). In contrast, the relative contribution of signature 37 (mechanism unknown) to tissue-RS mutational profiles is over 300 times that of PB-CLL. Signature 37 is found in B-cell non-Hodgkin lymphoma.26 Signatures generating larger numbers of somatic mutations, termed “hypermutators” (signature 10b; polymerase ε exonuclease domain mutations), and signatures associated with chemotherapy treatment (signature 25) and defective DNA mismatch repair (signature 44) were exclusive to tissue-RS. Together, this suggests the dominant mechanism driving transformation may be linked to previous DNA damage and impaired mismatch repair, not aberrant AID activity.
Discussion
High-grade transformation of CLL remains an area of unmet clinical need with dismal prognosis. RS rarity and aggressiveness hampers clinical trial design. Suitable in vitro models informing rational drug design are lacking. RS molecular profile is highly heterogeneous3,16,17,20 making genomic analysis challenging.
Our integrative WGS analysis of coding and noncoding SNVs, InDels, and CNAs of PB-CLL and tissue-RS pairs and the validation using RNA-EP of an independent cohort enabled interrogation of specific genes and pathways, tracking RS evolution. Our combined analysis significantly extends previous targeted approaches,2,3,17 which were characterized by the absence of germline samples, a focus of CNVs and a small number of coding SNVs, and reveals a number of novel findings:
Some genes rarely affected by exonic aberrations in treatment-naive CLL31 (TRAF3, SETD2,38,44,45 PTPRD) are recurrently mutated in RS, suggesting a pathogenic role.
PTPRD, a tumor suppressor gene colocated with CDK2NA is silenced in many cancers via promotor hypermethylation. PTPRD was commonly deleted in our cohort. Mutations occur in marginal zone lymphoma, but rarely in early CLL20,46 and DLBCL.47,48 PTPRD and CDKN2A aberrations cooccur in solid tumors, leading to STAT3 pathways deregulation.49 A potential therapeutic role of demethylation agents or STAT3 inhibitors remains to be established.
We observed both deletions, inactivating mutations and downregulation of the signaling protein tumor (TRAF3) in RS. TRAF3 exhibits multiple functions including Toll-like receptor signaling, targeting proteins for ubiquitin degradation and as a negative regulator of MAPK and noncanonical NF-κB pathways.50 TRAF3 deletions lead to NF-κB-inducing kinase (NIK) overexpression. NIK inhibitors are entering clinical development.51 TRAF3 has been shown to have key functions in normal and malignant B-cell development via regulation of the NF-κB pathway, c-MYC, or interaction with EBV latent membrane protein.37,52-55
Compared with the paired PB-CLL, tissue-RS is characterized by increased mutational burden affecting the protein-coding regions of large numbers of cancer genes previously unrecorded in CLL (BDKRB1, WWP1, TFCP2, SVIL, SLC9B1, RELN, PTK2, IRF2BP2, IL7, many relating to DDR). Their precise role in pathogenesis requires further delineation in functional studies.
This mutational burden contributes to kataegis in noncoding genomic regions. Using a combination of CHROMHMM, ATAC-seq and linkage-based annotations from primary CLL, we were able to identify kataegis regions in tissue-RS linked to CXCR4 and MYC. Acquired mutations in coding regions of these genes are found in other lymphomas.56,57 CXCR4 mutations in lymphoplasmacytic lymphoma confer primary resistance to ibrutinib.58 Antibodies against CXCR4 suppress lymphoma progression in vitro59,60 and are undergoing clinical evaluation.
Promoter and enhancer regions of other genes expressed in B-cells and with known immune regulatory function and/or involvement in B-cell malignancies (SLC44A5,61,62 FCRL3,63-66 SELL, TNIP2,67,68 TRIM1369,70,71(p13)) were also affected by kataegis.
Clones containing mutations in genes within the MAPK-RAS-ERK and DDR pathways are more likely to expand than contract during transformation from CLL to the RS suggesting survival advantages.
Mutations in MAPK pathway genes are reported in 8% of CLL, accumulating in poor-prognosis cases.31,72 NOTCH1 signaling, Toll-like receptor signaling, and DDR pathway aberrations occur frequently in multiply relapsed and TP53 disrupted CLL.73 In this study, 15 patients developed RS during follow-up. Treatment of primary CLL cells in vitro with MEK inhibitors resulted in induction of apoptosis, suggesting potential anti-tumor activity.72,74 MEK and MAPK pathway inhibition remains unstudied in RS.
Using digital RNA profiling in an independent validation of the pathway findings, we demonstrate DDR pathway genes are not only mutated but also differentially regulated in tissue-RS compared with PB-CLL. Previous WGS of relapsed/refractory CLL showed enrichment for TP53, ATM, SF3B1, and NOTCH1 aberrations.75 Combination of TP53, ATM, CDKN2A/B losses and MYC gains, converging on pathways related to DDR, apoptosis or cell cycle control were identified using SNP arrays in circulating CLL from a multiply relapsed high-risk CLL cohort.73 Previous analysis of pathways using CNA analysis in RS identified cell cycle deregulation and trisomy 12.16 In addition, our results show a significant proportion of mutation signatures relate to DDR in tissue-RS phase, but not the paired PB-CLL phase. These data strongly suggest that the DDR pathway represents a rational target for drug development. Existing DDR inhibitors such as PARP or ATR inhibitors are untested in RS. Ongoing trials examine combinations of BTK and ATR inhibition in high-risk CLL.
In conclusion, our study identifies multiple potential therapeutic targets meriting clinical evaluation. A UK phase 2 adaptive platform RS trial, the STELLAR study (NCT03899337) investigating SMIs and their combinations, is open to recruitment.76
All data relevant to this paper are provided in the supplemental material.
The online version of this article contains a data supplement.
The publication costs of this article were defrayed in part by page charge payment. Therefore, and solely to indicate this fact, this article is hereby marked “advertisement” in accordance with 18 USC section 1734.
Acknowledgments
The authors acknowledge the contribution of the Oxford Centre for Histopathology Research and the Oxford Radcliffe Biobank.
The Oxford Centre for Histopathology Research and the Oxford Radcliffe Biobank were supported by the National Institute for Health Research (NIHR) Oxford Biomedical Research Centre (BRC). J.K. was supported by research grants from the Tegger Foundation, the Gunnar Nilsson Cancer Foundation, Blodsjukas förening i Södra sjukvårdsregionen, Stiftelsen Siv-Inger och Per-Erik Anderssons minnesfond, the Royal Swedish Academy, and the Swedish Medical Association. This study was partly funded by the NIHR Oxford BRC. This publication presents independent research commissioned by the Health Innovation Challenge Fund (R6-388 / WT 100127), a parallel funding partnership between the Wellcome Trust and the Department of Health. This research was supported by the Wellcome Trust Core Award (203141/Z/16/Z).
The views expressed in this publication are those of the authors and not necessarily those of the funders.
Authorship
Contribution: J.K., T.A.E., and M.C. contributed clinicopathological data; J.K., N.A., B.S., and H.D. performed sequencing experiments; J.K. wrote initial manuscript draft; K.R. performed bioinformatics analysis of noncoding mutation data and drafted a relevant section of the paper; P.R., L.L.P., N.A., and N.P. assisted with bioinformatics analyses; S.J.L.K. analyzed CNV data; M.E., J.I.M.-S., E.C., R.M., and D.R. contributed clinicopathological data and assisted in clinical interpretation of results; J.C.T. and A.S. designed the study, interpreted results, and wrote the paper; D.V.V. contributed to study design, performed bioinformatics and statistical analyses, interpreted results, and wrote the paper; and all authors read and approved the final version of the paper.
Conflict-of-interest disclosure: A.S. received honoraria from Gilead, Janssen, Roche, and AbbVie, and received nonrestricted educational grants from Gilead and Janssen. T.A.E. received honoraria from Roche, Janssen, AbbVie, Gilead, and AstraZeneca, and received travel fees to scientific conferences from Takeda. N.A. received speaker fees from Gilead. The remaining authors declare no competing financial interests.
A complete list of the members of the OxClinWGS consortium appears in the supplemental Appendix (supplemental File 1).
Correspondence: Dimitrios V. Vavoulis, Department of Oncology, University of Oxford, ORCRB, Roosevelt Dr, Oxford, OX3 7DQ, United Kingdom; e-mail: dimitris.vavoulis@oncology.ox.ac.uk; and Anna Schuh, Department of Oncology, University of Oxford, ORCRB, Roosevelt Dr, Oxford, OX3 7DQ, United Kingdom; e-mail: anna.schuh@oncology.ox.ac.uk.
