

Key Points
Variability in warfarin anticoagulation is generally blamed on food and drug interactions but not on the monitoring test.
Replacing PT-INR warfarin monitoring with Fiix-PT stabilized anticoagulation and was associated with a 56% reduction in TEs.

Abstract
During warfarin management, variability in prothrombin time-based international normalized ratio (PT-INR) is caused, in part, by clinically inconsequential fluctuations in factor VII (FVII). The new factor II and X (Fiix)-prothrombin time (Fiix-PT) and Fiix-normalized ratio (Fiix-NR), unlike PT-INR, are only affected by reduced FII and FX. We assessed the incidence of thromboembolism (TE) and major bleeding (MB) in all 2667 patients on maintenance-phase warfarin managed at our anticoagulation management service during 30 months; 12 months prior to and 18 months after replacing PT-INR monitoring with Fiix-NR monitoring. Months 13 to 18 were predefined as transitional months. Using 2-segmented regression, a breakpoint in the monthly incidence of TE became evident 6 months after test replacement, that was followed by a 56% reduction in incidence (from 2.82% to 1.23% per patient-year; P = .019). Three-segmented regression did not find any significant trend in TE incidence (slope, +0.03) prior to test replacement; however, during months 13 to 18 and 19 to 30, the incidence of TE decreased gradually (slope, −0.12; R2 = 0.20; P = .007). The incidence of MB (2.79% per patient-year) did not differ. Incidence comparison during the 12-month Fiix and PT periods confirmed a statistically significant reduction (55-62%) in TE. Fiix monitoring reduced testing, dose adjustments, and normalized ratio variability and prolonged testing intervals and time in range. We conclude that ignoring FVII during Fiix-NR monitoring in real-world practice stabilizes the anticoagulant effect of warfarin and associates with a major reduction in TEs without increasing bleeding.
Introduction
A major problem during the use of vitamin K antagonists (VKAs), such as warfarin, is their variable effect, as measured using the prothrombin time–based international normalized ratio (PT-INR). The PT-INR is traditionally assumed to reflect the biological VKA effect, with its variability primarily ascribed to food and drug interactions. The variability necessitates frequent laboratory monitoring and dose adjustments. However, it is possible that part of the anticoagulation variability measured by PT-INR is due to an inherent flaw in the measured effect. Reduced factor VII (FVII) affects the prothrombin time (PT) equally to similarly reduced FII or FX.1 However, experimental evidence suggests that the antithrombotic effect of warfarin is caused by reductions in FII and FX and that reductions in FVII and FIX play a small role.2,3 FVII has a very short half-life of 4 to 6 hours and may vary widely in the short term, causing marked PT-INR fluctuations, whereas FII and FX, with their much longer half-lives and their important antithrombotic effect, remain relatively unaffected.1 So why monitor vulnerable patients using a test that is highly influenced by irrelevant fluctuations in FVII that confound assessment of the true antithrombotic effect of warfarin and cause alarm and dose changes when not needed?
Based on these considerations, we invented a modified PT test, called factor II and X (Fiix)-prothrombin time (Fiix-PT; pronounced “fix-PT”), that is affected by reduced FII or FX but not FVII.1,3 In a small randomized double-blind clinical trial,4 we found that, in warfarin-treated patients monitored with a Fiix-normalized ratio (Fiix-NR) calculated based on the Fiix-PT (Fiix-warfarin patients), thromboembolic events occurred at 48% of the rate observed in well-managed traditional PT-monitored control patients (PT-warfarin patients, statistically noninferior reduction). The efficacy improvement was 50% and was statistically superior if the first 6 months of Fiix monitoring, which can be considered a lag time, were excluded. There also were reduced anticoagulation variability and fewer dose adjustments.5 Furthermore, these major trials are the initial pharmaceutical company–initiated DOAC trials in atrial fibrillation (AF)6-9 using meta-analytic methods, Fiix-warfarin was also more effective than PT-warfarin in those trials.10
Because of the favorable outcome of Fiix-warfarin in the Fiix trial, with the approval of the appropriate official bodies in Iceland, we replaced all PT monitoring with Fiix monitoring on 1 July 2016 at our anticoagulation management service (AMS). Simultaneously, we decided to evaluate the effect of the replacement in practice, hypothesizing that the replacement of PT-INR monitoring with Fiix-NR monitoring in real-world situations would confirm the Fiix trial findings of stabilized anticoagulation and reduced TE.
Methods
Study outline and approvals
This is a before and after historical single-cohort study using an interrupted time series method of analysis conducted at the AMS at The National University Hospital of Iceland (Landspitali), the only acute care hospital in the Reykjavik area. After completion of our Fiix trial on 28 February 2014, all warfarin patients were monitored with Owren’s type PT-INR until 1 July 2016, when the laboratory method was changed to Fiix-PT. Patients were switched to the new method when they came for their next monitoring test, most within 8 weeks. The current study assessed clinical outcome and anticoagulation parameters in all patients 18 years and older on maintenance-dose warfarin monitored at our AMS from 1 July 2015 until 31 December 2017. The study was approved by the Landspitali Health Research Ethics Committee (#25/2017) and the Landspitali medical director, and a waiver was received from The Data Protection Authority of Iceland. Information was obtained from the centralized Icelandic Directorate of Health Prescription Medicines Register with approval from the National Bioethics Committee (VSNb2020090032/03.0l). The study was conducted in compliance with the Declaration of Helsinki.
Patient population, warfarin dosing, study periods, and clinical event adjudication
A dynamic cohort of 2667 patients, who were on maintenance-phase warfarin (>60 days from initiation of warfarin) at some time during the 30-month period, was included, irrespective of indication, anticoagulation target range, or planned treatment length. The expected effect size was a 50% long-term reduction in TE, as had been found during the Fiix trial, a blinded trial that randomized 1156 patients into 2 arms observed for a median of 1.7 years. Using www.ClinCalc.com, we calculated that, to identify a 50% reduction in TE during 1 year with 80% power, ≥1122 patients would need to be studied both during the PT-INR monitoring and Fiix-NR monitoring. No patient was lost to follow-up. The AMS clinical staff did not change during the study (4 experienced nurses and 2 hematologists), and they dosed patients using the DAWN anticoagulation software version 7.9.41 algorithm (4-S Ltd, Penrith, United Kingdom) during the entire study period. Software-suggested dose changes are rarely overridden (∼5% of the time). All anticoagulation data and clinical information are recorded continuously in the DAWN record. From 1 July 2015 to 30 June 2016, patients were monitored with the traditional Owren’s type PT-INR (12-month PT period) that had been used since 1 March 2014 when the Fiix trial was completed. During the subsequent 18 months, from 1 July 2016 to 31 December 2017, the laboratory used the new Fiix-NR instead. Based on the prior Fiix trial observation that a 6-month lag time occurred before clinical improvement was observed, we predefined the first 6 months of Fiix-NR monitoring as being a transition (lag) period. The following 12 months (months 19-30) made up the 12-month Fiix period. In 2 subgroup analyses (unpaired and paired), we included only long-term patients that had taken warfarin for >360 days when entering each study period. A third subgroup analysis included only AF patients. The maximum recommended monitoring interval was 8 weeks, although noncompliant patients were not excluded from clinical event analysis.
The electronic AMS records and hospital charts at our institution were reviewed for all major vascular events and fatalities during the study period. We electronically searched the 10th Revision of the International Statistical Classification of Diseases and Related Health Problems discharge codes indicating thromboembolism (TE; cerebral infarction, transient cerebral ischemic attack [TIA], peripheral arterial embolism, myocardial infarction, venous TE [VTE; deep vein thrombosis or pulmonary embolism]) and bleeding; see supplement Table 3 for a full list of the codes (available on the Blood Web site). Two reviewers examined patient charts for confirmation of all events; however, because of the sequential dates giving away the monitoring period, they could not be blinded. Composite end points included stroke and systemic embolism (SSE; any thrombotic or hemorrhagic cerebrovascular event or systemic embolism excluding myocardial infarction), cerebral ischemic events (infarction or TIA), composite major bleeding (MB) by International Society on Thrombosis and Haemostasis criteria,11 and total intracranial hemorrhage (ICH). Deaths were classified as vascular or nonvascular, and any unknown cause of death was classified as nonvascular.
The primary analysis was based on all major vascular events while on warfarin (ie, TE or MB by International Society on Thrombosis and Haemostasis criteria)11 or within 5 days after discontinuing warfarin. Patients were not censored from the cohort if they remained on warfarin after suffering a nonfatal event. All deaths during known warfarin therapy or within 5 days after the last monitoring test were included. Events occurring during temporary discontinuation of anticoagulation treatment (eg, in relation to surgery) were excluded if >5 days after cessation of warfarin or <5 days after resuming warfarin.
Coagulation testing
PT and Fiix-PT tests were measured on citrated venous blood samples, as previously described, using an automated STA-R Evolution coagulation analyzer (Diagnostica Stago, Asnieres, France).1,4 In short, PT (Owren’s type; aka prothrombin-proconvertin time) was measured by adding STA-SPA+ combined thromboplastin and adsorbed plasma reagent with ISI 1.32 (Diagnostica Stago) to prediluted patient plasma. Owren’s PT is affected by reduced FII, FVII, or FX but not by fibrinogen or FV; for the purpose of warfarin monitoring, the calculated international normalized ratio (INR) is identical to Quick PT–based INR measured in the same samples.12 Fiix-PT was measured by adding Neoplastine CI Plus with ISI 1.01 (Diagnostica Stago) to prediluted patient plasma with mixed in FII- and FX-deficient plasma that corrects for low FI, FV, and FVII.1,4 Fiix-PT is only affected by reduced FII or FX. For normalized ratio calculations, the thromboplastins for PT-INR and Fiix-NR were locally calibrated using Danish Institute for External Quality Assurance in Health Care (Glostrup, Denmark) standards, traceable to the World Health Organization primary PT-INR standards, as described elsewhere.13
Statistical analysis
We used GraphPad Prism version 8.3 statistical and graphical software (GraphPad Software, San Diego, CA). We used the SegReg online program (https://www.waterlog.info/segreg.htm) for 2-segmented regression and assessment of incidence change over time and STATA program version 13.1 (StataCorp LP, College Station, TX) for 3-segmented regression. The annual incidence of vascular events per 100 patient-years (% ppy) was calculated using total patient observation years in each defined period as the denominator. We compared the median incidence of vascular events at monthly intervals during the 3 defined periods using the Kruskal-Wallis test with Dunn’s post test. Segmented linear regression was also used to compare the incidence of events at monthly intervals.14-16 The χ2 test with Yates correction was used to compare categorical clinical data, with results shown as relative risk (RR) with 95% confidence intervals (CIs). In a secondary paired analysis, to reduce the possible influence of interindividual variability in a gradually shrinking warfarin population, McNemar’s test was used to compare events in concordant and discordant pairs using www.statology.org. Anticoagulation variability parameters, calculated in patients who had ≥3 monitoring tests during a study period and after excluding noncompliant patients who had >90 days between tests, were compared using the Mann-Whitney U test when comparing 2 periods (or using the Kruskal-Wallis test when 3 periods were compared). The exclusions were used to reduce skewing of calculations caused by noncompliant patients. The variability parameters included annual test frequency, testing interval, and dose adjustment frequency and interval. The Rosendaal formula was used to calculate percent time within target range (TTR), and the normalized ratio variability between tests was calculated using the variance growth rate (VGR) B2 formula.17,18 P values <.05 were considered statistically significant.
Results
Patients
Study population
The total cohort consisted of 2667 patients on maintenance-phase warfarin who were treated during at least part of the study period (Figure 1). During the PT period, 2363 patients were monitored for 2003 observation years (0.85 years per patient), during the transition period, 1885 patients were monitored for 873 observation years (0.46 years per patient), and during the Fiix period, 1796 patients were observed for 1544 observation years (0.86 years per patient). The gradual shrinking of the warfarin population during the study period is explained in Figure 1 and was primarily due to discontinuation of anticoagulation, as well as replacement of warfarin with DOAC drugs while new warfarin referrals were simultaneously decreasing. Patient characteristics evaluated on entrance into the PT period or the Fiix period, as well as of those still on warfarin at the end of the Fiix period were similar (Table 1). During the PT period/Fiix period, the median age was 76 (interquartile range [IQR], 66-83)/76 (range, 67-84) years, and 60/61% were males. Demographics of patients who continued vs discontinued warfarin did not differ between the periods, with the exception that discontinuing patients were older (median age, 77 years vs 75 years; supplemental Table 2B). The median time on warfarin prior to the beginning of the PT and Fiix periods was 5.7 and 7.0 years, respectively. Most patients had been monitored continuously with Owren’s PT for 16 months or with Fiix-PT for up to 6 months on entering the PT period or Fiix period, respectively. The main indications were AF (57/55%), VTE (26/27%), and prosthetic heart valves (6/6%). The normalized ratio target range was 2.0 to 3.0 in 90/90%, 2.5 to 3.5 in 6/7%, and 1.5 to 2.5 in 2/3%.
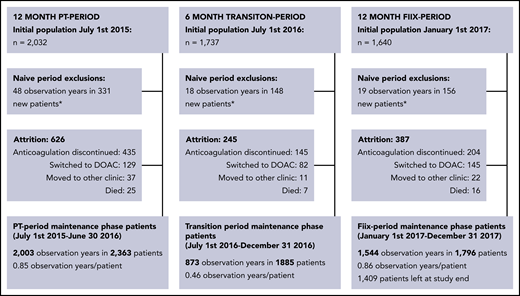
Maintenance-phase population derivation (short-term and long-term warfarin-treated patients are included). *Warfarin-naive patients are transferred to the maintenance-phase population after being on warfarin for >60 days.
Maintenance-phase population derivation (short-term and long-term warfarin-treated patients are included). *Warfarin-naive patients are transferred to the maintenance-phase population after being on warfarin for >60 days.
Patient characteristics on entrance into the PT period or Fiix period and at the end of the study
| PT period (12 mo) | Fiix period (12 mo) | Active patients at end of study | |
|---|---|---|---|
| Patients | 2363 (100) | 1796 (100) | 1409 (100) |
| Age at beginning of period, median (IQR), y | 76 (66-83) | 76 (67-84) | 76 (68-84) |
| Males | 1418 (60) | 1092 (61) | 865 (61) |
| White | >99% | >99% | >99% |
| Years of warfarin treatment, median (IQR) | 5.7 (2.3-10.8) | 7.0 (3.1-12.2) | NA |
| Intended treatment <6 mo | 76 (3) | 42 (2) | NA |
| Normalized ratio target range | |||
| 2-3 | 2166 (92) | 1616 (90) | 1265 (90) |
| 2.5-3.5 | 146 (6) | 123 (7) | 102 (7) |
| 1.5-2.5 | 53 (2) | 56 (3) | 42 (3) |
| Main indication for warfarin | |||
| AF, all | 1353 (57) | 993 (55) | 807 (57) |
| Prior cerebral infarction | 276 (20) | 191 (19) | 158 (20) |
| CHA2DS2-VASC score, median (IQR) | 3 (2-4) | 3 (2-4) | 3 (2-4) |
| Ischemic heart disease | 51 (2) | 39 (2) | 33 (2) |
| Congestive heart failure | 13 (1) | 9 (1) | 8 (1) |
| Atrial septal defect | 5 (<0.5) | 2 (<0.5) | 2 (<0.5) |
| Prosthetic heart valve | 132 (6) | 116 (6) | 100 (7) |
| Valvular heart disease | 17 (1) | 10 (1) | 8 (1) |
| Cerebral TE or TIA (without AF) | 133 (6) | 105 (6) | 82 (6) |
| Peripheral arterial TE | 16 (1) | 15 (1) | 8 (1) |
| VTE | 612 (26) | 481 (27) | 343 (24) |
| Deep vein thrombosis | 286 (12) | 235 (13) | 158 (11) |
| Pulmonary embolism | 326 (14) | 246 (14) | 185 (13) |
| Other indication | 33 (1) | 26 (1) | 18 (1) |
| Associated conditions | |||
| Hypertension | 664 (28) | 514 (29) | 406 (29) |
| Ischemic heart disease | 455 (19) | 335 (19) | 253 (18) |
| Other atherosclerosis | 108 (5) | 80 (4) | 61 (4) |
| Congestive heart failure | 529 (22) | 408 (23) | 334 (24) |
| Diabetes | 210 (9) | 165 (9) | 132 (9) |
| History of cancer | 302 (13) | 243 (14) | 201 (14) |
| Renal failure | 177 (7) | 148 (8) | 119 (8) |
| Prior cerebral infarction or TIA | 507 (21) | 351 (20) | 282 (20) |
| Cerebral infarction | 356 (15) | 243 (14) | 203 (14) |
| TIA | 151 (6) | 108 (6) | 79 (6) |
Unless otherwise indicated, data are shown as n (%). Percentages may not total 100% owing to the presence of >1 indication in some patients or rounding of numbers.
CHA2DS2-VASC score, congestive heart failure, hypertension, age ≥75 years, diabetes mellitus, prior stroke or TIA or thromboembolism, vascular disease; NA, not applicable.
Incidence of TE and MB over time (periodical and interrupted time series analysis)
The median monthly incidence of TEs (% ppy; Figure 2A-B) was lower during the Fiix period (1.45%) than during the PT period (2.60%; P = .0377); it was also lower than during the transition period (3.15%; P = .0314), but the latter did not differ from the PT period (P = .6491). The median incidence of MB during the Fiix period (2.30%) was not significantly reduced compared with the PT period (2.70%; P = .2505).
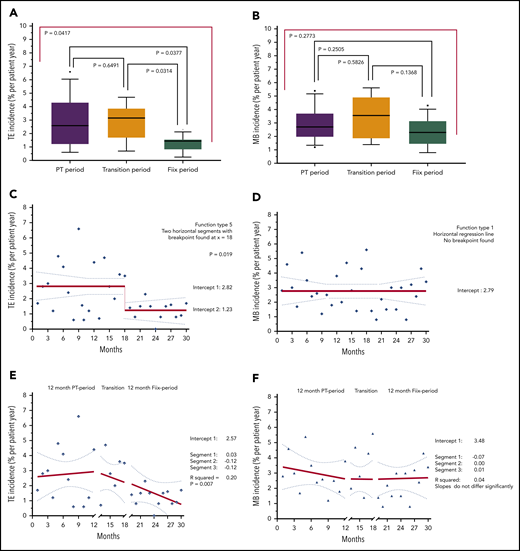
TE and MB incidence rates (% ppy) over 30 months; 12 months before, and 18 months after, monitoring test replacement. Incidence of composite TE (A) and MB (B) during each of the PT, transition, and Fiix periods (box plots with 90% range). TE incidence (C,E) and MB incidence (D,F) per 100 patient years at consecutive monthly intervals over the entire 30-month course. Two-segmented (C-D) and 3-segmented (E-F) regression lines (solid lines), 95% CIs (dotted lines), and R2 values are shown for the overall plots.
TE and MB incidence rates (% ppy) over 30 months; 12 months before, and 18 months after, monitoring test replacement. Incidence of composite TE (A) and MB (B) during each of the PT, transition, and Fiix periods (box plots with 90% range). TE incidence (C,E) and MB incidence (D,F) per 100 patient years at consecutive monthly intervals over the entire 30-month course. Two-segmented (C-D) and 3-segmented (E-F) regression lines (solid lines), 95% CIs (dotted lines), and R2 values are shown for the overall plots.
We then assessed the incidence of vascular events during 30 consecutive 1-month intervals using an interrupted time series before-and-after method of analysis. Using a 2-segmented regression model (Figure 2C), a breakpoint in the incidence of TEs was mathematically identified at 18 months (6 months after test replacement), followed by a 56% reduction in TEs (from 2.82% to 1.23% ppy; P = .019, analysis of variance). The incidence of TEs was constant during each segment, with regression coefficients of +0.03 and −0.01 for the 2 segments; no preintervention incidence trend was evident. The pre- and postintervention incidence of MB did not differ (2.79% ppy) (Figure 2D). A separate 3-segmented regression (Figure 3E-F) confirmed close to horizontal MB incidence slopes during the 3 study periods: −0.07*x, 0.00*x, and +0.01*x; R2 = 0.04), but the TE incidence slope did deviate significantly from 0 (0.03*x, −0.12*x, and −0.12*x; R2 = 0.20; P = .007).
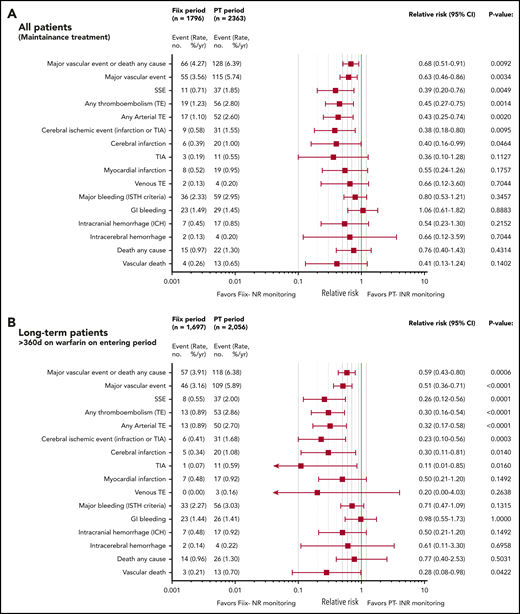
Relative risk plots comparing TE, MB, and deaths during the Fiix and PT periods. (A) Outcomes in all maintenance-phase warfarin patients. Data are based on event counts during the PT and Fiix periods in patients treated beyond the first 60 days on warfarin and show the number of events, event incidence (% ppy), RR, and P value. (B) Outcomes in long-term warfarin patients only (ie, patients treated with warfarin for >360 days prior to entering the study group).
Relative risk plots comparing TE, MB, and deaths during the Fiix and PT periods. (A) Outcomes in all maintenance-phase warfarin patients. Data are based on event counts during the PT and Fiix periods in patients treated beyond the first 60 days on warfarin and show the number of events, event incidence (% ppy), RR, and P value. (B) Outcomes in long-term warfarin patients only (ie, patients treated with warfarin for >360 days prior to entering the study group).
Vascular events and deaths during the warfarin-maintenance phase in the 12-month Fiix vs PT periods
As shown in Figure 3A, during the Fiix period, 55 composite fatal or nonfatal TE or MB events occurred in 1796 patients compared with 115 events in 2363 patients during the PT period (RR, 0.63; 95% CI, 0.46-0.86; P = .0034). The incidence (% ppy) was 3.56% vs 5.74%. In the Fiix period compared to the PT period, 66 vs 128 composite TE, MB, or deaths from any cause occurred (RR, 0.68; 95% CI, 0.51-0.91; P = .0092) at an incidence of 4.27% vs 6.39%. Fifteen deaths occurred during the Fiix period (0.97% ppy) compared with 26 during the PT period (1.30%), with 4 (0.26%) vs 13 (0.65%) vascular deaths, respectively (RR, 0.41; 95% CI, 0.13-1.24; P = .1402).
Fiix monitoring was associated with a significant reduction in total TEs (RR, 0.45; 95% CI, 0.25-0.75; P = .0014), total arterial TEs (RR, 0.43; 95% CI, 0.25-0.74; P = .0020), cerebral ischemic events (RR, 0.38; 95% CI, 0.18-0.80; P = .0095), and cerebral infarction (RR, 0.40; 95% CI, 0.16-0.99; P = .0464). MB was not significantly reduced (RR, 0.80; 95% CI, 0.53-1.21; P = .3547), and gastrointestinal bleeding was similar. The Fiix group had fewer ICHs (RR, 0.54; 95% CI, 0.23-1.30; P = .2152), nontraumatic ICHs (RR, 0.29; 95% CI, 0.06-1.33; P = .1277), and intracerebral hemorrhages (RR, 0.66; 95% CI, 0.12-3.59; P = .7044), but the differences were not significant. Fewer SSEs occurred in the Fiix group at an incidence of 0.71% vs 1.85% (RR 0.39;95% CI 0.20 to 0.76; P = .0049).
Vascular events and deaths during long-term warfarin management
To reduce a potential bias if fewer high-risk patients were present during the Fiix period (ie, fewer new patients, possible loss of high-risk patients during the PT period), we performed a subgroup analysis that only included patients who had been on warfarin for >360 days. A total of 1697 patients was observed for 1456 patient years during the Fiix period, and 2056 patients were observed for 1850 patient years during the PT period. As shown in Figure 3B, the observed vascular event pattern was totally consistent with that in the entire maintenance population (Figure 3A), although the effect size in favor of Fiix monitoring was larger in long-term patients (eg, for total TEs [RR, 0.30; 95% CI, 0.16-0.54; P < .0001], cerebral ischemic events [RR, 0.23; 95% CI, 0.10-0.56, P = .0003], and SSEs [RR, 0.26; 95% CI, 0.12-0.56; P = .0001]). MB and intracranial bleeding were reduced numerically but not significantly. Vascular deaths were reduced in statistically significant manner (RR, 0.28; 95% CI, 0.08-0.98; P = .0422).
In a further attempt to reduce the possible influence of more high-risk patients treated during the PT period, we analyzed vascular events by pairing each long-term patient against him/herself in the PT vs the Fiix period. For this analysis we excluded all fatal events, events that led to warfarin cessation, and recurrent events during each period. By analyzing the remaining 1542 “pairs,” the reduction in total TEs during the Fiix period remained significantly reduced by 57% (odds ratio [OR], 0.43; P = .0446), SSEs were not significantly reduced (OR, 0.42; P = .1456), and MB remained similar (OR, 1.15; P = 1.0000).
AF patients
We separately analyzed the largest subgroup (AF maintenance patients), consisting of 57% of the PT-warfarin patients and 55% of the Fiix-warfarin patients. Their median age was 78 (range, 71-84) vs 79 (range, 72-85) years, respectively, with a median CHA2DS2-VASC score 3 (interquartile range, 2-4) vs 3 (interquartile range, 2-4), respectively. During the PT monitoring period, 1353 maintenance-phase AF patients were observed for 1212 observation years (0.90 years per patient), and 993 patients were observed for 888 observation years (0.89 years per patient) during the Fiix period. All types of TEs, with the exception of myocardial infarctions, were consistently reduced to a similar degree as in the total maintenance group during Fiix-warfarin treatment (Figure 4).
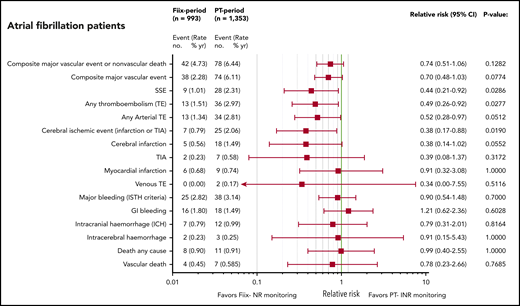
RR plots comparing TE, MB, and deaths during the Fiix and PT periods in AF patients on maintenance-phase warfarin. Data are based on event counts during the PT and Fiix periods in patients treated beyond the first 60 days on warfarin and include the number of events, event incidence (% ppy), RR, and P value.
RR plots comparing TE, MB, and deaths during the Fiix and PT periods in AF patients on maintenance-phase warfarin. Data are based on event counts during the PT and Fiix periods in patients treated beyond the first 60 days on warfarin and include the number of events, event incidence (% ppy), RR, and P value.
Anticoagulation parameters
Anticoagulation laboratory indicators are shown in Table 2. During the PT period, 29 018 monitoring tests were done compared with 17 895 during the Fiix period (Table 2). The annual number of tests done per patient decreased from a median of 17 to 13 (24%) and the testing interval increased from 20 days to 27 days (+35%) with Fiix monitoring. Likewise, dose-adjustments ppy were reduced from 5.0 to 3.3 (−34%), and the dose-adjustment interval increased from 64 to 95 days (+48%). The TTR was 79% with Fiix monitoring and 77% with PT monitoring (P = .0157); Fiix monitoring reduced the normalized ratio between-test variability (VGR) by 33% (P < .0001). During the PT period, patients who were switched to DOACs had more variable PT-INR than did those remaining on warfarin (VGR, 0.20 vs 0.16; P = .0188) but there was no difference during the Fiix period (VGR, 0.10 vs 0.10; P = .7570).
Anticoagulation testing, dosing, intensity, and variability
| PT-INR period (12 mo) | Fiix-NR period (12 mo) | P | Proportional change from PT to Fiix period (%) | |
|---|---|---|---|---|
| Patients analyzed, n | 1997 | 1437 | NA | NA |
| Monitoring tests and intervals | ||||
| Monitoring tests, n (%) | 29 018 (100) | 17 895 (100) | NA | |
| Within target range | 18 665 (64) | 11 084 (62) | NA | |
| Below target range | 5 799 (20) | 3 430 (19) | NA | |
| Above target range | 4 544 (16) | 3 430 (19) | NA | |
| Annual tests per patient | 17 (12-24) | 13 (9-18) | <.0001 | −24 |
| Patient testing interval, d | 20 (15-29) | 27 (20-39) | <.0001 | +35 |
| Patient normalized ratios | 2.47 (2.30-2.65) | 2.50 (2.30-2.70) | .0580 | 0 |
| Patient PT-INR or Fiix-NR range | 1.80 (1.20-2.60) | 1.60 (1.10-2.30) | <.0001 | −16 |
| Patient’s normalized ratio between test variability (VGR) | ||||
| All patients: any target | 0.15 (0.06-0.30) | 0.10 (0.04-0.21) | <.0001 | −33 |
| 2.5-3.5 | 0.30 (0.11-0.58) | 0.15 (0.07-0.36) | .0017 | −50 |
| 2-3 | 0.15 (0.06-0.30) | 0.10 (0.04-0.20) | <.0001 | −33 |
| 1.5-2.5 | 0.05 (0.03-0.12) | 0.04 (0.02-0.18) | .8340 | −20 |
| Patient’s TTR | ||||
| Any target range | 77 (65-88) | 79 (67-89) | .0157 | +3 |
| 2.5-3.5 | 70 (53-83) | 71 (58-82) | .8518 | +1 |
| 2-3 | 77 (65-88) | 79 (68-89) | .0067 | +3 |
| 1.5-2.5 | 88 (77-98) | 86 (74-100) | .7339 | −2 |
| Dosing | ||||
| Patient daily dose | 4.5 (3.2-6.1) | 4.4 (3.1-6.1) | .1820 | −2 |
| Patient dose range | 0.71 (0.15-1.57) | 0.43 (0.00-1.00) | <.0001 | −39 |
| Patient annual dose adjustments | 5.0 (1.1-10.3) | 3.3 (0.0-7.1) | <.0001 | −34 |
| Patient dose-adjustment interval, d | 64 (32-172) | 95 (46-289) | <.0001 | +48 |
The 12-mo Fiix-NR period was compared with the 12-mo PT period. Only patients on maintenance-phase anticoagulation (after excluding the first 60 d in new patients) are included in the analysis. Patients not showing up for testing for >90 d, as well as those who had <3 tests during the respective period, were excluded. Unless otherwise noted, data are median (IQR). Ranks were compared using the Mann-Whitney U test.
NA, not applicable.
During the PT period, patients with TEs had a lower INR (2.2; 1.7-2.8) than did those with MB (3.2; 2.7-4.2; P < .0001); during the Fiix period, the INR was also lower in those with TEs (2.5; 1.9-2.9) than in those with MB (3.2; 2.4-4.5; P = .0005). Patients with TEs had higher anticoagulation variability (VGR) than did those without vascular events (PT period: 0.25; 0.12-0.70 vs 0.16; 0.06-0.34; P < .0001; Fiix period: 0.21; 0.06-0.34 vs 0.08; 0.04-0.17; P = .0043). Likewise, patients with MB had a higher VGR compared with those without vascular events (PT period: 0.36; 0.16-0.65 vs 0.16; 0.06-0.34; P < .0001; Fiix period: 0.34; 0.19-0.51 vs 0.08; 0.04-0.17; P < .0001).
Anticoagulation parameters during transition period
During the 6-month transition period compared with the PT period, the number of tests done was not reduced (17 tests on annual basis), the daily dose of warfarin was the same (4.5 mg), and the TTR remained 77%. However, at the same time, there were significantly fewer dose adjustments (3.2 vs 5.0 on an annual basis), a longer dose-adjustment interval (82 vs 64 days), and lower INR variability (VGR, 0.09 vs 0.15; supplemental Table 2B).
Discussion
Fiix-NR monitoring of warfarin was associated with a 56% reduction in total TEs without increasing MB. The incidence of intracerebral hemorrhage was low. TTR was only slightly higher, but anticoagulation variability was considerably lower during Fiix monitoring compared with prior traditional PT-INR monitoring. These real-world observations lend major support to the validity of the previously reported similar reduction in TEs observed in the Fiix trial.4,10
Fiix-NR, which can be easily measured manually or on any semiautomatic or automatic system at all times, only reflects the combined activity of FII and FX, and, therefore, the true antithrombotic effect of warfarin.2 Clinically irrelevant short-term clotting time fluctuations caused by FVII or by different sensitivities of different thromboplastins to FVII19 that influence standard PT-INR results and confound warfarin dosing are eliminated.1 Consequently, the dosing staff no longer has to chase after fast clotting time variations caused by FVII fluctuations. Consequent to less anticoagulation variability and more stable anticoagulation levels but not simply higher TTR, dose management becomes more precise, and effectiveness is markedly improved, as shown previously.4,5,17 As in the Fiix trial, the median warfarin dose was similar with both types of monitoring, but dose variation was reduced with Fiix monitoring. We suggest that less variable anticoagulation intensity with Fiix monitoring prevents an increase in bleeding.17,20 We considered whether the therapeutic PT-INR is likely to be falsely therapeutic in a number of cases (ie, when FVII is low but FII and FX are not that low), but we could not confirm this because we did not measure Fiix-NR and PT-INR in the same samples. However, we did measure both in all samples in the Fiix trial but had not yet analyzed these data. Therefore, we now revisited the previously published Fiix trial data and compared Fiix-NR in Fiix-INR–monitored patients to Fiix-NR patients in the PT-INR–monitored control group. Surprisingly, the new Fiix trial results showed that Fiix-NR was slightly lower in the Fiix group (median, 2.50 vs 2.67; P < .0001). However, the median Fiix-NR range was narrower in the Fiix group (2.1 vs 2.3; P = .0416) and the variability (VGR) of Fiix-NR was lower in the Fiix-monitored group compared with the PT-monitored control group (0.14 vs 0.20; P < .0001). Thus, reduced anticoagulation variability remains the most likely explanation for the improved clinical outcome during Fiix-NR monitoring.
Our main clinical findings were identical in the overall consecutive 30-month interrupted time series analysis and in the 2 predefined PT and Fiix periods comparisons for which we had decided to exclude the first 6 months as a transition period. The 6-month lag time before clinical improvement becomes evident was mathematically identified by the 2-segmented regression and is remarkably similar to the Fiix trial finding that we used to predefine the arguable length of the transition period. The long lag time may be due to the fact that most of our patients already had an established monitoring and dosing pattern when the monitoring test was replaced, as well as the fact that it takes 2 to 3 months until all patients are being monitored with the new test. Then, a few more Fiix tests need to be done over several months before anticoagulation variability is reduced and effectiveness improves.
Being an observational study, we considered whether high-risk patients suffering fatal or severe vascular events leading to warfarin cessation were selectively lost during the 30-month study period, because this could bias results in favor of Fiix-warfarin. Patients switched to DOACs during the PT period had more anticoagulation variability, which may have led to a more stable warfarin population during the Fiix period, although primarily low-risk patients appear to have been switched to DOACs during the Fiix period, as has been reported elsewhere.21 On the other hand, older age during Fiix-warfarin monitoring might have biased results against Fiix-warfarin. We approached these issues from several angles. First, patient demographics from the beginning to the end of the study did not differ, with the exception of increasing age and that patients who discontinued warfarin were older (77 years) compared with those who continued taking it (75 years). Second, to minimize the loss of high-risk patients, we did not censor those who continued on warfarin after surviving vascular events. Third, the segmented regression analyses do not suggest that population morbidity was changing prior to test replacement. The absence of a significant slope prior to test replacement may be the strongest indicator we can provide that the PT-warfarin patient population and the Fiix-warfarin patient population were indeed comparable.15 Fourth, to reduce the influence of more new patients, who often have unstable anticoagulation during early treatment, during the PT period, we performed a subanalysis of long-term warfarin patients only (Figure 3B). This analysis led to the same outcome but with an even larger effect size in favor of Fiix monitoring. Fifth, in a further subanalysis, a paired analysis of long-term patients confirmed the major findings, despite excluding the patients who suffered the most severe events.
Our single-center experience with Fiix-PT represents ∼65% to 70% of all warfarin use in Iceland. Being a single-center experience at a high TTR site, this may limit the generalizability of the current results to other practices. Nevertheless, our dosing is based on a highly standardized British warfarin monitoring software algorithm that is widely used in other high TTR anticoagulation centers in the United Kingdom, Canada, and the United States. Therefore, we argue that the results would likely translate to those populations. How the new test would affect individual physician dosing not using software assistance has not been studied, but we suggest that it will be easier to manage because there is less variability. However, we stress that a modified warfarin-initiation protocol should be used with Fiix-NR monitoring to prevent early overanticoagulation.13
Further limitations should be considered. First, associations, but not causality, can be claimed based on a historical cohort study, albeit a “quasi”-experimental–interrupted time series study.15 Second, despite being all inclusive without loss to follow-up, rare vascular events may have escaped detection if diagnosed in small provincial hospitals or abroad, although we have no reason to believe that underreporting would have been systematically skewed to a particular observation period. Third, analyzing aggregate data, pooling events and patient years means that little adjustment for patient-level properties was possible. Fourth, the inability to blind the 2 clinical event reviewers is a potential source of bias. Fifth, the dosing staff was not blinded to the origin of the normalized ratio, which could be a source of bias, although we contend it was not, because Fiix-NR monitoring led to less frequent monitoring and reduced TEs despite that. Sixth, the fact that the majority of patients were monitored using both PT-INR and Fiix-NR, in that particular order, also could have introduced selection bias effects that are difficult to assess. Seventh, it should be noted that the study population was >99% white. Nevertheless, taking all of these considerations into account, we contend that the similarity of the current results to the prior double-blind randomized Fiix trial and the segmented regression results does not suggest a major bias.
During the past decade, the convenient, but more expensive, DOACs have increasingly replaced VKAs for the management of AF and VTE. In AF, the overall interpretation of 4 major industry-initiated randomized controlled trials has been that DOACs are at least as effective as PT-warfarin with superior safety claimed for some, in particular reduced intracranial or intracerebral hemorrhage.6-9,22 However, superior efficacy and safety of DOACs has not been shown compared with well-managed PT-warfarin control patients in these trials.23-27 Meta-analyses of trials involving patients with unprovoked VTE28 or evaluating long-term anticoagulation29 report lower mortality with VKA treatment than with DOACs.28,29 Two recent studies from real-world practice involving 323 000 patients in the United States and the United Kingdom suggest that warfarin effectiveness was underestimated in the randomized controlled trials, that the overall clinical significance of rare intracerebral hemorrhages is overestimated compared with the consequences of the much more common preventable ischemic strokes,30 and that patients on PT-warfarin had lower mortality than did those taking DOACs.31 Based on the above considerations and assuming that the efficacy of DOACs and well-treated PT-warfarin is similar, we can infer from the results of the current study and the prior Fiix trial that well managed Fiix-warfarin is more effective than well-managed PT-warfarin and DOACs. Such a conclusion may also be supported by our prior meta-analysis,10 but it remains to be investigated directly. Finally, although adding the Fiix-deficient plasma reagent to the clotting test increases the cost of the reagent, most of the assay cost is not reagent cost, and, in our opinion, any moderate increase in reagent cost will be far outbalanced by the improved clinical effectiveness of the new monitoring method.
The primary aim of prescribing oral anticoagulants is to reduce mortality and long-term complications of TEs on health. Warfarin remains used when DOACs are less effective than PT-warfarin or are unsafe,32-35 in patients being returned to warfarin when physicians consider a trial of DOACs to have failed, and for patients in less affluent situations. The current study, together with the Fiix trial, suggests that the effectiveness of well-managed warfarin can be improved markedly without increasing bleeding if monitored with the new Fiix-NR instead of the traditional PT-INR. Indeed, it is tempting to conclude that the traditional PT-INR, as a result of its sensitivity to reduced FVII, has confounded warfarin dosing and caused warfarin instability for 7 decades. Our results suggest that replacing the traditional PT with Fiix-PT could have a major favorable impact on individual patient health, public health, and health care costs.
Individual participant data will not be shared but deidentified data underlying the reported results may be requested from Pall T. Onundarson (pallt@landspitali.is).
The online version of this article contains a data supplement.
The publication costs of this article were defrayed in part by page charge payment. Therefore, and solely to indicate this fact, this article is hereby marked “advertisement” in accordance with 18 USC section 1734.
Acknowledgments
The authors thank the Landspitali anticoagulation management service staff (Gunnhildur Magnusdottir, Tinna Halldorsdottir, Alma Bjornsdottir, and Erna Valdimarsdottir) and the coagulation laboratory staff (Kristin A. Einarsdottir, Loic Letertre, and Oddny Olafsdottir), as well as Ubaldo Benitez Hernandez, statistical advisor, Department of Scientific Affairs.
This work was supported by a technology development grant from The Icelandic Research Fund/Technology Development Fund (www.RANNIS.is). FII- and FX-deficient plasma was provided free of charge by Hart Biologicals Ltd, Hartlepool, United Kingdom (www.hartbio.co.uk).
The funding sources had no role in the study design, data collection, analysis, interpretation of data, writing of the report, or in the decision to submit the article for publication.
Authorship
Contribution: A.R.O. designed the study, collected and analyzed data, and wrote the initial draft of the manuscript; B.R.G. designed the study, supervised laboratory testing, gathered and analyzed data, and edited the manuscript; H.M.J. analyzed data; B.F. edited the manuscript; R.P. analyzed data and edited the manuscript; P.T.O. designed the study, administered the study, analyzed data, and cowrote the manuscript; and all authors had full access to all of the data, including statistical calculations, tables, and graphs, and take responsibility for the integrity of the data and the accuracy of the data analysis.
Conflict-of-interest disclosure: All authors have completed the International Committee of Medical Journal Editors uniform disclosure form at www.icmje.org/coi_disclosure.pdf. P.T.O. and B.R.G. are coinventors of the Fiix-PT. Together with the University of Iceland and the Landspitali National University Hospital, they are owners of Fiix Diagnostics LLC, which holds a patent for the Fiix-PT. The Fiix test was marketed (first in the United Kingdom) in May 2020 by contracted manufacturer Hart Biologicals Ltd. The remaining authors declare no competing financial interests.
Correspondence: Pall T. Onundarson, Hematology Laboratory and Thrombosis and Hemostasis Service, Landspitali−The National University Hospital of Iceland and Faculty of Medicine, University of Iceland, Hringbraut, 101 Reykjavik, Iceland; e-mail: pallt@landspitali.is.

This feature is available to Subscribers Only
Sign In or Create an Account Close Modal