

Key Points
EBV-associated T/NK cell diseases harbor large expansions of myeloid-derived suppressor cells that may suppress the antiviral T-cell response.
EBV-infected T cells and NK cells persist in patients in large numbers following treatment.

Abstract
Chronic active Epstein-Barr virus (CAEBV) typically presents as persistent infectious mononucleosis-like disease and/or hemophagocytic lymphohistocytosis (HLH), reflecting ectopic Epstein-Barr virus (EBV) infection and lymphoproliferation of T and/or NK cells. Clinical behavior ranges from indolent, stable disease through to rapidly progressive, life-threatening disease. Although it is thought the chronicity and/or progression reflect an escape from immune control, very little is known about the phenotype and function of the infected cells vs coresident noninfected population, nor about the mechanisms that could underpin their evasion of host immune surveillance. To investigate these questions, we developed a multicolor flow cytometry technique combining phenotypic and functional marker staining with in situ hybridization for the EBV-encoded RNAs (EBERs) expressed in every infected cell. This allows the identification, phenotyping, and functional comparison of infected (EBERPOS) and noninfected (EBERNEG) lymphocyte subset(s) in patients’ blood samples ex vivo. We have characterized CAEBV and HLH cases with monoclonal populations of discrete EBV-activated T-cell subsets, in some cases accompanied by EBV-activated NK-cell subsets, with longitudinal data on the infected cells’ progression despite standard steroid-based therapy. Given that cytotoxic CD8+ T cells with relevant EBV antigen specificity were detectable in the blood of the best studied patient, we searched for means whereby host surveillance might be impaired. This revealed a unique feature in almost every patient with CAEBV studied: the presence of large numbers of myeloid-derived suppressor cells that exhibited robust inhibition of T-cell growth. We suggest that their influence is likely to explain the host’s failure to contain EBV-positive T/NK-cell proliferation.
Introduction
Epstein-Barr virus (EBV) colonizes the B-cell system, initially as a growth-transforming infection with expression of the full set of latent cycle genes, followed by transition to an antigenically silent latency within memory B cells. Primary infection usually occurs during childhood and is almost always asymptomatic. Delay in primary infection until young adulthood can result in infectious mononucleosis (IM), an acute but self-resolving illness whose febrile symptoms appear to be a product of the host’s exaggerated cellular immune response. That response is initiated by natural killer cells (NK), followed by robust CD4+ and particularly CD8+ T-cell responses to lytic and latent cycle viral antigens.1,2 However, when T-cell function is impaired, for example, transplant recipients on immunosuppressive drugs, failure to control latent growth-transforming infection can lead to posttransplant B lymphoproliferative disease (LPD).3
By contrast, primary infection in a rare minority of individuals leads to a chronic, nonresolving condition termed chronic active EBV (CAEBV) encompassing many of the clinical features of IM, such as fever, splenomegaly, hepatitis, and lymphadenopathy. In CAEBV, however, these symptoms are severe and persist for at least 3 months accompanied by very high EBV DNA load in the blood and extensive organ infiltration by EBV-infected cells. CAEBV can develop into a spectrum of clinical conditions. Patients with indolent disease can remain stable over many years, whereas others display a more rapidly progressive disease with serious complications, including hemophagocytic lymphohistiocytosis (HLH), hepatic failure, and gastrointestinal ulceration/perforation.
In Western countries, CAEBV is thought to be predominantly associated with EBV infection of B cells. Previously reported cases of B-cell CAEBV identified defective cytotoxic T lymphocytes (CTLs)4 or NK cells,5 in some cases linked to inactivating mutations in the perforin6 or GATA2 gene7 ; such impairment could explain the chronic nature of the disease. In contrast, CAEBV in South East Asia, Central, and South America is predominantly associated with EBV infection of T cells and NK cells. In these patients, the clinical features, natural history, and prognosis are associated with the phenotypic identity of the infected lineage; patients with T-cell CAEBV exhibit more aggressive disease and significantly inferior survival, whereas patients with NK-cell CAEBV more often have milder symptoms and a more favorable clinical outcome.8,9 However, NK-cell CAEBV seems to have a greater propensity (23.1%) for transformation into aggressive NK-cell leukemia or extranodal NK/T-cell lymphoma.8-10 Thus, the morbidity and mortality conferred by this clinically heterogeneous spectrum of EBV-associated lymphoproliferations are substantial. The high mortality is likely attributable to the paucity of effective treatment options. Immunomodulatory agents are largely ineffective and, although corticosteroids and other immunosuppressive agents temporarily ameliorate clinical symptoms, patients usually succumb to progressive disease. Currently, allogeneic stem cell transplantation is the only established curative treatment.11-13
The pathogenesis of T/NK CAEBV is poorly understood. In contrast to B-cell CAEBV, patients with T/NK-cell CAEBV are not thought to have a preexisting immune defect,10 yet infected cells persist in blood and tissues long term. These EBV-infected T/NK cells exhibit a latency I/II viral gene expression profile (noncoding EBV-encoded RNAs [EBERs], EBNA1 ± LMP1, and LMP2a/TR)14 and should therefore elicit a T-cell response. This suggests that T-cell responses are absent or in some way functionally inhibited. This hypothesis is supported by clinical experience in this context, whereby infusions of third-party EBV-specific CTLs have proven ineffective against progressive disease,15 suggesting an inhibitory mechanism is at play.
To address the many issues raised by the different presentations of CAEBV and EBV-associated LPDs, we developed a protocol, applicable to blood cell preparations ex vivo, to inform patient management while helping to understand disease pathogenesis. Here, we describe a protocol that combines EBER in situ hybridization (ISH), allowing visualization and enumeration of EBV-infected cells, with cell surface and intracellular staining for a whole range of phenotypic and functional markers relevant to B, T, or NK cells and their subsets. This protocol was applied to 5 UK patients, all initially diagnosed as CAEBV or as HLH, which were found to be EBV related. Two proved to have B-cell infection; 3 had monoclonal T-cell or NK-cell infections, whose progression could be followed despite attempts at therapy. Surprisingly, this same study revealed another unexpected but consistent feature of blood samples from patients with T/NK CAEBV, the presence of large numbers of circulating myeloid-derived suppressor cells (MDSCs) with the ability to suppress T-cell responses in in vitro assays. This points to a potential link between MDSC-mediated T-cell inhibition and the chronic progressive nature of CAEBV.
Methods
Ethical approval
This research received institutional approval from the University of Birmingham, and studies of clinical material received ethical approval from the South Birmingham NHS Research Ethics Service Committee (07/H1208/62). All patients and healthy volunteers provided written informed consent in accordance with the Declaration of Helsinki.
Flow cytometry
Peripheral blood mononuclear cells (PBMCs; 5 × 10⁶) were stained using Fixable Viability Dye eFluor-450 or eFluor-780 (Thermo Fisher Scientific) for 30 minutes at 4°C. Cell surface staining was then performed with fluorophore-conjugated antibodies (Table 1) for 30 minutes at 4°C. MDSCs were preincubated with purified human immunoglobulin G (5 µg/mL) for 15 minutes at 4°C prior to addition of monoclonal antibodies. For intracellular staining, cells were fixed and permeabilized using the TrueNuclear Transcription Factor Buffer Set (Biolegend) according to the manufacturer’s instructions and then labeled with antibodies (Table 1) for 30 minutes at room temperature. Fluorescence data were acquired using an LSR II or LSRFortessa X-20 (Becton Dickinson) and analyzed in FlowJo software version 7.6.5 (Tree Star).
Antibodies used in flow cytometry and FlowRNA
| Antibody | Fluorophore | Clone | Company |
|---|---|---|---|
| Cell surface | |||
| CD3 | AF700 | OKT3 | eBioscience |
| CD3 | APC | SK7 | Becton Dickinson |
| CD4 | ECD | T4 | Beckman Coulter |
| CD8 | AF488 | HIT8a | Biolegend |
| CD8 | BV650 | SK1 | Biolegend |
| CD11b | FITC | ICRF44 | Biolegend |
| CD14 | Pacific blue | M5E2 | Biolegend |
| CD15 | PE/Dazzle 594 | SSEA-1 | Biolegend |
| CD16 | BV650 | 3G8 | Biolegend |
| CD20 | AF700 | 2h7 | Biolegend |
| CD25 | PE | M-A251 | Biolegend |
| CD33 | PE | P67.6 | Biolegend |
| CD38 | PE-Cy7 | HB-7 | Biolegend |
| CD45RA | BV711 | HI100 | Biolegend |
| CD56 | PE | MEM0188 | Thermo Fisher |
| CD56 | ECD | N901 | Beckman Coulter |
| CD197 (CCR7) | PE | G043H7 | Biolegend |
| HLA-DR/DP/DQ | PE-Cy7 | Tu39 | Biolegend |
| TCRγ/δ | PE | B1 | Biolegend |
| Intracellular | |||
| FoxP3 | PE-Cy7 | PCH101 | eBioscience |
| Eomes | PE | WD1928 | eBioscience |
| Perforin | PE-Cy7 | dG9 | Becton Dickinson |
| Ki67 | BV786 | B56 | Becton Dickinson |
| Granzyme B | AF700 | GB11 | Becton Dickinson |
FlowRNA for detection of EBERs
FlowRNA experiments were performed on 1 to 3 × 10⁶ PBMC (PrimeFlow RNA, Thermo Fisher) according to the manufacturer instructions. A full description of the protocol can be found in the supplemental Data, available on the Blood Web site. Briefly, cells were stained using Fixable Viability Dye eFluor-450 and then for cell surface markers (Table 1). Cells were fixed, permeabilized, and intracellular staining performed in the presence of RNase inhibitors. Cells were fixed again, and then target RNA was hybridized using Target Probe sets (custom designed by PrimeFlow RNA, Thermo Fisher Scientific) for EBER-1/2 and β2-microglobulin (B2M). Briefly, the probes were hybridized at 40°C for 3 hours, washed, and then subjected to sequential hybridization at 40°C using the “PreAmplifier,” “Amplifier,” and fluorescent label (type 1 probes, AlexaFluor-647; type 2 probes, AlexaFluor-488). Cells were acquired using an LSRII or LSRFortessa X-20 and analyzed in FlowJo software, version 10.
Measurement of cytokines in plasma
Plasma was collected following density centrifugation (Lymphoprep; Stemcell Technologies) of fresh EDTA blood samples. Plasma was immediately snap-frozen in liquid nitrogen and stored at −80°C until use. Cytokines in plasma (interleukin-1β [IL-1β], IL-4, IL-6, IL-10, IL-17A, interferon-γ [IFN-γ], granulocyte-macrophage colony-stimulating factor [GM-CSF], tumor necrosis factor-α [TNF-α]) were measured using a custom ProcartaPlex bead-based immunoassay (Thermo Fisher Scientific) according to manufacturer’s instructions. Arginase-1 in plasma was measured by ProcartaPlex Singleplex immunoassay. Mean fluorescence intensity (MIF) of each analyte was detected using a Luminex 200 instrument (R&D Systems, United Kingdom).
T lymphocyte proliferation assay
CD15+ myeloid-derived suppressor cells of granulocyte lineage (G-MDSCs) were isolated from PBMC using anti-human CD15-microbeads, and T lymphocytes were isolated by negative selection following removal of CD15+ cell (Miltenyi Biotech). T cells (2 × 10⁵/well) were cultured in 96-well flat-bottom plates coated with anti-CD3 (OKT3; 3 µg/mL) and anti-CD28 (2 µg/mL; eBioscience), in 200 µL complete medium supplemented with 0.1% β-mercaptoethanol (Thermo Fisher Scientific). Cells were incubated for 4 days at 37°C, 5% CO2, and proliferation was determined by 3H-thymidine (Perkin Elmer Life Sciences) incorporation using a TopCount NXT scintillation counter (Perkin Elmer). MDSC-mediated suppression was determined by coculture with T cells. Results are expressed as a percentage of T-cell proliferation driven by CD3/28 ligation in the presence of MDSCs, relative to T-cell proliferation in their absence (100%).
Statistical analysis
Statistical tests used are indicated in relevant sections. All experiments where tests have been applied were performed on at least 3 donors. Tests were considered statistically significant if P < .05.
Results
Setup and validation of multicolor FlowRNA
To identify the lymphocyte subset infected by EBV, we established a multicolor flow cytometry-based assay (FlowRNA) to simultaneously detect the abundantly expressed viral noncoding RNAs (EBER-1/2) present in every infected cell, together with lymphocyte subset markers CD3, CD4, CD8, CD19, and CD56 on 1 to 2 × 10⁶ fresh mononuclear leukocytes (PBMC). The assay (Figure 1A) involved cell surface staining, cell fixation, permeabilization, intracellular staining, and then ISH for the viral EBERs, and for B2M transcripts as a positive control. The cells were analyzed by flow cytometry; lymphocytes were identified by forward vs side scatter and CD14+ monocytes, and dead cells and cell doublets were excluded from all subsequent analysis (Figure 1B). The assay was initially validated by adding decreasing numbers of EBV+/GFP+ Akata cells to EBV−/GFP− Akata cells. The dual EBER+/GFP+ populations matched the input cell number and demonstrated assay sensitivity and specificity (Figure 1C). EBV-infected lymphocyte subsets were not identified in the blood of healthy EBV carriers (n = 10), where the percentage of infected B cells was below the threshold of detection (Figure 1D). However, the assay unambiguously identified EBV-infected subsets in previously frozen reference samples from patients with EBV-associated LPDs. In the case shown, EBV was detected in CD3+/CD8+ T cells with a small fraction detected in CD19+ B cells (Figure 1D). Virus loads of ∼8 × 10⁴ virus copies per milliliter blood were reliably detected by FlowRNA provided at least 500 × 105 PBMCs were analyzed.
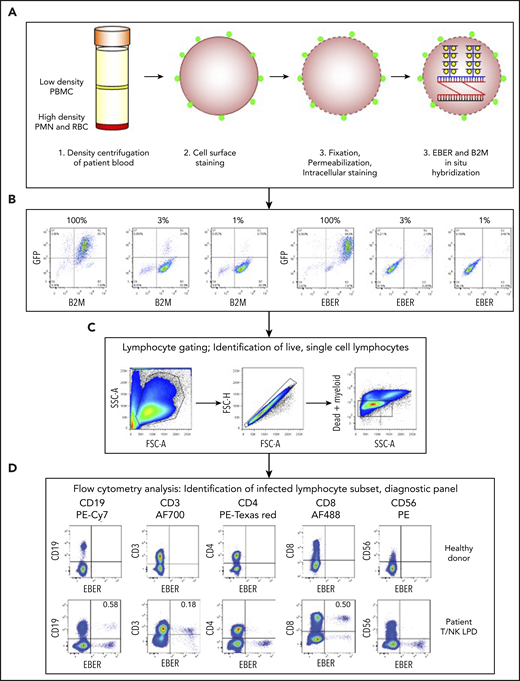
Multicolor FlowRNA protocol to identify the phenotype and function of the EBV-infected lymphocytes. (A) Mononuclear cells were isolated from peripheral blood, stained for lymphocyte lineage markers, and then fixed and permeabilized. Intracellular markers were then stained, and the cells subjected to fluorescence ISH (FlowRNA) for the virally encoded EBERs and housekeeping cellular B2M. (B) EBV+/GFP+ Akata cells were added to EBV−/GFP− Akata cells at decreasing percentages (100%, 3%, 1%) and examined by FlowRNA to determine the sensitivity and specificity of the assay. (C) Lymphocytes were identified by forward vs side scatter, and single cells were gated, dead, and myeloid cells were excluded from further analysis. (D) The stained cells were examined by flow cytometry and plotted as CD19, CD3, CD4, CD8, and CD56 vs EBER to determine the subset of cells infected with EBV (dual positive). The upper panel shows a representative assay performed on blood of a healthy EBV carrier where no EBV-infected cells were detected. The lower panel shows a representative assay performed on the blood of a T/NK LPD patient and clearly shows CD3+, CD8+, and CD19+ lymphocyte populations expressing EBERs. The percentage of total CD19+ B cells and total CD3+, CD8+ T cells is given in the upper righthand quadrant. FSC, forward scatter; PMN, polymorphonuclear leukocytes; RBC, red blood cell; SSC, side scatter.
Multicolor FlowRNA protocol to identify the phenotype and function of the EBV-infected lymphocytes. (A) Mononuclear cells were isolated from peripheral blood, stained for lymphocyte lineage markers, and then fixed and permeabilized. Intracellular markers were then stained, and the cells subjected to fluorescence ISH (FlowRNA) for the virally encoded EBERs and housekeeping cellular B2M. (B) EBV+/GFP+ Akata cells were added to EBV−/GFP− Akata cells at decreasing percentages (100%, 3%, 1%) and examined by FlowRNA to determine the sensitivity and specificity of the assay. (C) Lymphocytes were identified by forward vs side scatter, and single cells were gated, dead, and myeloid cells were excluded from further analysis. (D) The stained cells were examined by flow cytometry and plotted as CD19, CD3, CD4, CD8, and CD56 vs EBER to determine the subset of cells infected with EBV (dual positive). The upper panel shows a representative assay performed on blood of a healthy EBV carrier where no EBV-infected cells were detected. The lower panel shows a representative assay performed on the blood of a T/NK LPD patient and clearly shows CD3+, CD8+, and CD19+ lymphocyte populations expressing EBERs. The percentage of total CD19+ B cells and total CD3+, CD8+ T cells is given in the upper righthand quadrant. FSC, forward scatter; PMN, polymorphonuclear leukocytes; RBC, red blood cell; SSC, side scatter.
Identification of EBV-infected lymphocytes by multicolor FlowRNA
The clinical data for all 5 patients are summarized in Table 2 (and supplemental Data). Each patient presenting with EBV-associated LPDs had high EBV loads measured in whole blood, enabling the identification and enumeration of infected lymphocyte subsets directly from blood. The FlowRNA revealed clear populations of EBER-positive (EBERPOS) and EBER-negative (EBERNEG) lymphocytes; no other cell types, including myeloid cells, were EBERPOS. In patients 1 and 2, the EBERPOS cells were identified as CD19+ B cells (Figure 2A), where ∼1% of total B cells were EBERPOS. Although this appears to be relatively low, detection of EBV in 1% of B cells is remarkably high, equivalent to the number of EBV-infected B cells in the blood of acute IM patients.16 In contrast, the numbers of EBV-infected B cells in healthy carriers is on average 1 B cell in 10 000,17 below the threshold of detection of the assay (Figure 1D).
Clinical characteristics of patients with EBV-associated LPDs
| Patient | Age, y/sex | History | Presentation | Diagnosis | EBV PCR (copies per milliliter) | Treatment | Outcome |
|---|---|---|---|---|---|---|---|
| 1 | 46/M | Chronic plantar warts | Longstanding constitutional symptoms | CAEBV | 3.8 × 10⁵ | None | Alive, lost to follow-up |
| 2 | 19/M | Crohn on IS therapy (6-mercaptopurine) | Acute illness with clinical and laboratory features of HLH | HLH secondary to EBV infection | 1.54 × 10⁵ | Rituximab, steroids, and etoposide | Alive |
| 3 | 21/M | Fevers, night sweats, weight loss | Acute illness with clinical and laboratory features of HLH | HLH with CAEBV | 3 × 10⁶ | R-CHOP Etoposide and corticosteroids FMT conditioning, then HSCT | Recurrence of disease and death |
| 4 | 54/M | Subacute illness with weight loss and gastrointestinal symptoms | CAEBV, gastric involvement | 1.4 × 10⁶ | Steroids, then gemcitabine, dexamethasone, and cisplatin | Death with PD and visceral perforation | |
| 5 | 27/M | Ulcerative colitis, on infliximab | Rapid deterioration with fevers, cytopenias, and hepatosplenomegaly | ANKL | 1.99 × 10⁶ | Corticosteroids | Death |
ANKL, aggressive NK leukemia; FMT, fludarabine, melphalan, thiotepa; HSCT, human stem cell transplant; IS, immunosuppressive; M, male; PCR, polymerase chain reaction; R-CHOP, rituximab, cyclophosphamide, doxorubicin, vincristine, prednisolone.
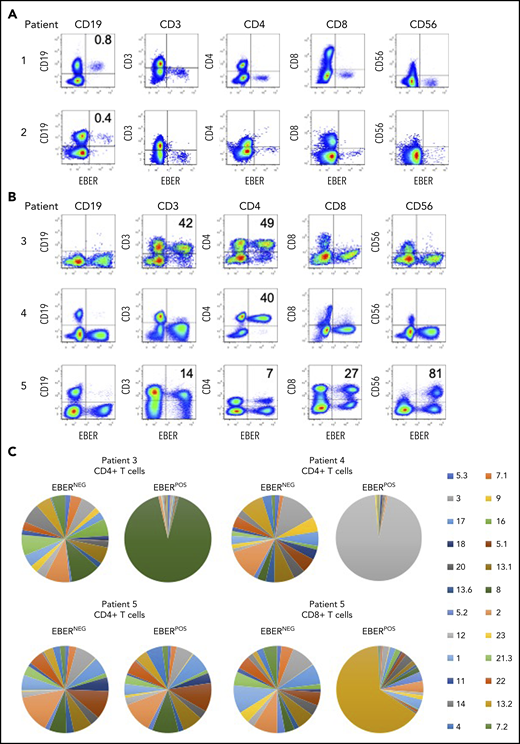
Identification of EBV-infected lymphocytes and clonality in the peripheral blood of patients. (A) Multicolor FlowRNA cytometric analysis of PBMCs from patients 1 and 2 revealed EBV infection of CD19+ B cells. (B) FlowRNA analysis of PBMC from patients 3, 4, and 5 revealed EBV infection of CD4+ T cells from patient 3 and 4, and EBV infection of CD56high NK cells, CD4+ and CD8+ T cells. The analysis also revealed downregulation of CD3 expression in the EBERPOS across patients 3 to 5. The percentage of total lymphocyte subsets expressing EBERs is given in the upper righthand quadrant. (C) T cells were stained with a panel of 24 antibodies against the TCR-BV epitopes and analyzed by flow cytometry. The percentage of T cells expressing each TCR-BV are represented by Venn diagrams. For patients 3, 4, and 5, all EBERNEG T cells exhibited polyclonal TCR-BV populations. However, the EBERPOS CD4+ T cells from patients 3 and 4 exhibited a large monoclonal TCR-BV expansion (TCR-BV8 for patient 3 and TCR-BV12 for patient 4). In contrast, EBERPOS CD4+ T cells from patient 5 exhibited a polyclonal TCR-BV population, whereas the CD8+ T cell exhibited a more focused TCR-BV population (TCR-BV13.2). Key: TCR-BV usage.
Identification of EBV-infected lymphocytes and clonality in the peripheral blood of patients. (A) Multicolor FlowRNA cytometric analysis of PBMCs from patients 1 and 2 revealed EBV infection of CD19+ B cells. (B) FlowRNA analysis of PBMC from patients 3, 4, and 5 revealed EBV infection of CD4+ T cells from patient 3 and 4, and EBV infection of CD56high NK cells, CD4+ and CD8+ T cells. The analysis also revealed downregulation of CD3 expression in the EBERPOS across patients 3 to 5. The percentage of total lymphocyte subsets expressing EBERs is given in the upper righthand quadrant. (C) T cells were stained with a panel of 24 antibodies against the TCR-BV epitopes and analyzed by flow cytometry. The percentage of T cells expressing each TCR-BV are represented by Venn diagrams. For patients 3, 4, and 5, all EBERNEG T cells exhibited polyclonal TCR-BV populations. However, the EBERPOS CD4+ T cells from patients 3 and 4 exhibited a large monoclonal TCR-BV expansion (TCR-BV8 for patient 3 and TCR-BV12 for patient 4). In contrast, EBERPOS CD4+ T cells from patient 5 exhibited a polyclonal TCR-BV population, whereas the CD8+ T cell exhibited a more focused TCR-BV population (TCR-BV13.2). Key: TCR-BV usage.
In patients 3 and 4, FlowRNA revealed EBV infection of the CD4+ T cells (Figure 2B). The percentage of EBERPOS cells within the total CD4+ T-cell population was high for both patients: 49% from patient 3 and 40% from patient 4. Patient 5 had a more complex profile of non–B-cell infection. EBV was detected in at least 80% of total CD56+ NK cells, 100% of which were CD56high (Figure 2B). EBV was also detected in CD4+, CD8+ T cells, and CD19+ B cells.
Notably, the level of CD3 expression was downregulated on EBERPOS T cells but not EBERNEG T cells, shown by MFI (Figure 2B). The CD3 MFI was consistently lower on EBERPOS T cells from patient 3 and 5 compared with EBERNEG T cells (patient 3: EBERPOS 446 vs EBERNEG 614; patient 5: CD4+: EBERPOS 1240 vs EBERNEG 2019; and CD8+ MFI: EBERPOS 459 vs EBERNEG 1204). CD3 expression on the EBERPOS CD4+ T cells from patient 4 was significantly lower than the EBERNEG cells (EBERPOS 210 vs EBERNEG 1054).
Clonality of the EBV-infected T cells
The EBV-associated T/NK-cell LPDs are considered monoclonal/oligoclonal proliferations of EBV-infected T/NK cells due to the presence of a monoclonal virus.18 To extend these findings, we investigated T-cell receptor (TCR) clonality of the EBERPOS vs the EBERNEG CD4+ T cells using a panel of monoclonal antibodies directed against Vβ epitopes to delineate the TCRαβ repertoire. The TCR-BV usage in the EBERPOS CD4+ T cells from patients 3 and 4 and the EBERPOS CD8+ T cells from patient 5 revealed the presence of a monoclonal EBV proliferation; TCR-BV8, TCR-BV12, and TCR-BV13.2, respectively (Figure 2C). However, the EBERPOS CD4+ T cells from patient 5 were a clonally diverse EBV-positive T-cell population. In contrast, the total EBERNEG CD4+ and CD8+ T cells from each patient retained a heterogeneous spread of TCR-BV usage (Figure 2C). Single-cell cloning of the EBERPOS and EBERNEG CD4+ T cells from patient 4 and subsequent sequencing of the TCR Vα and Vβ chains confirmed the TCR-BV8 had identical CDR3 DNA sequences (supplemental Figure 1).
Phenotype and function of EBV-infected CD4+ T cells
The adaptability of FlowRNA enabled the simultaneous comparison of phenotype and function between EBERPOS and EBERNEG cells directly from patient blood, with matched lymphocyte subsets from healthy controls (n = 6). We developed FlowRNA panels to examine markers of T-cell subsets, activation, proliferative status, and functional capacity to determine how EBV alters the phenotype and function of infected cells. We added CD45RA and CCR7 to discriminate between naive (CD45RA+, CCR7+), central memory (CD45RA−, CCR7+), effector memory (CD45RA−, CCR7−), and terminally differentiated effector (CD45RA+, CCR7−) CD4+ T cells; CD38 and Ki67 to examine activation and proliferative status; Foxp3 and CD25 to identify regulatory T cells (Tregs); plus IFN-γ and TNF-α to examine functional capacity.
Interestingly, EBV infection appeared to be confined to memory T cells. The EBERPOS CD4+ T cells from patients 3 and 4 expressed neither CD45RA nor CCR7, consistent with memory (Figure 3 top row). In contrast, the EBERNEG CD4+ T-cell population maintained naive, central memory, effector memory, and terminally differentiated effector CD4+ T-cell subsets at similar ratios to those observed in healthy donors; 2 representative donors are shown (Figure 3A). These EBERPOS CD4+ T cells also showed greater levels of activation and proliferation (CD38 and Ki67) than the EBERNEG CD4+ and healthy donor CD4+ T cells. In patient 3, >60% of EBERPOS cells expressed CD38, with at least 15% of these coexpressing Ki67. In patient 4, the majority of EBERPOS cells expressed high levels of CD38 and coexpressed Ki67 (Figure 3B). Such findings suggest that EBV may be driving the activation and proliferation of infected cells.
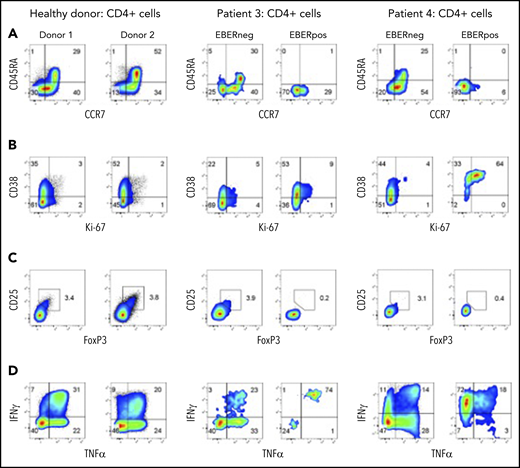
EBERPOS and EBERNEG cells exhibit differences in their phenotype and function. (A) EBERPOS and EBERNEG CD4 T cells from patients 3 and 4 were stained for CCR7 and CD45RA, (B) Ki-67 and CD38, (C) Foxp3 and CD25, and (D) TNF-α and IFN-γ. Age-matched healthy donors were also analyzed; 2 representative donors are shown. The analysis revealed the EBERPOS cell expressed markers consistent with memory T cells: they were activated and proliferative, they were not Tregs, and they expressed significant amounts of proinflammatory cytokines. In contrast, the EBERNEG CD4+ T cells closely resembled the phenotype and function of the healthy donor CD4+ T cells.
EBERPOS and EBERNEG cells exhibit differences in their phenotype and function. (A) EBERPOS and EBERNEG CD4 T cells from patients 3 and 4 were stained for CCR7 and CD45RA, (B) Ki-67 and CD38, (C) Foxp3 and CD25, and (D) TNF-α and IFN-γ. Age-matched healthy donors were also analyzed; 2 representative donors are shown. The analysis revealed the EBERPOS cell expressed markers consistent with memory T cells: they were activated and proliferative, they were not Tregs, and they expressed significant amounts of proinflammatory cytokines. In contrast, the EBERNEG CD4+ T cells closely resembled the phenotype and function of the healthy donor CD4+ T cells.
Examination of markers of Tregs, FoxP3 and CD25, revealed the EBERPOS cells were not Tregs. Furthermore, there was no evidence of increased numbers of Tregs in the EBERNEG population, compared with healthy donors (range 3% to 4%) (Figure 3C). However, EBV appeared to significantly alter the cytokine expression profile of infected cells in patients 3 and 4. Patient and healthy donor PBMCs were stimulated for 6 hours with phorbol 12-myristate 13-acetate (PMA) and ionomycin in the presence of brefeldin A, followed by intracellular cytokine staining. EBERPOS CD4+ T cells exhibited remarkably different cytokine expression profiles. Although the majority (>70%) of EBERPOS cells from patient 3 produced IL-17A and IFN-γ, the majority (>80%) of EBERPOS cells from patient 4 produced TNF-α and/or IFN-γ (Figure 3D) but little IL-4 and IL-17 (data not shown). In comparison, the EBERNEG CD4+ T cells from both patients exhibited a cytokine expression profile broadly similar to that of healthy donor CD4+ T cells (Figure 3D), with low abundance of IL-4 and IL-17A expressing cells (data not shown).
To investigate whether the EBV infected CD4+ T-cell clones were EBV specific, we tested their capacity to produce IFN-γ in response to stimulation with a panel of HLA II–matched lymphoblastoid cell lines . In these analyses, no response was seen (data not shown); however, further studies are required to determine the specificity of the EBV-infected CD4+ T cells.
EBV-infected T cells are refractory to treatment
We received blood from patient 3 following a diagnosis of HLH; the peripheral blood EBV load was 673 035 EBV DNA copies per milliliter, and the EBERPOS cells accounted for 17% of their total CD4+ T cells (Figure 4A). The patient was treated with corticosteroids and etoposide for the next 6 weeks, based on the HLH-2004 protocol.19 After this initial phase of therapy (8 weeks posttreatment), although the clinical and laboratory features of HLH had resolved, EBV load was consistently >106 copies per milliliter and the proportion of EBERPOS CD4+ T cells had increased >fourfold to 72% (Figure 4A). The total white blood cell (WBC) and lymphocyte counts for pretreatment and posttreatment samples were within the normal ranges, and the counts were very similar (WBC: 4.1 cells per μL vs 8.0 cells per μL for pre- vs posttreatment; lymphocytes: 1.7 cells per μL vs 1.6 cells per μL for pre- vs posttreatment). The patient subsequently underwent an alemtuzumab-based, reduced-intensity conditioned HSCT from a matched unrelated donor. Prior to transplant, the proportion of CD4+ T cells infected with EBV remained high, at ∼50%. Immediately following HSCT, EBV became undetectable in peripheral blood and remained so for >18 months posttransplant, aside from 1 episode of low-level reactivation where we confirmed the virus was exclusively in the B cells, successfully treated with rituximab. However, the patient’s EBV DNA load began to rise rapidly at 21 months posttransplant (from 34 950 to 684 750 copies per milliliter over a 3-week period). At 22 months posttransplant, we confirmed reemergence of EBV-infected CD4+ T cells in the peripheral blood (Figure 4B). The patient died ∼6 weeks after this date. The CD4+ T-cell population comprised 40% of cells positive for TCR-BV8 (Figure 4C), suggesting that the original clone of EBV-infected CD4+ T cells had persisted following transplantation and subsequently recrudesced, leading to disease relapse.
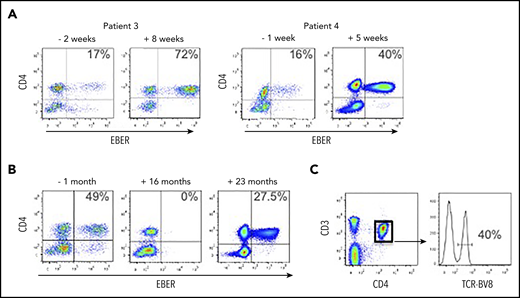
EBV-infected CD4+ T cells are resistant to conventional treatment regimens for CAEBV and HLH. (A) FlowRNA was performed on patient PBMCs to monitor outcome following treatment; both pre- and posttreatment samples are shown for patients 3 and 4. The percentage of EBERPOS CD4+ T cells is shown in the upper right quadrant. The analyses revealed an increase in the number of EBV-infected CD4+ T cells following treatment. (B) FlowRNA performed on PBMCs from patient 3, 1 month before HSCT (−1 month) and 16 months post-HSCT, shows a sustained loss of EBERPOS lymphocytes. However, analysis at 23 months post-HSCT revealed a significant population of EBERPOS CD4+ T cells. The percentage of EBERPOS CD4+ T cells is shown in the upper right quadrant. (C) Analysis of the EBERPOS CD4+ T cells identified at 23 months revealed the reappearance of the EBV-infected TCR-BV8 clone originally identified in the first sample.
EBV-infected CD4+ T cells are resistant to conventional treatment regimens for CAEBV and HLH. (A) FlowRNA was performed on patient PBMCs to monitor outcome following treatment; both pre- and posttreatment samples are shown for patients 3 and 4. The percentage of EBERPOS CD4+ T cells is shown in the upper right quadrant. The analyses revealed an increase in the number of EBV-infected CD4+ T cells following treatment. (B) FlowRNA performed on PBMCs from patient 3, 1 month before HSCT (−1 month) and 16 months post-HSCT, shows a sustained loss of EBERPOS lymphocytes. However, analysis at 23 months post-HSCT revealed a significant population of EBERPOS CD4+ T cells. The percentage of EBERPOS CD4+ T cells is shown in the upper right quadrant. (C) Analysis of the EBERPOS CD4+ T cells identified at 23 months revealed the reappearance of the EBV-infected TCR-BV8 clone originally identified in the first sample.
Patient 4 initially presented with reactive lymphadenopathy, gastritis with benign histological appearances, and high EBV load. After 6 months, a gastric biopsy demonstrated a dense infiltration of mature T cells, predominantly EBV+ CD4+ and an EBV load of 1 393 353 EBV DNA copies per milliliter. We received our initial sample at this point where EBERPOS cells accounted for 16% of their total CD4+ T cells. He received steroid treatment followed by GDP (gemcitabine, dexamethasone, cisplatin) chemotherapy with some initial clinical improvement. Subsequent EBV load showed a climb to >8 000 000 EBV DNA copies per milliliter, and the proportion of EBERPOS CD4+ T cells increased 2.5-fold to 40% (Figure 4A). He was planned for SMILE (dexamethasone, methotrexate, ifosfamide, asparaginase, etoposide) chemotherapy but became acutely unwell and died due to bowel ischemia.
Phenotype and function of EBV-infected CD4+, CD8+ T+, and NK cells from aggressive NK leukemia
At initial presentation with HLH, the vast majority of EBERPOS cells were CD56high NK cells, with small additional populations of EBERPOS CD4+ and CD8+ T cells. We therefore examined the phenotype and function of all infected subsets and their EBERNEG counterparts. As observed in patients 3 and 4, EBV infection of the CD4+ and CD8+ T cells from patient 5 was restricted to cells without CD45RA and CCR7 expression, consistent with a memory phenotype (Figure 5A,E); the EBERNEG T cells and matched healthy controls maintained the expected distribution of naive and memory CD4+ T-cell populations. However, the EBERPOS CD4+ T cells completely lacked expression of the activation/proliferation markers CD38 and Ki67, with expression matching that of the EBERNEG CD4+ T cells and matched healthy controls, suggesting EBV had not activated these infected cells. Furthermore, the EBERPOS CD8+ T cells exhibited low levels of activation but little evidence of proliferation (Figure 5B,F).
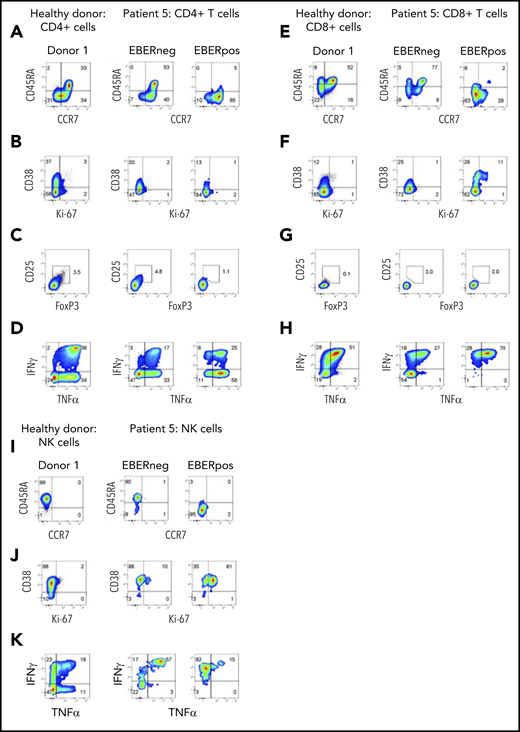
Phenotype and function of EBERPOS T and NK cells from patient 5. FlowRNA analysis of EBERPOS and EBERNEG CD4+ and CD8+ T cells from patient 5. PBMC were stained for CCR7 and CD45RA (A,E), Ki-67 and CD38 (B,F), Foxp3 and CD25 (C,G), and TNF-α and IFN-γ (D,H). Age-matched healthy donors were also analyzed; 1 representative donor is shown. The phenotype and function of the EBERPOS CD4+ T cells closely resembled that of the EBERNEG CD4+ T cells and the healthy donors. The EBERPOS CD8+ T cells were more activated and all expressed IFN-γ and TNF-α. Total NK cells from patient 5 were stained for CD45RA and CCR7 I) (C), Ki-67 and CD38 (J), and TNF-α and IFN-γ (K). Analysis of NK cells from 1 representative healthy donor is shown. All the EBERPOS NK cells were highly activated and replicative, and they all expressed IFN-γ.
Phenotype and function of EBERPOS T and NK cells from patient 5. FlowRNA analysis of EBERPOS and EBERNEG CD4+ and CD8+ T cells from patient 5. PBMC were stained for CCR7 and CD45RA (A,E), Ki-67 and CD38 (B,F), Foxp3 and CD25 (C,G), and TNF-α and IFN-γ (D,H). Age-matched healthy donors were also analyzed; 1 representative donor is shown. The phenotype and function of the EBERPOS CD4+ T cells closely resembled that of the EBERNEG CD4+ T cells and the healthy donors. The EBERPOS CD8+ T cells were more activated and all expressed IFN-γ and TNF-α. Total NK cells from patient 5 were stained for CD45RA and CCR7 I) (C), Ki-67 and CD38 (J), and TNF-α and IFN-γ (K). Analysis of NK cells from 1 representative healthy donor is shown. All the EBERPOS NK cells were highly activated and replicative, and they all expressed IFN-γ.
The EBERPOS CD4+ were not Tregs (CD25−, FoxP3−), and the proportion of Tregs within the EBERNEG or healthy control populations was not increased (Figure 5C,G). However, the majority of EBERPOS CD4+ T cells expressed TNF-α (± IFN-γ) with only a subset expressing neither cytokine (Figure 5D,H). All the EBERPOS CD8+ T cells expressed IFN-γ and TNF-α, or IFN-γ alone. In comparison, over half the EBERNEG CD8+ T-cells expressed neither cytokine.
Finally, we examined the same markers on the NK cells. The EBERPOSCD56high NK cells lacked expression of CD45RA and CCR7 (Figure 5I), unlike the EBERNEG patient and healthy donor NK cells, which expressed CD45RA alone. The entire populations of EBERPOS and EBERNEG NK cells were activated (CD38+), although only the EBERPOS cells coexpressed Ki67 (Figure 5J), and the majority of EBERPOS and EBERNEG NK cells expressed either TNF-α alone or in combination with IFN-γ. In contrast, ∼50% of healthy donor NK cells expressed neither cytokine (Figure 5K). The CD56high NK cells were CD16neg (data not shown).
MDSCs are expanded in the blood of patients
Analysis of fresh patient blood revealed large expansions of cells resembling neutrophils that copurified with PBMCs following density centrifugation. Such cells were present at low abundance in healthy donor blood (n = 6, <0.5% of PBMC) but outnumbered lymphocytes in 3 of the 5 cases (Figure 6A-B). These cells had nuclear morphology typical of cells undergoing granulopoiesis (Figure 6C) and expressed CD11b+, CD15+, CD16+, CD33+ but CD14− and HLA class II (Figure 6D), confirming their identity as G-MDSCs.
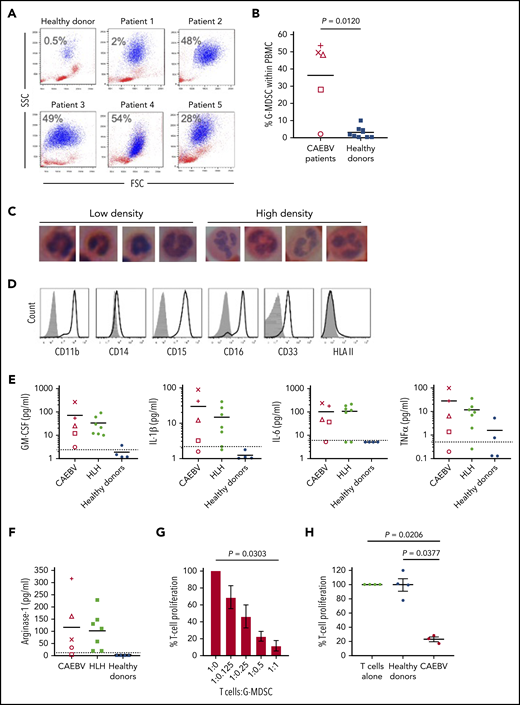
Granulocytic MDSCs are expanded in the blood of patients and potently inhibit T-cell responses. (A) Flow cytometric analysis of fresh patient PBMC by FSC vs SSC showed the presence of large granular cells (G-MDSCs), shown in blue; percentage of G-MDSCs to total PBMCs isolated is shown. A representative healthy donor is shown for comparison. (B) The percentage of G-MDSC is plotted with the mean compared with the mean from 10 healthy donors. A 2-tailed Mann-Whitney test was used to compare groups. (C) Nuclear morphology of G-MDSCs (low density) and neutrophils (high density) revealed characteristic band cell/neutrophil morphology by hematoxylin and eosin staining at ×100 magnification. (D) Flow cytometric analysis of the G-MDSC revealed expression of CD11b, CD15, CD16, CD33 but no expression of HLA II. Isotype controls (gray-filled histogram) are shown. (E) Luminex assays for GM-CSF, IL-1β, IL-6, and TNF-α were performed upon patient plasma and compared with healthy donors. All patients had higher concentrations of these cytokines in their plasma than the healthy donors. Dashed horizontal line indicates the limit of accurate detection. (F) Luminex assay was used to determine the concentration of arginase-1 in the plasma of CAEBV and EBV-HLH patients, and healthy donors. Dashed horizontal line indicates the limit of accurate detection. (G) Inhibition of T-cell proliferation by MDSCs was measured following coculture of T cells with decreasing numbers of G-MDSCs (T:G-MDSC range 1:1 to 1:0.125). The percentage T-cell proliferation in the presence of G-MDSCs is plotted relative to T cells alone. Data shown are an average of 3 patients. (H) The inhibition of T-cell proliferation by G-MDSCs from patients and healthy donors at a T-cell:G-MDSC ratio of 1:1 is plotted. Proliferation is shown relative to control (T cells stimulated in the absence of MDSCs). In panels G-H, a Kruskal-Wallis test was used to compare groups. In panels B, E, and F, each patient is represented by a unique symbol as follows: patient 1 = +, patient 2 = ×, patient 3 = ○, patient 4 = △, and patient 5 = □.
Granulocytic MDSCs are expanded in the blood of patients and potently inhibit T-cell responses. (A) Flow cytometric analysis of fresh patient PBMC by FSC vs SSC showed the presence of large granular cells (G-MDSCs), shown in blue; percentage of G-MDSCs to total PBMCs isolated is shown. A representative healthy donor is shown for comparison. (B) The percentage of G-MDSC is plotted with the mean compared with the mean from 10 healthy donors. A 2-tailed Mann-Whitney test was used to compare groups. (C) Nuclear morphology of G-MDSCs (low density) and neutrophils (high density) revealed characteristic band cell/neutrophil morphology by hematoxylin and eosin staining at ×100 magnification. (D) Flow cytometric analysis of the G-MDSC revealed expression of CD11b, CD15, CD16, CD33 but no expression of HLA II. Isotype controls (gray-filled histogram) are shown. (E) Luminex assays for GM-CSF, IL-1β, IL-6, and TNF-α were performed upon patient plasma and compared with healthy donors. All patients had higher concentrations of these cytokines in their plasma than the healthy donors. Dashed horizontal line indicates the limit of accurate detection. (F) Luminex assay was used to determine the concentration of arginase-1 in the plasma of CAEBV and EBV-HLH patients, and healthy donors. Dashed horizontal line indicates the limit of accurate detection. (G) Inhibition of T-cell proliferation by MDSCs was measured following coculture of T cells with decreasing numbers of G-MDSCs (T:G-MDSC range 1:1 to 1:0.125). The percentage T-cell proliferation in the presence of G-MDSCs is plotted relative to T cells alone. Data shown are an average of 3 patients. (H) The inhibition of T-cell proliferation by G-MDSCs from patients and healthy donors at a T-cell:G-MDSC ratio of 1:1 is plotted. Proliferation is shown relative to control (T cells stimulated in the absence of MDSCs). In panels G-H, a Kruskal-Wallis test was used to compare groups. In panels B, E, and F, each patient is represented by a unique symbol as follows: patient 1 = +, patient 2 = ×, patient 3 = ○, patient 4 = △, and patient 5 = □.
Numerous growth factors and cytokines are thought to drive the expansion and suppressive activity of MDSCs. Luminex assays performed on patient plasma revealed the presence of high concentrations of GM-CSF, IL-1β, IL-6, and TNF-α (Figure 6E) as well as IL-4, IFN-γ, and IL-10 (data not shown) relative to healthy individuals. Additional analysis of plasma from a banked collection of EBV-associated HLH patients (supplemental Table 2) also showed increased concentrations of these same cytokines (Figure 6E). Furthermore, analysis of tissue culture medium from EBV-infected but not EBV-negative T-cell clones established from CAEBV patients contained high concentrations of these cytokines (supplemental Figure 3), suggesting the EBV-infected cells were producing the majority of the cytokines. Interestingly, we cloned EBV-specific CTLs from 1 patient that showed recognition of LMP1 epitopes, exhibiting epitope-specific degranulation and ability to kill autologous cells presenting these epitopes (supplemental Figure 2).
MDSCs are thought to suppress effector T-cell growth and function through several mechanisms, including production of arginase-1. T cells depend on l-arginine for proliferation, and function is particularly sensitive to arginine depletion by arginase-1. Luminex analysis showed an increase in the concentration of arginase-1 in patient plasma compared with healthy donors, where the concentration was below the level of detection (Figure 6F).
MDSCs are highly labile and cryosensitive; therefore, functional studies were performed on freshly isolated patient MDSCs. Ex vivo MDSCs were cocultured with allogeneic T cells prelabeled with tritiated thymidine to analyze the growth of the T cells in the presence of MDSCs. T-cell growth was increasingly suppressed when cocultured with increasing MDSCs at T-cell:MDSC ratios from 1:0.125 up to 1:1, compared with T cells cultured alone (Figure 6G). Furthermore, T cells cocultured with MDSCs at a 1:1 ratio exhibited significant growth inhibition when compared with culture with MDSCs from healthy individuals (P = .0377) and to T-cell growth alone (P = .0206) (Figure 6H).
Discussion
FlowRNA has significant clinical utility. The assay is particularly useful in confirming the differential diagnosis of an EBV-associated B-cell vs T/NK-cell LPD. This timely confirmation is important when considering targeted treatment options, monitoring treatment outcomes, and identifying early relapse. This potential was clearly demonstrated for 1 patient who received HSCT due to EBV-infected CD4+ T cells. Following HSCT, FlowRNA identified an expansion of EBV-infected B cells, which was successfully treated with rituximab. The FlowRNA subsequently detected disease relapse arising from a reemergence of the original EBERPOS CD4+ T-cell clone.
FlowRNA has provided fundamental insights into disease pathogenesis. Although we and others have previously reported infection of >1 lymphocyte subset in patients with T/NK-cell LPDs,10,20 it is not currently known if all infected subsets contribute to the disease. Our data suggest perhaps not. When comparing the activation status of the EBERPOS CD4+ T cells from patients 3, 4, and 5, the CD4+ T cells from patient 5 showed a lack of activation, no difference in cytokine expression between the EBERPOS, EBERNEG, and healthy donor CD4+ T cells, and lack of clonality. In the context of multiple subset infection, these EBERPOS CD4+ T cells may be bystander infections that contribute little to the overall disease pathogenesis and may represent early infection of progenitor cells before TCR rearrangement.
Decreases in CD3 and TCR expression were noted on all EBERPOS T cells relative to their uninfected counterparts. As exemplified in patient 4, high level of activation is known to decrease cell-surface levels of CD3 and TCR, and indeed these cells coexpressed high levels of activation markers, CD38 and Ki67. Interestingly, EBV infection appears to be restricted to CD45RA−/CCR7− memory T cells, reminiscent of B-cell infection where EBV drives germinal center-independent mutagenesis and clonal evolution of immunoglobulin genes in naive B cells to make them resemble memory B cells.21 Perhaps EBV also drives TCR-independent differentiation of memory T cells.
Although the clonal EBERPOS CD4+ T cells were consistent in their differentiation and activation status, their cytokine expression profile differed. Although we expected these differences would cosegregate with clinical presentation, this was not the case. Instead, infected CD4+ T cells exhibited differing cytokine expression profiles, irrespective of the disease. This suggests that EBV infection does not inhibit the functional differentiation of CD4+ T cells. Interestingly, the uninfected CD4+ T cells from patients and healthy donors were remarkably similar in phenotype and function, suggesting uninfected cells were unaffected by the chronic inflammatory microenvironment.
Understanding how EBV-infected T and NK cells evade immune surveillance is of fundamental importance, particularly in the context of limited effective therapeutic options. MDSCs play a pivotal role in suppressing host immunity. Although most intensively studied in cancer, MDSCs are also generated during chronic viral infection (including hepatitis C virus, HIV, and hepatitis B virus), where they modulate the immunopathology and inhibit antiviral T-cell responses.22-24 Although evidence presented in this report demonstrates in vitro inhibition of T-cell growth by patients’ MDSCs, it is entirely possible that the MDSCs may also inhibit the antiviral responses, as reported in chronic infection scenarios, enabling persistence of EBV-infected cells; however, this does require further investigation. Mechanisms of MDSC-mediated inhibition of T-cell growth and function are known to include arginase-1, reactive oxygen, and nitrogen species. These mechanisms can be blocked by inhibitors, resulting in expansion of T cells in the presence of MDSCs. Although the lack of patient samples precluded these inhibition experiments, raised concentrations of arginase-1 in patient plasma suggest these mechanisms may play at least some role in the inhibition of T-cell growth and function in these patients.
The activation and expansion of MDSCs are achieved, at least in part, by expression of growth factors (GM-CSF, granulocyte colony-stimulating factor) and proinflammatory cytokines (IL-1β, IL-6, TNF-α).25,26 These factors are often highly induced in chronic infection and stimulate the activation of myeloid progenitors, but may also drive the expansion and activation of MDSCs.27,28
This study has shown EBV-infected T/NK cells appeared to be refractory to treatment with the HLH2004 regimen containing etoposide, dexamethasone, and cyclosporin A. For our evaluable patients, the number of EBV-infected cells increased in number, whereas the total WBC and lymphocyte counts remained within the normal range and both the pre- and the posttreatment samples were numerically similar. The expansion of infected cells following treatment suggests that a subset of infected cells was resistant to etoposide and was able to rapidly grow following the end of treatment. However, further studies are required to determine if infected cells expanded throughout the course of treatment or after treatment stopped. Corticosteroid treatment, usually dexamethasone or methylprednisolone, is a central component of commonly used protocols for EBV-associated HLH and CAEBV. The rationale for steroid-containing regimens is suppression of the transcription of T-cell effector cytokines. However, an important consequence is the loss of effector T cells. These effector T cells may play a role in controlling the outgrowth of EBV-infected cells, and their loss may contribute to the expansion of infected cells following treatment. Therefore, one of 2 mechanisms could be restricting the outgrowth of EBV-infected T/NK cells: the MDSCs themselves or residual activity of endogenous EBV-specific CTLs. In either scenario, corticosteroids would disrupt this restriction, leading to unchecked expansion of infected T/NK cells.
Although only demonstrated in a small number of patients, these data have major implications for therapy. The FlowRNA assay will enable a thorough examination of how the number and function of EBV-infected T/NK-cells impact disease outcome and relapse following therapy and provide a better understanding of the implications of using agents such as etoposide and corticosteroids as first-line therapy. Furthermore, the presence of MDSCs in other chronic viral infections has a significant impact on the disease outcome, particularly when considering the use of cell-based therapies. A thorough understanding of the role of MDSCs in EBV-associated HLH and CAEBV will enable a more targeted approach to treat these patients without the need for resorting to stem cell transplants.
For original data, please contact the corresponding author, Claire Shannon-Lowe, at c.shannonlowe@bham.ac.uk.
The publication costs of this article were defrayed in part by page charge payment. Therefore, and solely to indicate this fact, this article is hereby marked “advertisement” in accordance with 18 USC section 1734.
The online version of this article contains a data supplement.
Acknowledgments
This work was supported by grants from the Medical Research Council, MR/N023781/1 (C.S.-L.) and the Histiocytosis Society (C.S.-L.).
Authorship
Contribution: P.J.C., L.G., H.P., G.R., C.D.S., F.M., H.L., and C.S.-L. performed experiments; P.J.C., C.P.F., H.L., and C.S.-L. conceived the experimental approach; P.J.C., C.P.F., and C.S.-L. wrote the paper; and C.P.F., L.G., and D.L. provided clinical input.
Conflict-of-interest disclosure: The authors declare no competing financial interests.
Correspondence: Claire Shannon-Lowe, Institute for Immunology and Immunotherapy, University of Birmingham, Vincent Dr, Birmingham B15 2TT, United Kingdom; e-mail: c.shannonlowe@bham.ac.uk.

This feature is available to Subscribers Only
Sign In or Create an Account Close Modal