

Key Points
A subgroup of HSCs that escapes from Thpo deprivation gains quiescence and retains stem cell potential with a high dose of romiplostim.
Liver-specific Thpo deficient-mice exhibit residual HSC stem cell potential, suggesting the extrahepatic Thpo production for hematopoiesis.

Abstract
Hematopoietic stem cells (HSC) rarely divide, rest in quiescence, and proliferate only upon stress hematopoiesis. The cytokine thrombopoietin (Thpo) has been perplexingly described to induce quiescence and promote self-renewal divisions in HSCs. To clarify the contradictory effect of Thpo, we conducted a detailed analysis on conventional (Thpo−/−) and liver-specific (Thpofl/fl;AlbCre+/−) Thpo-deletion models. Thpo−/− HSCs exhibited profound loss of quiescence, impaired cell cycle progression, and increased apoptosis. Thpo−/− HSCs also exhibited diminished mitochondrial mass and impaired mitochondrial bioenergetics. Abnormal HSC phenotypes in Thpo−/− mice were reversible after HSC transplantation into wild-type recipients. Moreover, Thpo−/− HSCs acquired quiescence with extended administration of a Thpo receptor agonist, romiplostim, and were prone to subsequent stem cell exhaustion during competitive bone marrow transplantation. Thpofl/fl;AlbCre+/− HSCs exhibited similar stem cell phenotypes but to a lesser degree compared with Thpo−/− HSCs. HSCs that survive Thpo deficiency acquire quiescence in a dose-dependent manner through the modification of their metabolic state.
Introduction
Hematopoietic stem cells (HSCs) residing in the bone marrow (BM) are essential for life-long hematopoiesis. To sustain a substantial pool of healthy stem cells in the BM, HSCs rarely divide and are quiescent.1-3 Preservation in a quiescent state protects HSCs from functional exhaustion by limiting the accumulation of replicative stress–induced insults, such as reactive oxygen species and DNA damage.4 Therefore, cell cycle quiescence is a fundamental property of HSCs, and loss of quiescence parallels the loss of long-term regenerative potential in HSCs5 .
The cytokine thrombopoietin (Thpo) stimulates HSCs through binding to its receptor myeloid proliferative leukemia (Mpl).6 Thpo has been characterized as one of the few cytokines that directly regulates quiescent HSCs.7,8 Thpo−/− and Mpl−/− mice exhibit severe loss of quiescent HSCs.7 Nonetheless, Thpo-Mpl signaling also stimulates proliferation and self-renewal of HSCs. Exogenous administration of Thpo mimetic drugs allows HSCs to exit quiescence and proliferate.4 High-resolution single HSC divisional tracking indicated that, among various receptor agonists, only Mpl receptor agonists stimulated self-renewal divisions of HSCs.9 Although Thpo-Mpl signaling effectuates opposing cell cycle states on HSCs, no study has addressed how these outcomes are differentiated and whether the effects are dose dependent.
Although HSCs rely on glycolysis for immediate energy production, they harbor considerable amounts of mitochondria.10,11 To avoid production of reactive oxygen species (ROS) and metabolic stress, HSCs lower their mitochondrial activity.12 Mitochondria membrane potential (MMP) paradoxically relates to stem cell potential; HSCs with high MMP are low in stem cell potential. However, a recent analysis of HSCs from mito-dendra2 mice, in which mitochondrial mass is quantified with dendra2 fluorescence expression, revealed that HSCs possess higher mitochondrial mass compared with progenitor cells.13 Also using mito-dendra2 mice, we reported that HSCs expressing higher dendra2 fluorescence are quiescent and repopulate at a higher efficiency than do HSCs expressing low dendra2.14 Moreover, mitochondria fusion regulated lymphoid-biased differentiation potential in HSCs.15 We recently identified that rapid stimulation of Thpo-Mpl signaling enhances megakaryocyte lineage differentiation through the upregulation of mitochondria metabolism in HSCs.16 However, it is not clear whether and how Thpo-Mpl signaling regulates HSC potential and quiescence through changes in mitochondria bioenergetics.
The quiescent state of HSCs relies on intrinsic and extrinsic regulators. Extrinsic factors are produced locally in the BM HSC niche or remotely in extramedullary organs.17 Recently, it was reported that Thpo for HSC regulation was produced solely in the liver.18 Cell-specific deletion of Thpo in megakaryocytes, osteoblasts, and mesenchymal stromal cells did not alter HSC stem cell potential, whereas Thpo depletion in liver cells emulated the reduction in HSCs observed in Thpo−/− mice. However, although the reduction in HSC number indicates decreased HSC stem cell potential in the whole BM, stem cell potential or the cell cycle state of individual stem cells that survive Thpo deficiency has not been investigated. Also, Thpo messenger RNA (mRNA) expression has been reported in other organs (eg, kidney), cells (eg, smooth muscle cells), and macrophages.19,20 Furthermore, in clinical settings, aplastic anemia is an infrequent complication of liver failure.21,22 These facts offer the possibility that Thpo production is regulated by sites other than the liver.
To gain a detailed understanding of Thpo-Mpl signaling on regulating HSC quiescence, we analyzed Thpo−/− and Thpofl/fl;AlbCre+/− HSCs in detail. Thpo−/− HSCs were apoptotic and impaired in mitochondria bioenergetics. Thpofl/fl;AlbCre+/− HSCs exhibited a similar HSC phenotype yet with a lesser extent of damage. Administration of romiplostim restored mitochondria function and regulated quiescence in Thpo−/− HSCs. Moreover, Thpo−/− HSCs retained reconstitution potential, even after continuous stimulation with romiplostim. Our data reveal that a subpopulation of HSCs that escapes Thpo deprivation acquires quiescence through Thpo-Mpl signaling in a dose-dependent manner that involves the modification of metabolism.
Methods
Animal models
mito-dendra2 transgenic [Gt(ROSA)26Sortm1.1(CAG-COX8A/dendra2)Dcc] mice and Alb-Cre [B6.Cg-Speer6-ps1Tg(Alb-cre)21Mgn/J] mice were obtained from The Jackson Laboratory. Thpofl/fl mice were produced in-house23 and crossed with Alb-Cre mice to generate liver-specific Thpo conditional-knockout mice. Details about mouse models and study design are provided in supplemental Methods, available on the Blood Web site.
Flow cytometric analysis
Flow cytometric analysis was performed as described previously.24 Information about antibodies and detailed method are available in supplemental Methods. Flow cytometric analysis and sorting were conducted on BD FACSAria II Cell Sorter.
BM transplantation
Competitor cells (Ly5.1) plus 500 long-term HSCs (Ly5.2) were transplanted into lethally irradiated C57BL/6-Ly5.1 congenic mice. Secondary transplantations were performed using 2 × 10⁶ BM mononuclear cells (MNCs) from primary recipients. Peripheral blood (PB) donor chimerism was analyzed monthly. Recipient mice were euthanized for analysis 4 months post-BM transplantation.
Droplet digital polymerase chain reaction for mitochondrial quantification and qPCR assay
Total RNA was isolated using an RNeasy Mini Kit (QIAGEN) and was reverse transcribed with SuperScript VILO (Invitrogen). Quantitative polymerase chain reaction (qPCR) assays were performed using an Applied Biosystems 7500 Fast Real-Time PCR System. Details about primers and analysis are available in supplemental Methods.
RNA sequencing and gene set enrichment analysis
For RNA sequencing, RNA from up to 5000 HSCs was purified and extracted. Library preparation and sequencing were conducted at Novogene on a HiSeq 4000 System (150-bp paired-end; Illumina). Details are available in supplemental Methods.
Statistical analysis
Statistical details about experiments are provided in the figure legends. All results are expressed as the mean ± standard deviation unless otherwise specified. All experiments were repeated at least twice as independent experiments.
Results
Thpo deficiency inhibits cell cycle progression, induces apoptosis, and impairs mitochondrial function in HSCs
HSCs from Thpo−/− mice lose quiescence and diminish significantly in number with age.7 We generated a Thpo−/− mouse model by deleting exons 2 and 3 from the Thpo gene using a CRISPR/Cas9 system.16 Identical to previous reports, adult Thpo−/− mice exhibited a significant decrease in the numbers of PB platelets and BM HSCs (Figure 1A-B). Cell cycle analysis using Ki-67 and Hoechst 33342 staining also revealed a significant decrease in G0 phase HSCs (Figure 1C-D). Despite the decrease in frequency in the G0 phase, HSCs from Thpo−/− mice failed to enter the S/G2/M phase; instead, they exhibited an increase in frequency during the subG1 phase, suggestive of a preapoptotic state (Figure 1C-D). A significant increase in Annexin V staining confirmed that Thpo−/− HSCs were apoptotic (Figure 1E). Consistent with increased apoptosis, Thpo−/− HSCs decreased significantly in cell size, an indication of the cell shrinkage associated with early apoptosis and functional failure of cells (Figure 1F).25 Increased apoptosis in HSCs has not been reported for Thpo−/− mice. Given that Thpo-Mpl signaling enhances mitochondria function16 and apoptosis involves changes in mitochondria, we next examined the mitochondria volume of Thpo−/− and Thpo+/+ HSCs. Thpo−/− and Thpo+/+ mice were crossed with mito-dendra2 mice to detect fluorescence-labeled mitochondria. HSCs from Thpo−/−;mito-dendra2 mice exhibited significantly low dendra2 fluorescence (Figure 1G). Also, Thpo−/− HSCs exhibited significantly low mitochondrial copy number (Figure 1H) and adenosine triphosphate (ATP) content (Figure 1I). These data suggest that Thpo deficiency induced apoptosis and degraded the mitochondria profile of HSCs.
![Thpo deficiency inhibits cell cycle progression, induces apoptosis, and impairs mitochondrial function in HSCs. (A) PB platelet counts in Thpo+/+ and Thpo−/− mice (n > 5). (B) Representative flow cytometric plot of BM HSCs (Lin- cKit+ Sca1+ CD48− CD150+ CD34−) and quantification of BM HSC number in Thpo+/+ and Thpo−/− mice (n > 5). (C) Representative flow cytometric plot of cell cycle analysis of Thpo+/+ and Thpo−/− HSCs using Ki-67 and Hoechst 33342 staining. (D) Frequency of cell cycle states (G0, G1, S/G2/M and subG1) in Thpo+/+ and Thpo−/− HSCs (n = 4). (E) Representative flow cytometric plot and quantification (mean fluorescence intensity [MFI]) and percentage of positively gated cells) of Annexin V staining in Thpo+/+ and Thpo−/− HSCs (n = 4). (F) Representative flow cytometric plot and MFI of FSC parameter in Thpo+/+ and Thpo−/− HSCs (n = 4). (G) Representative flow cytometric plot and MFI of dendra2 fluorescence in Thpo+/+;mito-dendra2+/− and Thpo−/−;mito-dendra2+/− HSCs (n = 4). (H) Ratio of mitochondrial DNA (mtDNA)/nuclear DNA (nucDNA) quantified using qPCR in Thpo+/+ and Thpo−/− HSCs (n = 4). (I) ATP content measured in luminescence of Thpo+/+ and Thpo−/− HSCs (n > 5). *P < .05, **P < .01, ***P < .001, Student t test (A-B,E-I), Fisher’s least significant difference test (D).](https://ash.silverchair-cdn.com/ash/content_public/journal/blood/137/19/10.1182_blood.2020005517/2/m_bloodbld2020005517f1.png?Expires=1767729458&Signature=vEBESQF5oCRCaAxBi1T-YB3uBMHH1ybpXOsUc0XI3tKfx8MifHAz3hawfCzgUCLXTQk1cVGfiVHqb0qEeLc3nfC4uNZU-qnIQxSXYhUEpou2E2TY3AxGwTLtNTNkv0qM~9u3hZECHTMYq7RMRc1suy5ViQ1-50snISnU31TUxLDa279dCf~AujdGZ6NN-UAIJjLyrFAWqdEhNecxCtn4Mr9haZ7rNXI3qnQuRHAPHPGNYWtv48zkmfHDWfl8mPv46sYBM7oHTCHGuabewDj5DChetApQ~kBeXKu3xiRYiHObrcteDSGctAzs0~5ZZ2HEEG0n-oXaB-bxEaX-DSt3FA__&Key-Pair-Id=APKAIE5G5CRDK6RD3PGA)
Thpo deficiency inhibits cell cycle progression, induces apoptosis, and impairs mitochondrial function in HSCs. (A) PB platelet counts in Thpo+/+ and Thpo−/− mice (n > 5). (B) Representative flow cytometric plot of BM HSCs (Lin- cKit+ Sca1+ CD48− CD150+ CD34−) and quantification of BM HSC number in Thpo+/+ and Thpo−/− mice (n > 5). (C) Representative flow cytometric plot of cell cycle analysis of Thpo+/+ and Thpo−/− HSCs using Ki-67 and Hoechst 33342 staining. (D) Frequency of cell cycle states (G0, G1, S/G2/M and subG1) in Thpo+/+ and Thpo−/− HSCs (n = 4). (E) Representative flow cytometric plot and quantification (mean fluorescence intensity [MFI]) and percentage of positively gated cells) of Annexin V staining in Thpo+/+ and Thpo−/− HSCs (n = 4). (F) Representative flow cytometric plot and MFI of FSC parameter in Thpo+/+ and Thpo−/− HSCs (n = 4). (G) Representative flow cytometric plot and MFI of dendra2 fluorescence in Thpo+/+;mito-dendra2+/− and Thpo−/−;mito-dendra2+/− HSCs (n = 4). (H) Ratio of mitochondrial DNA (mtDNA)/nuclear DNA (nucDNA) quantified using qPCR in Thpo+/+ and Thpo−/− HSCs (n = 4). (I) ATP content measured in luminescence of Thpo+/+ and Thpo−/− HSCs (n > 5). *P < .05, **P < .01, ***P < .001, Student t test (A-B,E-I), Fisher’s least significant difference test (D).
Thpo deficiency inhibits cell cycle progression, induces apoptosis, and impairs mitochondrial function in HSCs. (A) PB platelet counts in Thpo+/+ and Thpo−/− mice (n > 5). (B) Representative flow cytometric plot of BM HSCs (Lin- cKit+ Sca1+ CD48− CD150+ CD34−) and quantification of BM HSC number in Thpo+/+ and Thpo−/− mice (n > 5). (C) Representative flow cytometric plot of cell cycle analysis of Thpo+/+ and Thpo−/− HSCs using Ki-67 and Hoechst 33342 staining. (D) Frequency of cell cycle states (G0, G1, S/G2/M and subG1) in Thpo+/+ and Thpo−/− HSCs (n = 4). (E) Representative flow cytometric plot and quantification (mean fluorescence intensity [MFI]) and percentage of positively gated cells) of Annexin V staining in Thpo+/+ and Thpo−/− HSCs (n = 4). (F) Representative flow cytometric plot and MFI of FSC parameter in Thpo+/+ and Thpo−/− HSCs (n = 4). (G) Representative flow cytometric plot and MFI of dendra2 fluorescence in Thpo+/+;mito-dendra2+/− and Thpo−/−;mito-dendra2+/− HSCs (n = 4). (H) Ratio of mitochondrial DNA (mtDNA)/nuclear DNA (nucDNA) quantified using qPCR in Thpo+/+ and Thpo−/− HSCs (n = 4). (I) ATP content measured in luminescence of Thpo+/+ and Thpo−/− HSCs (n > 5). *P < .05, **P < .01, ***P < .001, Student t test (A-B,E-I), Fisher’s least significant difference test (D).
Stem cell phenotype of HSCs from Thpo−/− mice is reversible
BM HSCs are not completely depleted in Thpo−/− mice; Thpo−/− mice exhibited less than one tenth of the total HSC number observed in Thpo+/+ mice. Therefore, we assessed whether the stem cell phenotype of residual HSCs in Thpo−/− mice responded to Thpo receptor agonist stimulation. Romiplostim was administered IV to Thpo+/+ mice (Thpo+/+ Ro mice) or Thpo−/− mice (Thpo−/− Ro mice) for 10 days. PB platelet count in Thpo−/− mice started to increase after 4 days of administration (data not shown) and recovered to physiological levels by day 10 (Figure 2A; supplemental Figure 1A). Thpo+/+ HSCs initially expanded but then declined and did not exhibit any change after 10 days of romiplostim administration (Figure 2B; supplemental Figure 1B-C). HSCs from Thpo−/− mice expanded approximately fivefold with 10 days of romiplostim administration (Figure 2B). Romiplostim induced a significant increase in the percentage of S/G2/M and G1 phase cells in Thpo+/+ mice (Figure 2C; supplemental Figure 1D). Interestingly, although romiplostim stimulated proliferation and significantly decreased the percentage of G0 HSCs in Thpo+/+ mice, it increased the percentage of G0 HSCs in Thpo−/− mice (Figure 2C). This indicates that the restoration of Thpo signaling in Thpo−/− mice stimulates HSCs to enter quiescence. The percentage of S/G2/M phase HSCs from Thpo−/− mice did not exhibit a significant change, indicating that quiescent HSCs preferentially increased in number with romiplostim in Thpo−/− mice (supplemental Figure 1D).
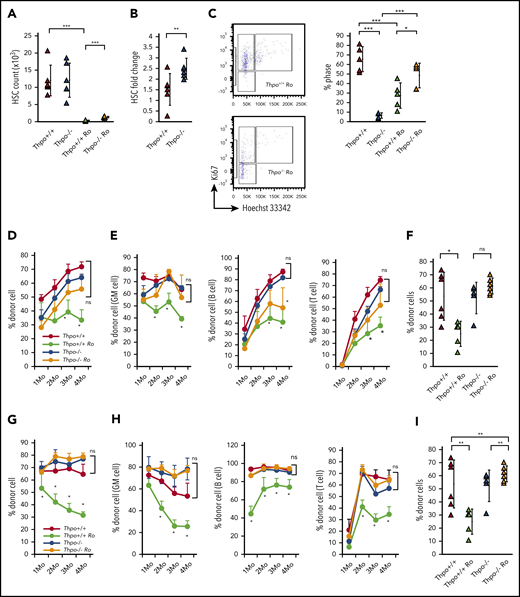
Stem cell phenotype of HSCs from Thpo−/− mice is reversible. (A) PB platelet count fold change in Thpo+/+, Thpo−/−, Thpo+/+ Ro, and Thpo−/− Ro mice (n > 5). (B) Fold change in HSC number in BM (2 femurs and 2 tibias) of Thpo+/+, Thpo−/− with romiplostim treatment. (C) Representative flow cytometric plot of cell cycle analysis Thpo+/+ Ro and Thpo−/− Ro HSCs and percentage of HSCs in the G0 stage in Thpo+/+, Thpo−/−, Thpo+/+ Ro, and Thpo−/− Ro HSCs. (D-F) Primary competitive BM transplantation of 500 HSCs isolated from Thpo+/+, Thpo−/−, Thpo+/+ Ro, or Thpo−/− Ro mice (n = 5). (D) PB chimerism of total mononuclear cells. (E) PB chimerism of GM cells (Mac1+ Gr1+), B cells (B220+), and T cells (CD4+ CD8+). (F) BM chimerism of HSCs (Lin− cKit+ Sca1+ CD48- CD150+ CD34−). (G-I) Secondary competitive BM transplantation of 2 × 10⁶ BM mononuclear cells isolated from recipients of primary BM transplantation. (G) PB chimerism of total mononuclear cells (n = 5). (H) PB chimerism of GM cells, B cells, and T cells (n = 5). (I) BM chimerism of HSCs (n = 5). *P < .05, **P < .01, Student t test (A-B), Fisher’s least significant difference test (C), Tukey test (D-I).
Stem cell phenotype of HSCs from Thpo−/− mice is reversible. (A) PB platelet count fold change in Thpo+/+, Thpo−/−, Thpo+/+ Ro, and Thpo−/− Ro mice (n > 5). (B) Fold change in HSC number in BM (2 femurs and 2 tibias) of Thpo+/+, Thpo−/− with romiplostim treatment. (C) Representative flow cytometric plot of cell cycle analysis Thpo+/+ Ro and Thpo−/− Ro HSCs and percentage of HSCs in the G0 stage in Thpo+/+, Thpo−/−, Thpo+/+ Ro, and Thpo−/− Ro HSCs. (D-F) Primary competitive BM transplantation of 500 HSCs isolated from Thpo+/+, Thpo−/−, Thpo+/+ Ro, or Thpo−/− Ro mice (n = 5). (D) PB chimerism of total mononuclear cells. (E) PB chimerism of GM cells (Mac1+ Gr1+), B cells (B220+), and T cells (CD4+ CD8+). (F) BM chimerism of HSCs (Lin− cKit+ Sca1+ CD48- CD150+ CD34−). (G-I) Secondary competitive BM transplantation of 2 × 10⁶ BM mononuclear cells isolated from recipients of primary BM transplantation. (G) PB chimerism of total mononuclear cells (n = 5). (H) PB chimerism of GM cells, B cells, and T cells (n = 5). (I) BM chimerism of HSCs (n = 5). *P < .05, **P < .01, Student t test (A-B), Fisher’s least significant difference test (C), Tukey test (D-I).
To assess changes in stem cell potential with Thpo deficiency and romiplostim rescue, we performed competitive BM transplantation using 500 highly purified HSCs (Lin− cKit+ Sca1+ CD150+ CD48− CD34−) from 4 groups of donor mice: Thpo+/+ mice, Thpo−/− mice, Thpo+/+ Ro mice, and Thpo−/− Ro mice. Donor-derived cell chimerism in all PB MNCs revealed that Thpo−/− HSCs repopulated recipient mice, with no significant difference compared with Thpo+/+ HSCs (Figure 2D). Thpo−/− HSCs repopulated similarly to Thpo+/+ HSCs in all PB white blood cell lineages (granulocyte-monocyte [GM cells], B cells, and T cells) (Figure 2E). PB chimerism of Thpo+/+ Ro HSCs was reduced significantly compared with Thpo+/+ or Thpo−/− HSCs (Figure 2D-E). On the contrary, Thpo−/− Ro HSCs exhibited a repopulation potential that was comparable to Thpo+/+ or Thpo−/− HSCs for PB chimerism (Figure 2D-E). BM chimerism of donor-derived cells analyzed at 4 months after BM transplantation exhibited the same pattern as PB chimerism, in which Thpo+/+ Ro HSCs had decreased repopulation potential compared with the other groups (Figure 2F; supplemental Figure 1E). The reconstitution pattern of various BM lineages revealed a decrease in megakaryocyte progenitors (MkPs) and erythroid reconstitution (primitive erythroid cells) in Thpo+/+ Ro HSCs compared with Thpo+/+ HSCs (supplemental Figure 1F). Thpo−/− Ro HSCs exhibited high repopulation for common lymphoid progenitor cells (supplemental Figure 1F). Secondary BM transplantation of the 4 groups resulted in similarly decreased PB and BM HSC reconstitution of Thpo+/+ Ro HSCs (Figure 2G-I; supplemental Figure 1G). Compared with Thpo+/+, Thpo−/−, and Thpo−/− Ro HSCs, Thpo+/+ Ro HSCs exhibited low chimerism in myeloid, lymphoid, and erythroid lineages upon secondary BM transplantation (supplemental Figure 1H). There was no difference between lineage repopulation among Thpo+/+, Thpo−/−, and Thpo−/− Ro HSCs (supplemental Figure 1H). Collectively, these data indicate that, although Thpo−/− HSCs are reduced in number, they can retain stem cell potential. Also, Thpo−/− HSCs can enter quiescence, resist exhaustion, and retain repopulation potential upon continuous stimulation with romiplostim.
HSC phenotype is mitigated in Thpofl/fl;AlbCre+/− knockout mice
To investigate whether tissue-specific deletion of Thpo altered the cell cycle state of HSCs, we generated a Thpofl/fl mouse model using CRISPR/Cas9 to simultaneously insert 2 loxP sites flanking exons 2 and 3 of the Thpo gene.23 Loss of Thpo mRNA expression in the liver of Thpofl/fl; AlbCre+/− mice was confirmed by qPCR (supplemental Figure 2A). In agreement with previous reports, Thpofl/fl; AlbCre+/− mice exhibited marked thrombocytopenia, but they had significantly higher platelet counts compared with Thpo−/− mice (Figure 3A). Thpofl/fl; AlbCre+/− mice also exhibited a significant decrease in BM HSC, premegakaryocytic/erythroid progenitor, and MkP numbers but to a lesser extent compared with Thpo−/− mice (Figure 3B; supplemental Figure 2B-C). Short-term repopulating HSC and multipotential progenitor cell numbers were unaffected in Thpofl/fl;AlbCre+/− mice and Thpo−/− mice (supplemental Figure 2D). Thpofl/fl;AlbCre+/− mice exhibited a significant increase in BM common myeloid progenitor, granulocyte/monocyte progenitor, and primitive erythroid cells compared with Thpo−/− mice (supplemental Figure 2E). Thpofl/fl;AlbCre−/− mice did not exhibit any change in platelet count or BM hematopoietic stem and progenitor cell numbers compared with Thpo+/+ mice (Figure 3A-B; supplemental Figure 2B-E).
![HSC phenotype is mitigated in Thpofl/fl;AlbCre+/− knockout mice. (A-B) PB platelet (Plt) counts (A) and BM HSC number (per femur) (B) in Thpo+/+, Thpo−/−, Thpofl/fl;AlbCre−/−Thpofl/fl;AlbCre+/−, and mice (n > 5). (C) Representative flow cytometric plot of cell cycle analysis and quantification of percentage of HSCs in the G0 phase of Thpo+/+, Thpofl/fl;AlbCre+/−, and Thpo−/− mice (n > 5). (D) Representative flow cytometric plot and quantification (mean fluorescence intensity [MFI] and percentage of positively gated cells) of Annexin V staining in Thpo+/+, Thpofl/fl;AlbCre+/−, and Thpo−/− HSCs (n = 4). (E) MFI of FSC parameter in Thpo+/+, Thpofl/fl;AlbCre+/−, and Thpo−/− HSCs (n = 4). (F) Thpo concentration in blood plasma of Thpo+/+, Thpofl/fl;AlbCre+/−, and Thpo−/− mice (n > 5). *P < .05, **P < .01, Tukey test (A-B,D-F), Fisher’s least significant difference test (C).](https://ash.silverchair-cdn.com/ash/content_public/journal/blood/137/19/10.1182_blood.2020005517/2/m_bloodbld2020005517f3.png?Expires=1767729458&Signature=KKueghRnmzVy1ld0eZjqZnTZwlLsFnTiLrjmwBbXn7cenLlN2ijTx6wkFL95vdCP4HqPS0mwBRU-1UaLWg1ApDVh7cK5GxQRTLPmAoWy12N4EO0wtu~hmqajlqVbUylFJlGfyXEVkOjemhPUSrAxYEmN6b78fZ~c2K5FOtuNUYciJdnHC~qvExYHAeN3Q~73vg~D70UqUQLq9QaYe7wovvfMjxPFMl5JBy~yN7Has8m0Bk9BfRjxltAv3HaEByAzplsV8S6q8KSNnUUgDbzF7I4b4HYBgF43PLZ9l8MFQZruD3sQh265q5rFOGENnEAOj8GJFej7XNfOc3SAHY0apQ__&Key-Pair-Id=APKAIE5G5CRDK6RD3PGA)
HSC phenotype is mitigated in Thpofl/fl;AlbCre+/− knockout mice. (A-B) PB platelet (Plt) counts (A) and BM HSC number (per femur) (B) in Thpo+/+, Thpo−/−, Thpofl/fl;AlbCre−/−Thpofl/fl;AlbCre+/−, and mice (n > 5). (C) Representative flow cytometric plot of cell cycle analysis and quantification of percentage of HSCs in the G0 phase of Thpo+/+, Thpofl/fl;AlbCre+/−, and Thpo−/− mice (n > 5). (D) Representative flow cytometric plot and quantification (mean fluorescence intensity [MFI] and percentage of positively gated cells) of Annexin V staining in Thpo+/+, Thpofl/fl;AlbCre+/−, and Thpo−/− HSCs (n = 4). (E) MFI of FSC parameter in Thpo+/+, Thpofl/fl;AlbCre+/−, and Thpo−/− HSCs (n = 4). (F) Thpo concentration in blood plasma of Thpo+/+, Thpofl/fl;AlbCre+/−, and Thpo−/− mice (n > 5). *P < .05, **P < .01, Tukey test (A-B,D-F), Fisher’s least significant difference test (C).
HSC phenotype is mitigated in Thpofl/fl;AlbCre+/− knockout mice. (A-B) PB platelet (Plt) counts (A) and BM HSC number (per femur) (B) in Thpo+/+, Thpo−/−, Thpofl/fl;AlbCre−/−Thpofl/fl;AlbCre+/−, and mice (n > 5). (C) Representative flow cytometric plot of cell cycle analysis and quantification of percentage of HSCs in the G0 phase of Thpo+/+, Thpofl/fl;AlbCre+/−, and Thpo−/− mice (n > 5). (D) Representative flow cytometric plot and quantification (mean fluorescence intensity [MFI] and percentage of positively gated cells) of Annexin V staining in Thpo+/+, Thpofl/fl;AlbCre+/−, and Thpo−/− HSCs (n = 4). (E) MFI of FSC parameter in Thpo+/+, Thpofl/fl;AlbCre+/−, and Thpo−/− HSCs (n = 4). (F) Thpo concentration in blood plasma of Thpo+/+, Thpofl/fl;AlbCre+/−, and Thpo−/− mice (n > 5). *P < .05, **P < .01, Tukey test (A-B,D-F), Fisher’s least significant difference test (C).
We next assessed the cell cycle state of Thpofl/fl;AlbCre+/−, Thpo+/+, and Thpo−/− HSCs (Figure 3C). Thpofl/fl;AlbCre+/− mice exhibited a significantly higher percentage of HSCs in the G0 phase compared with Thpo−/− mice, whereas the frequency was comparable to that in Thpo+/+ mice. G1 and S/G2/M phase cells were not altered in Thpo+/+, Thpo−/−, or Thpofl/fl;AlbCre+/− mice (supplemental Figure 2F). The percentage of HSCs in the subG1 phase was significantly higher in Thpofl/fl;AlbCre+/− and Thpo−/− mice compared with Thpo+/+ mice (supplemental Figure 2F); however, Thpofl/fl;AlbCre+/− mice exhibited a significantly lower percentage compared with Thpo−/− mice (supplemental Figure 2F). Annexin V staining confirmed an increase in apoptotic HSCs in Thpofl/fl;AlbCre+/− mice but to a lesser extent than in Thpo−/− mice (Figure 3D). Cell size of HSCs forward scatter was unaltered in Thpofl/fl;AlbCre+/− mice compared with Thpo+/+ mice (Figure 3E). Because the HSC phenotype in Thpofl/fl;AlbCre+/− mice was mitigated compared with Thpo−/− mice, we analyzed whether systemic Thpo levels differed between the groups. Although Thpofl/fl;AlbCre+/− and Thpo−/− mice exhibited a significantly lower concentration of Thpo in plasma compared with Thpo+/+ mice, the levels in Thpofl/fl;AlbCre+/− mice were significantly higher than in Thpo−/− mice (Figure 3F). These data indicate that the stem cell phenotype in Thpofl/fl;AlbCre+/− mice is ameliorated compared with Thpo−/− mice and suggest Thpo regulates HSC quiescence in a dose-dependent manner. Furthermore, the data imply the possibility of a secondary source of Thpo production other than the liver.
HSCs from Thpo−/− mice exhibit attenuated oxidative stress upon romiplostim administration
We next assessed whether altered mitochondria bioenergetics in Thpo−/− HSCs was affected by romiplostim administration. Thpo−/−;mito-dendra2 HSCs exhibited an increase in mito-dendra2 fluorescence intensity after 10 days of romiplostim administration (Figure 4A). A recovery in the mitochondrial state of Thpo−/− HSCs with romiplostim was also apparent upon analysis of mitochondrial DNA and ATP content (Figure 4B-C). These data indicate that mitochondria bioenergetics is normalized when Thpo−/− HSCs regain quiescence.
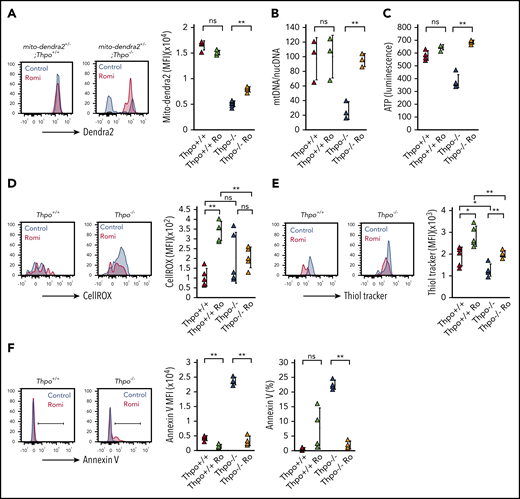
HSCs from Thpo−/− mice exhibit attenuated oxidative stress upon romiplostim administration. (A) Representative plots and mean fluorescence intensity (MFI) of dendra2 fluorescence expressed in HSCs from mito-dendra2+/−;Thpo+/+ and mito-dendra2+/−;Thpo−/− mice, with or without administration of romiplostim (n = 5). (B) Ratio of mitochondrial DNA (mtDNA)/nuclear DNA (nucDNA) quantified by qPCR in Thpo+/+, Thpo−/−, Thpo+/+ Ro, and Thpo−/− Ro HSCs (n = 4). (C) ATP content measured in luminescence of Thpo+/+, Thpo−/−, Thpo+/+ Ro and Thpo−/− Ro HSCs (n > 5). Representative plots and MFI of CellROX staining (D) and ThiolTracker staining (E) in Thpo+/+, Thpo−/−, Thpo+/+ Ro, and Thpo−/− Ro HSCs (n = 5). (F) Representative flow cytometric plot, MFI, and percentage of positively gated cells based on Annexin V staining in Thpo+/+, Thpo−/−, Thpo+/+ Ro, and Thpo−/− Ro HSCs (n = 4). *P < .05, **P < .01, Student t test.
HSCs from Thpo−/− mice exhibit attenuated oxidative stress upon romiplostim administration. (A) Representative plots and mean fluorescence intensity (MFI) of dendra2 fluorescence expressed in HSCs from mito-dendra2+/−;Thpo+/+ and mito-dendra2+/−;Thpo−/− mice, with or without administration of romiplostim (n = 5). (B) Ratio of mitochondrial DNA (mtDNA)/nuclear DNA (nucDNA) quantified by qPCR in Thpo+/+, Thpo−/−, Thpo+/+ Ro, and Thpo−/− Ro HSCs (n = 4). (C) ATP content measured in luminescence of Thpo+/+, Thpo−/−, Thpo+/+ Ro and Thpo−/− Ro HSCs (n > 5). Representative plots and MFI of CellROX staining (D) and ThiolTracker staining (E) in Thpo+/+, Thpo−/−, Thpo+/+ Ro, and Thpo−/− Ro HSCs (n = 5). (F) Representative flow cytometric plot, MFI, and percentage of positively gated cells based on Annexin V staining in Thpo+/+, Thpo−/−, Thpo+/+ Ro, and Thpo−/− Ro HSCs (n = 4). *P < .05, **P < .01, Student t test.
ROS production increased in Thpo+/+ Ro HSCs compared with Thpo+/+ HSCs, yet it was unchanged in Thpo−/− Ro HSCs compared with Thpo−/− HSCs (Figure 4D). Both Thpo−/− Ro HSCs and Thpo+/+ Ro HSCs showed significantly increased staining with ThiolTracker, which reflected an increase in reduced glutathione–mediated elimination of ROS (Figure 4E). Thpo−/− Ro HSCs also exhibited a decline in Annexin V staining compared with Thpo−/− Ro HSCs (Figure 4F). These data suggest that Thpo−/− HSCs may possess protective mechanisms against oxidative stress that facilitate quiescence regulation upon romiplostim stimulation.
Rapid response of HSCs from Thpofl/fl;AlbCre+/− mice to romiplostim
We next examined the response of Thpofl/fl;AlbCre+/− HSCs to romiplostim administration. Because we observed a rapid response of platelet counts in Thpofl/fl;AlbCre+/− mice compared with Thpo−/− mice, mice were analyzed at 5 days after romiplostim administration rather than at 10 days. Although Thpo−/− mice did not exhibit a significant change in platelet count after 5 days of romiplostim administration, the platelet count of Thpofl/fl;AlbCre+/− mice recovered to physiological levels (Figure 5A).Total BM MNC count was comparable among Thpo+/+, Thpo−/−, and Thpofl/fl;AlbCre+/− mice (supplemental Figure 3A). MkP count and percentage recovered rapidly in Thpofl/fl;AlbCre+/− mice compared with Thpo−/− mice (supplemental Figure 3B). Thpofl/fl;AlbCre+/− Ro mice exhibited a significantly higher HSC count compared with Thpo−/− Ro mice (Figure 5B; supplemental Figure 3C). Although an increase in quiescence percentage was not observed in Thpo−/− HSCs at day 5, Thpofl/fl;AlbCre+/− mice exhibited a significant upregulation of quiescent HSCs compared with Thpo+/+ Ro and Thpo−/− Ro mice (Figure 5C). Thpofl/fl;AlbCre+/− Ro HSCs also exhibited a decrease in frequency during the G1 and S/G2/M phases compared with Thpo+/+ Ro and Thpo−/− Ro HSCs (Figure 5C). Thpofl/fl;AlbCre+/− HSCs decreased significantly in the subG1 phase compared with Thpo−/− HSCs (Figure 5D). In vitro assessment of the differentiation potential (in vitro limiting dilution assay) through the colony formation of 1 to 3 HSCs was comparable in Thpofl/fl;AlbCre+/− HSCs and Thpo+/+ HSCs (supplemental Figure 3D). MMP assessed with tetramethylrho‐damine, ethyl ester staining was not significantly different among Thpo+/+ Ro, Thpo−/− Ro, and Thpofl/fl;AlbCre+/− Ro HSCs (Figure 5E). Thpofl/fl;AlbCre+/− Ro HSCs exhibited a significantly higher level of ROS compared with Thpo−/− Ro HSCs (Figure 5F). Therefore, mitochondrial changes may predispose HSCs to enter a quiescent state because mitochondrial changes occurred before Thpo−/− HSCs entered quiescence.
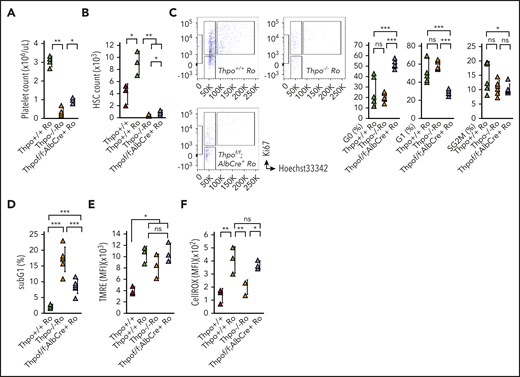
Rapid response of HSCs from Thpofl/fl;AlbCre+/− mice to romiplostim. Romiplostim was administered IV to Thpo+/+, Thpofl/fl;AlbCre+/−, and Thpo−/− mice for 5 consecutive days. (A) PB platelet count in Thpo+/+, Thpofl/fl;AlbCre+/− and Thpo−/− mice treated with romiplostim (Thpo+/+ Ro, Thpofl/fl;AlbCre+/− Ro, and Thpo−/− Ro) (n = 5). (B) BM HSC number in Thpo+/+, Thpo+/+ Ro, Thpofl/fl;AlbCre+/− Ro, and Thpo−/− Ro mice (n = 5). (C) Representative flow cytometric plot and percentage of G0, G1, and S/G2/M HSCs in Thpo+/+ Ro, Thpofl/fl;AlbCre+/− Ro, and Thpo−/− Ro mice (n = 5). (D) Percentage of subG1 HSCs in Thpo+/+ Ro, Thpofl/fl;AlbCre+/− Ro, and Thpo−/− Ro mice (n = 5). Mean fluorescence intensity (MFI) of tetramethylrhodamine, ethyl ester staining (TMRE) (E) and CellROX staining (F) in Thpo+/+,Thpo+/+ Ro, Thpofl/fl;AlbCre+/− Ro, and Thpo−/− Ro mice (n = 5). *P < .05, **P < .01, ***P < .001. Student t test (A-B,D-F), Fisher’s least significant difference test (C).
Rapid response of HSCs from Thpofl/fl;AlbCre+/− mice to romiplostim. Romiplostim was administered IV to Thpo+/+, Thpofl/fl;AlbCre+/−, and Thpo−/− mice for 5 consecutive days. (A) PB platelet count in Thpo+/+, Thpofl/fl;AlbCre+/− and Thpo−/− mice treated with romiplostim (Thpo+/+ Ro, Thpofl/fl;AlbCre+/− Ro, and Thpo−/− Ro) (n = 5). (B) BM HSC number in Thpo+/+, Thpo+/+ Ro, Thpofl/fl;AlbCre+/− Ro, and Thpo−/− Ro mice (n = 5). (C) Representative flow cytometric plot and percentage of G0, G1, and S/G2/M HSCs in Thpo+/+ Ro, Thpofl/fl;AlbCre+/− Ro, and Thpo−/− Ro mice (n = 5). (D) Percentage of subG1 HSCs in Thpo+/+ Ro, Thpofl/fl;AlbCre+/− Ro, and Thpo−/− Ro mice (n = 5). Mean fluorescence intensity (MFI) of tetramethylrhodamine, ethyl ester staining (TMRE) (E) and CellROX staining (F) in Thpo+/+,Thpo+/+ Ro, Thpofl/fl;AlbCre+/− Ro, and Thpo−/− Ro mice (n = 5). *P < .05, **P < .01, ***P < .001. Student t test (A-B,D-F), Fisher’s least significant difference test (C).
Thpo deficiency broadly impairs organelle function and turnover
To gain insight into the cellular and genetic changes associated with Thpo deficiency and quiescence regulation, RNA sequencing was performed on Thpo+/+, Thpo−/−, Thpo+/+ Ro, and Thpo−/− Ro HSCs. Although the Thpo−/− HSC signature deviated from that of Thpo+/+ and Thpo+/+ Ro HSCs, romiplostim administration to Thpo−/− mice shifted the HSC gene signature toward that of Thpo+/+ HSCs (Figure 6A-B). The Thpo−/− HSC signature exhibited a high number of differentially expressed genes compared with Thpo+/+, Thpo−/− Ro, and Thpo+/+ Ro HSCs (Figure 6C; supplemental Figure 4A). Compared with Thpo+/+ HSCs, Thpo−/− HSCs exhibited a loss of HSC gene signature and an enrichment in progenitor cell gene signature (Figure 6D). Enrichment in the HSC gene signature was also observed when Thpo−/− HSCs were compared with the other 3 groups (Thpo+/+, Thpo+/+ Ro, and Thpo−/− Ro [REST]) (Figure 6E; supplemental Figure 4B). Expression of individual HSC-related genes (Eng, Mecom, Procr, Slamf1, Tek, and Vwf) was decreased in Thpo−/− HSCs (supplemental Figure 4C), whereas it was upregulated in Thpo−/− Ro HSCs. In agreement with the increased apoptosis in Thpo−/− HSCs, apoptosis-related gene signature was upregulated in Thpo−/− HSCs compared with Thpo+/+ and REST (Figure 6F). Furthermore, Thpo−/− HSCs exhibited a downregulation of gene sets associated with mitochondria function (supplemental Figure 4D-E) compared with REST.

Thpo deficiency broadly impairs organelle function and turnover. (A-C) Principal component analysis of RNA sequence on Thpo+/+ (wt), Thpo−/− (ko), Thpo+/+ Ro (wtr), and Thpo−/− Ro (kor) HSCs. Heat map analysis (B) and Venn diagram (C) for differentially expressed genes in Thpo+/+ (wt), Thpo−/− (ko), Thpo+/+ Ro (wtr), and Thpo−/− Ro (kor) HSCs. (D) Gene set enrichment analysis (GSEA) analysis of HSC- and progenitor-related gene sets in Thpo+/+ and Thpo−/− HSCs. (E) GSEA analysis for enrichment in HSC-related gene set for Thpo−/− and REST (Thpo+/+, Thpo+/+ Ro, and Thpo−/− Ro HSCs). (F) GSEA analysis of apoptosis-related gene set for Thpo+/+, Thpo−/−, and REST HSCs. (G) Table and GSEA plots showing enrichment in ribosome-associated gene sets upregulated in REST compared with Thpo−/− HSCs. (H) Mean fluorescence intensity (MFI) of OPP incorporation in Thpo+/+, Thpo−/−, and Thpo−/− Ro HSCs (n = 5). (I) Analysis of autophagy-related gene set enrichment in Thpo−/− and REST HSCs. (J) Representative plots and MFI of Cyto-ID staining in Thpo+/+, Thpofl/fl;AlbCre+/−, and Thpo−/− HSCs (n = 5). (K) Representative plot and MFI of Cyto-ID staining in Thpo−/− and Thpo−/− Ro HSCs (n = 5). *P < .05, **P < .01, Student t test. FDR, false discovery rate; NOM, nominal; p-val, P value; q-val, q value.
Thpo deficiency broadly impairs organelle function and turnover. (A-C) Principal component analysis of RNA sequence on Thpo+/+ (wt), Thpo−/− (ko), Thpo+/+ Ro (wtr), and Thpo−/− Ro (kor) HSCs. Heat map analysis (B) and Venn diagram (C) for differentially expressed genes in Thpo+/+ (wt), Thpo−/− (ko), Thpo+/+ Ro (wtr), and Thpo−/− Ro (kor) HSCs. (D) Gene set enrichment analysis (GSEA) analysis of HSC- and progenitor-related gene sets in Thpo+/+ and Thpo−/− HSCs. (E) GSEA analysis for enrichment in HSC-related gene set for Thpo−/− and REST (Thpo+/+, Thpo+/+ Ro, and Thpo−/− Ro HSCs). (F) GSEA analysis of apoptosis-related gene set for Thpo+/+, Thpo−/−, and REST HSCs. (G) Table and GSEA plots showing enrichment in ribosome-associated gene sets upregulated in REST compared with Thpo−/− HSCs. (H) Mean fluorescence intensity (MFI) of OPP incorporation in Thpo+/+, Thpo−/−, and Thpo−/− Ro HSCs (n = 5). (I) Analysis of autophagy-related gene set enrichment in Thpo−/− and REST HSCs. (J) Representative plots and MFI of Cyto-ID staining in Thpo+/+, Thpofl/fl;AlbCre+/−, and Thpo−/− HSCs (n = 5). (K) Representative plot and MFI of Cyto-ID staining in Thpo−/− and Thpo−/− Ro HSCs (n = 5). *P < .05, **P < .01, Student t test. FDR, false discovery rate; NOM, nominal; p-val, P value; q-val, q value.
Protein synthesis levels are stringently regulated for the maintenance of highly potent HSCs.26 Reduction and upregulation result in loss of HSC functions. Some of the highly enriched gene sets in Thpo−/− HSCs involved ribosome-related gene sets (Figure 6G). Therefore, we analyzed protein synthesis in Thpo−/− HSCs using an O-propargyl-puromycin (OPP) incorporation assay. Although the gene expression of ribosomal proteins was downregulated in Thpo−/− HSCs, Thpo−/− HSCs exhibited increased incorporation of OPP compared with Thpo+/+ HSCs (Figure 6H). Thpo−/− Ro HSCs exhibited significantly decreased OPP incorporation, indicating that protein synthesis was downregulated with entry to quiescence. These data indicate that Thpo-Mpl signaling regulates protein turnover for the regulation of quiescence.
The quiescent state of HSCs is also governed by autophagic clearance of healthy mitochondria and reduction of metabolic stress.27 Thpo−/− HSCs exhibited an enrichment in the expression of autophagy-related genes, especially in the genes associated with inhibition of autophagy (Figure 6I). Supporting the expression pattern of autophagy-related genes, Thpo−/− HSCs and Thpofl/fl;AlbCre+/− HSCs exhibited decreased staining with Cyto-ID, indicating decreased autophagy (Figure 6J). Furthermore, Thpo−/− Ro HSCs exhibited higher Cyto-ID staining compared to Thpo−/− HSCs (Figure 6K). These data indicate that Thpo-Mpl signaling is involved with normalization of autophagocytic pro-cesses in HSCs for the entry to quiescence. Collectively, Thpo-Mpl signaling maintains HSC numbers and quiescence through the fine-tuned regulation of organelle homeostasis.
Discussion
Among the few cytokines that directly regulate HSCs, Thpo has been paradoxically characterized to promote quiescence and self-renewal proliferation in HSCs. We show here that the function of Thpo to induce HSC quiescence is dose dependent and involves the modification of metabolic processes.
Cell cycle quiescence is a fundamental property of HSCs that allows the formation of an HSC reserve pool within the BM.5 Loss of quiescence forces HSCs to proliferate and eventually undergo exhaustion.28 Reports have identified Thpo as the major cytokine that governs HSC quiescence. In vivo inhibition of Thpo signaling using an antibody that inhibits Mpl (AMM2) resulted in an increase in quiescent in HSCs.8 Moreover, HSCs from Thpo−/− mice lose cell cycle quiescence, and expression of the cell cycle regulator gene p57Kip2 decreases.7 However, Thpo has also been well characterized for its ability to promote HSC self-renewal proliferation, in vitro and in vivo, with Thpo doses above physiological levels.4,29 Failure of HSCs to expand in vivo has also been reported in Thpo−/− and Mpl−/− mice.7,30 Our analysis of the cell cycle state of Thpo−/− HSCs revealed that Thpo deficiency leads to a loss of quiescence, but without cell cycle progression and exhaustion. A majority of Thpo−/− HSCs fail to enter the S/G2/M phase; rather, they succumb to apoptosis, suggesting an antiapoptotic function in Thpo signaling for the maintenance of BM HSCs. Although Thpo−/− HSCs exhibit a high frequency of apoptosis, a subpopulation of HSCs survived ex vivo manipulation and were capable of long-term repopulation upon competitive BM transplantation. Furthermore, given that Thpo-Mpl signaling protects DNA damage through nonhomologous end-joining repair,31 failure of Thpo−/− HSCs to progress in the cell cycle may involve these pathways. Our data clarify that Thpo-Mpl signaling is essential for HSC quiescence and maintenance of BM HSC numbers through preventing apoptosis.
Although a large number of HSCs do not survive Thpo deficiency, the HSC pool in Thpo−/− mice was not completely depleted. In fact, although romiplostim administration predominantly stimulated proliferation in Thpo+/+ HSCs, we observed that Thpo−/− HSCs responded and entered quiescence with romiplostim. We showed that romiplostim administration for 10 days regulates quiescence in Thpo−/− HSCs, which were previously void of Thpo signaling. The same dose of romiplostim induced cell cycle progression and proliferation in Thpo+/+ HSCs. The increase in quiescence was not observed in Thpo+/+ or Thpo−/− HSCs after 5 days of romiplostim administration (Figure 5C). Furthermore, HSCs from Thpofl/fl;AlbCre+/− mice, which exhibited higher levels of plasma Thpo compared with Thpo−/− mice, also exhibited quiescence after 5 days of romiplostim injections. The difference in response between Thpo+/+ and Thpo−/− HSCs may be attributed to the initial exposure of Thpo-Mpl signaling. Therefore, Thpo−/− HSCs’ response to romiplostim suggests that quiescence regulation and the switch to proliferation may depend on the dose and cumulative exposure history of Thpo.
The number of self-renewal divisions in adult HSCs is reported to be limited during the life span.32 However, the difference in response between Thpo−/− HSCs and Thpo+/+ HSCs is not attributed to less divisional history due to the lack of Thpo, given that young mice (8-10 weeks old) were analyzed. Thpo−/− mice exhibit significantly higher levels of stem cell factor (SCF) in the BM, possibly as compensation for low Thpo levels (data not shown). The compensatory increase in BM SCF suggests that Thpo-deficient HSCs may rely on SCF/cKit signaling for survival. Furthermore, Thpo−/− mice present normal HSC numbers during fetal and neonatal hematopoiesis,7 indicating that HSC expansion during development is intact. Interestingly, fetal and neonatal HSCs are highly proliferative, with enhanced mitochondria bioenergetics (data not shown). The fact that fetal and neonatal HSCs expand regardless of Thpo deficiency indicates an HSC subpopulation that propagates independently of Thpo signaling during development. It is questioned whether Thpo-independent HSCs remain through adulthood and whether they make up the small fraction of HSCs remaining in Thpo−/− mice. Similar to Thpo−/− mice, prolonged injection of romiplostim to neonatal mice increased the number of quiescent HSCs (data not shown). HSCs that survive Thpo-deficient conditions repopulate normally and gain quiescence upon restoration of Thpo signaling, suggesting HSC heterogeneity in response to cytokine signaling. HSC phenotype may be altered during romiplostim treatment, and it is possible that our transplantation assays fail to assess these HSCs. Unbiased assessment with whole BM transplantation assays could be used to identify alterations in stem cell potential. HSCs that are less sensitive to Thpo may represent a subpopulation of HSCs that is resistant to replication and may be the origin of a stable HSC pool in the BM.
The site of Thpo production and how systemic levels of Thpo are maintained for HSC regulation have been controversial. Thpo mRNA has been detected in various organs and tissue cells, such as the liver, BM stromal cells, kidney, and macrophages.33,34 However, during thrombocytopenia, Thpo mRNA levels in the liver and kidney are not affected,34 and binding of Thpo to Mpl-expressing platelets primarily regulates circulating Thpo levels.35,36 Recently, a study using Thpofl/fl mice for conditional deletion of Thpo in liver (Thpofl/fl;AlbCre+/−), osteoblasts (Thpofl/fl;Col2.3Cre+/−), and megakaryocytes (Thpofl/fl;Pf4Cre+/−) revealed that Thpo deletion from hepatocytes impaired HSCs.18 The report concluded that Thpo production was regulated systemically solely by hepatocytes. Through our comparison of Thpofl/fl;AlbCre+/− HSCs with the Thpo−/− HSC phenotype, we observed that Thpofl/fl;AlbCre+/− HSCs exhibit less severe damage. Thpofl/fl;AlbCre+/− mice exhibited a significantly higher number of PB platelets, as well as quiescent HSCs that were less apoptotic than Thpo−/− HSCs. Plasma Thpo levels in Thpofl/fl;AlbCre+/− mice were significantly higher than in Thpo−/− mice, suggesting a source of Thpo production other than the liver. Furthermore, romiplostim regulated quiescence in Thpofl/fl;AlbCre+/− HSCs more rapidly than in Thpo−/− HSCs, which also confirms that HSCs’ response to Thpo signaling is dose dependent. Therefore, systemic Thpo production for HSC maintenance is regulated by organs and tissue cells other than hepatocytes. Future research should address which organs and cells produce Thpo, as well as how this production is regulated.
Our data indicate significantly higher mitochondrial activity in Thpo+/+ HSCs than in Thpo−/− HSCs, this suggests that physiological levels of Thpo may metabolically prime HSCs to proliferate upon stress. RNA-sequencing data revealed that various metabolic processes are affected in Thpo−/− HSCs. Protein synthesis increased in Thpo−/− HSCs and normalized with romiplostim administration. Autophagy was diminished in Thpo−/− HSCs and also upregulated in romiplostim-treated Thpo−/− HSCs. The fact that Thpofl/fl;AlbCre+/− HSCs did not exhibit any change in MMP compared with Thpo−/− HSCs after 5 days of romiplostim administration suggests that mitochondrial changes may exist before entry to quiescence. High mitochondrial mass has been considered a parameter that is associated with high stem cell potential in physiological HSCs.13,14 Although we observed that mitochondrial mass and ATP content in Thpo−/− HSCs recovered with romiplostim, we did not observe an increase in mitochondrial mass or ATP content in Thpo+/+ HSCs upon romiplostim administration. Also, ROS production was minimal and accompanied by a redox response in Thpo−/− HSCs upon romiplostim administration. Alterations in HSC mitochondrial mass and function have not been well monitored during nonphysiological stress hematopoiesis. Our report analyzed various mitochondrial parameters under replicative stress (Thpo+/+ Ro HSCs) and highlights the changes in mitochondrial mass and function upon loss and restoration of Thpo signaling in Thpo−/− HSCs. The difference in metabolic state upon romiplostim administration in Thpo+/+ and Thpo−/− HSCs suggests that HSCs may be heterogeneous in response to cytokine signaling. Nevertheless, our data clearly indicate that changes occur in a wide range of metabolic processes upon quiescence acquisition.
Thpo deficiency does not obliterate adult HSC populations completely, and HSCs that survive Thpo deficiency regain and retain stem cell potential with Thpo signaling. HSCs that escape Thpo deprivation acquire quiescence through modifications of mitochondrial bioenergetics and other metabolic processes. As the indication for Thpo mimetic drugs in various hematopoietic diseases expands, assessing the effects of these drugs on BM HSCs is crucial. The fact that Thpo primes HSCs metabolically may provide new insights into the optimal use of Thpo mimetic drugs in hematopoietic diseases.
The RNA-sequencing data reported in this article have been deposited in the Gene Expression Omnibus database (accession number GSE167004).
Data sharing requests should be sent to Ayako Nakamura-Ishizu (ishizu.ayako@twmu.ac.jp) or Toshio Suda (sudato@keio.jp).
The online version of this article contains a data supplement.
The publication costs of this article were defrayed in part by page charge payment. Therefore, and solely to indicate this fact, this article is hereby marked “advertisement” in accordance with 18 USC section 1734.
Acknowledgments
The authors thank Aled O’Neill for developing and providing Thpo−/− and Thpofl/fl mice.
This study was supported by National Medical Research Council Grant of Singapore Translational Research Investigator Awards (NMRC/STaR/18 may-0004/2019-2023, NMRC STaR /0019/2014) (T.S.), a KAKEN Grant-in-Aid for Scientific Research (S) (18H05284) (T.S.), a KAKEN Grant-in-Aid for Scientific Research (C) (18K08364) (A.N.-I.), the KAKEN Fund for the Promotion of Joint International Research (Fostering Joint International Research) (15KK0350) (A.N.-I.), a grant from the Japan Leukemia Research Fund, a grant from the Japanese Society of Hematology, and a grant from the Astellas Foundation for Research on Metabolic Disorders (A.N.-I.).
Authorship
Contribution: T.S. and A.N.-I. designed the project, analyzed the data, and wrote the manuscript; A.N.-I. organized, performed, and analyzed all experiments; D.W.L.C., T.M., and D.Q.T. discussed, performed, and analyzed some experiments; M.M.-K. and D.J. performed and analyzed some experiments; T.M. discussed and analyzed RNA-sequencing data; and all authors read and approved the final version of the manuscript.
Conflict-of-interest disclosure: The authors declare no competing financial interests.
Correspondence: Ayako Nakamura-Ishizu, Department of Microscopic and Developmental Anatomy, Tokyo Women’s Medical University, 8-1 Kawadacho, Shijukuku, Tokyo 162-8666, Japan; e-mail: ishizu.ayako@twmu.ac.jp and ayaknakm@gmail.com; or Toshio Suda, Cancer Science Institute, National University of Singapore, 14 Medical Dr, MD6, Singapore 117599; e-mail: sudato@keio.jp.

This feature is available to Subscribers Only
Sign In or Create an Account Close Modal